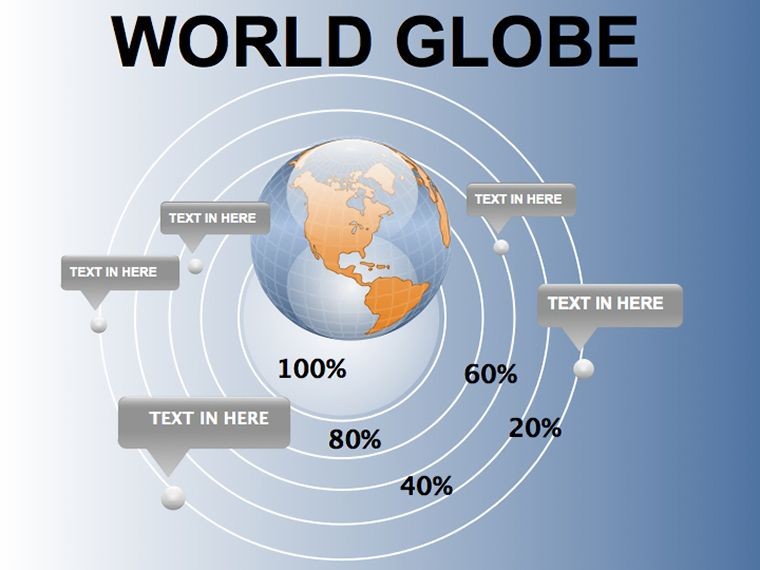
World Globe Keynote Diagrams: Bring Global Perspectives to Your Slides


Type: Keynote Diagrams template
Category: 3D
Sources Available: .key
Product ID: KD00021
Template incl.: 10 editable slides
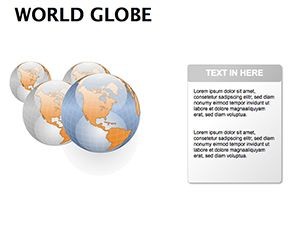
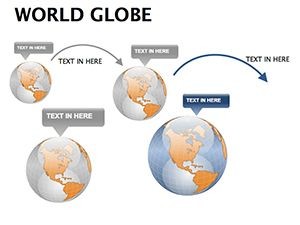
Visualize the world in a new light with our World Globe Keynote Diagrams template, featuring 10 editable 3D slides that make global concepts accessible and engaging. Perfect for educators, policymakers, and researchers, this tool illustrates everything from resource distributions to policy shifts with stunning globe visuals. Drawing on cartographic expertise akin to National Geographic's standards, these diagrams help you convey interconnected global issues effectively. Whether discussing climate change impacts or international trade flows, you'll captivate audiences with rotatable, customizable globes. Exclusively for Keynote, with .key file support, this template integrates smoothly into your workflow, turning data into dynamic stories that span continents.
Essential Features for Worldwide Narratives
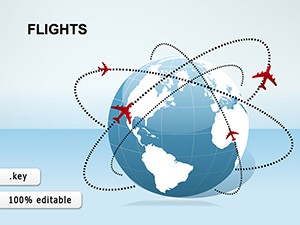
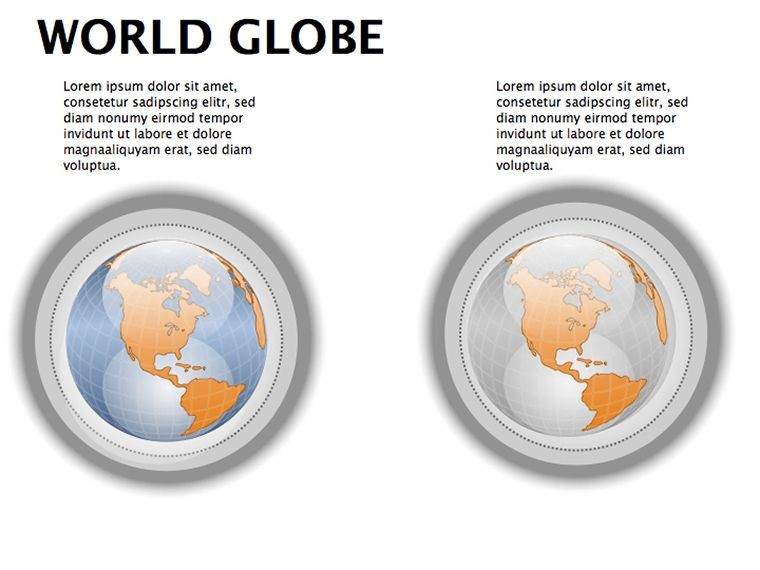
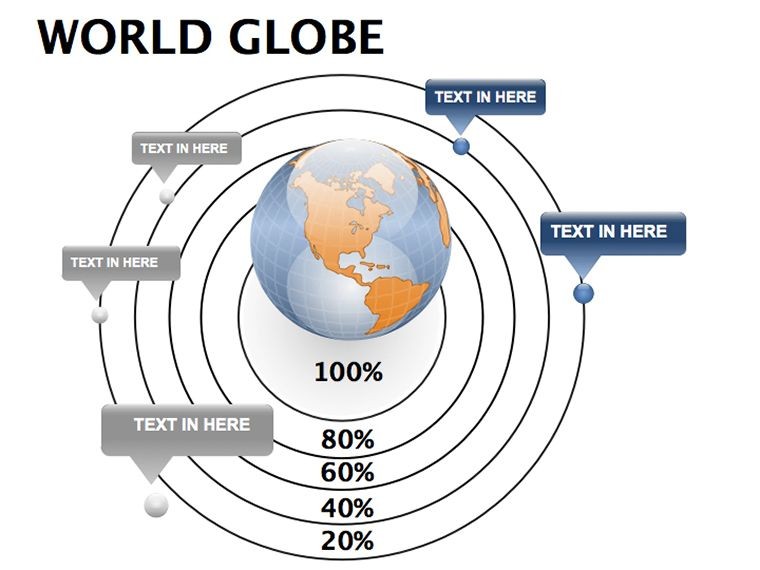
The 3D globe designs are the star, offering interactive elements that rotate and zoom without quality loss, thanks to vector technology. Tailor hues to represent data layers, like blue gradients for ocean resources.
- Rotatable Globes: Show perspectives from any angle.
- Layered Maps: Overlay data for comparisons.
- Icon Overlays: Add markers for key locations.
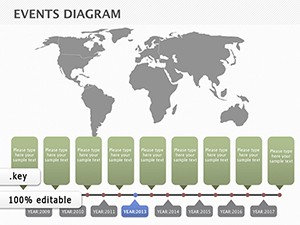
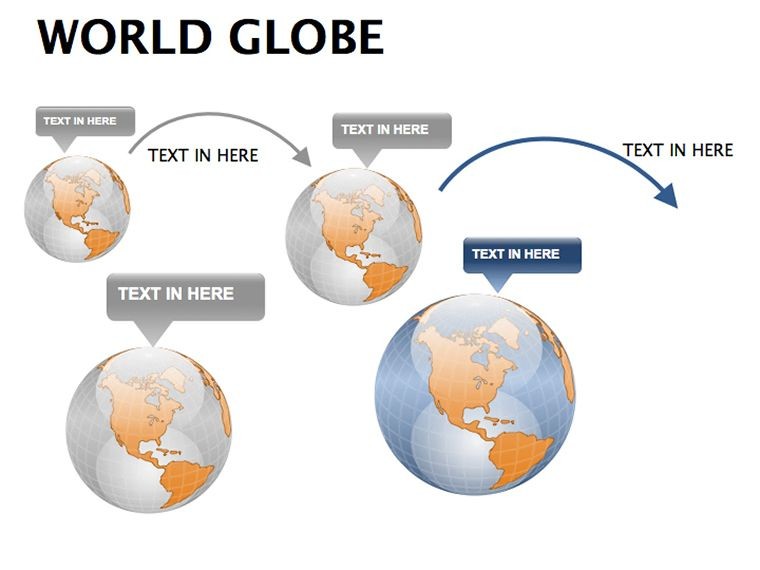
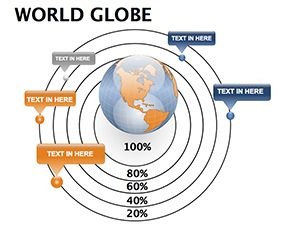
- Timeline Globes: Track changes over time.
These align with geographic information system (GIS) principles, ensuring accuracy and visual appeal as per Esri guidelines.
Slide-by-Slide Global Journey
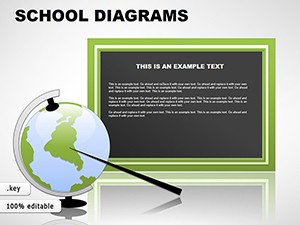
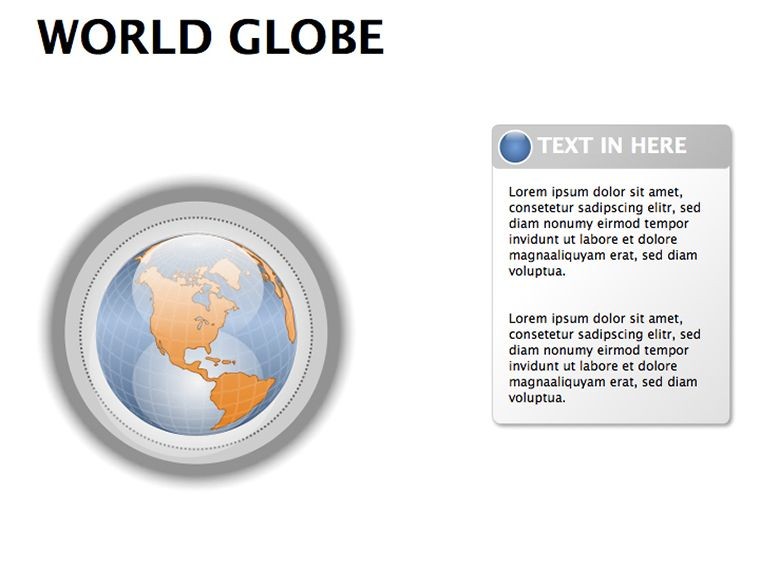
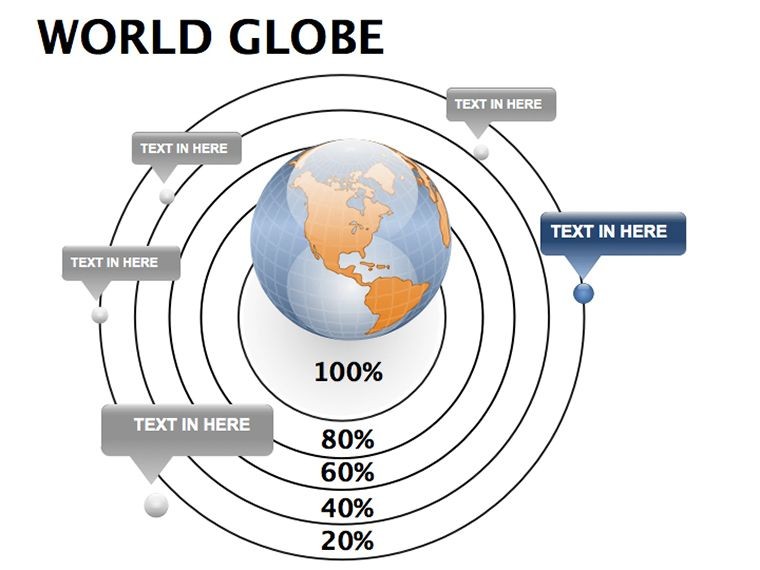
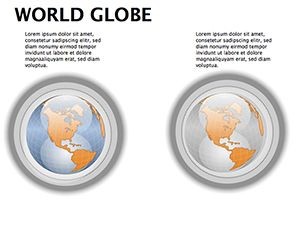
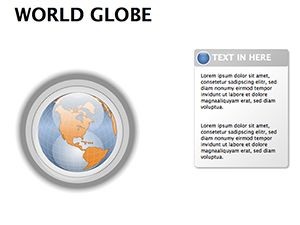
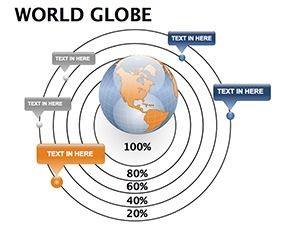
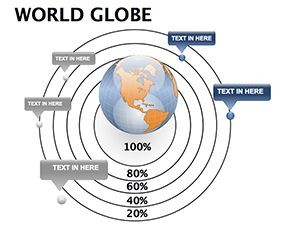
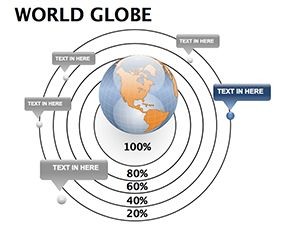
Slide 1 presents a full-world view for broad overviews, customizable with pins for hotspots like policy changes in the UN. Slides 2-4 zoom into regions: one for resource comparisons, another for expedition routes, referencing historical voyages like those of James Cook. Thematic slides (5-7) include environmental impacts, with editable layers for data like deforestation rates from WWF reports.
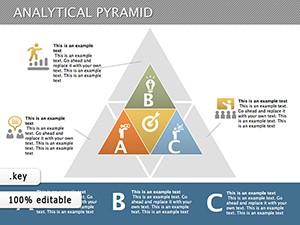
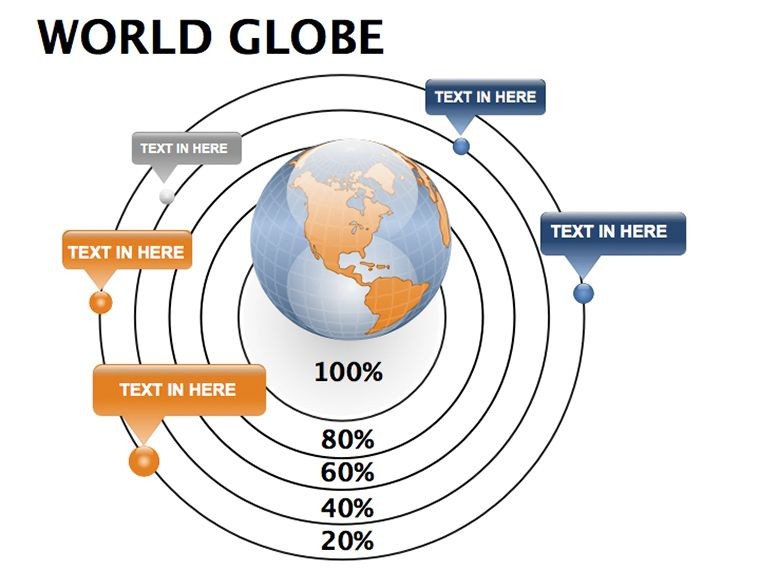
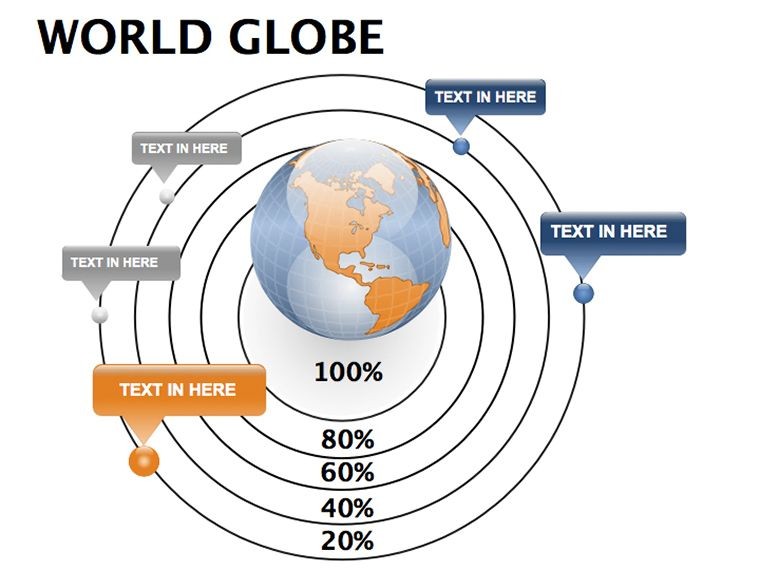
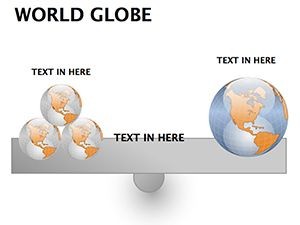
Slides 8-9 focus on comparisons, such as economic disparities via hemispheric splits. The finale (slide 10) synthesizes with an interactive summary globe, ideal for Q&A sessions. Built-in transitions mimic globe spins for immersive experiences.
Versatile Applications in Global Contexts
From scientific conferences to corporate strategy meetings, these diagrams shine. Use them to report on global supply chains or educate on world religions' evolutions.
- Policy Briefings: Illustrate international agreements visually.
- Resource Management: Map remaining assets and challenges.
- Expedition Planning: Plot routes and discoveries.
Example: An NGO used these to fundraise for conservation, boosting donations by visualizing impact areas. Start by importing GIS data, then adjust via Keynote's inspector tools.
Expert Strategies for Globe Mastery
Use projection techniques for accurate representations, avoiding distortions as cautioned by cartographers. Layer sparingly to maintain focus, per visualization best practices. For live demos, practice rotations in Keynote's presenter mode.
Link to related 3D templates internally for enhanced exploration. This template is your passport to compelling global storytelling.
Globalize Your Presentations Now
Our commitment to quality visuals ensures this template's reliability for professional use.
Embark on a visual voyage - download World Globe Keynote Diagrams today. Customize and connect the world in your next talk.
Frequently Asked Questions
- How 3D are these globes?
- Fully rotatable and layered for immersive 3D effects in Keynote.
- Can I edit the data layers?
- Yes, add or modify overlays with ease using Keynote tools.
- Compatible with iPad Keynote?
- Absolutely, optimized for all Apple devices.
- Are there export options?
- Export to PDF or video while preserving 3D elements.
- Suitable for non-global topics?
- Adaptable, but excels in worldwide themes.
- Any animation included?
- Yes, spin and zoom animations for dynamic presentations.