Tables for Analysis Keynote Diagrams: Unlock Deeper Insights


Type: Keynote Diagrams template
Category: Tables
Sources Available: .key
Product ID: KD00130
Template incl.: 18 editable slides
In the fast-paced world of business analysis, turning raw data into actionable insights can feel like navigating a maze. As a marketing analyst or project manager, you've likely wrestled with spreadsheets that fail to communicate effectively in meetings. Enter the Tables for Analysis Keynote diagrams template - a game-changer with 18 editable slides designed to simplify competitor evaluations and project optimizations. This tool draws from proven methodologies like SWOT analysis, often used by firms following Harvard Business Review guidelines, to help you spotlight strengths and weaknesses with precision.
Ideal for web developers, SEO specialists, or consultants, these diagrams transform complex comparisons into visual narratives. Imagine presenting website performance metrics side-by-side, highlighting user engagement gaps that could elevate your projects. Fully compatible with Apple Keynote, the template allows seamless edits - tweak column headers, insert charts, or color-code data for emphasis. Real-world benefits shine in scenarios like quarterly reviews, where such visuals have helped teams identify opportunities, per case studies from McKinsey & Company. This isn't mere decoration; it's a strategic asset that fosters informed decisions and drives growth.
Essential Features for Analytical Excellence
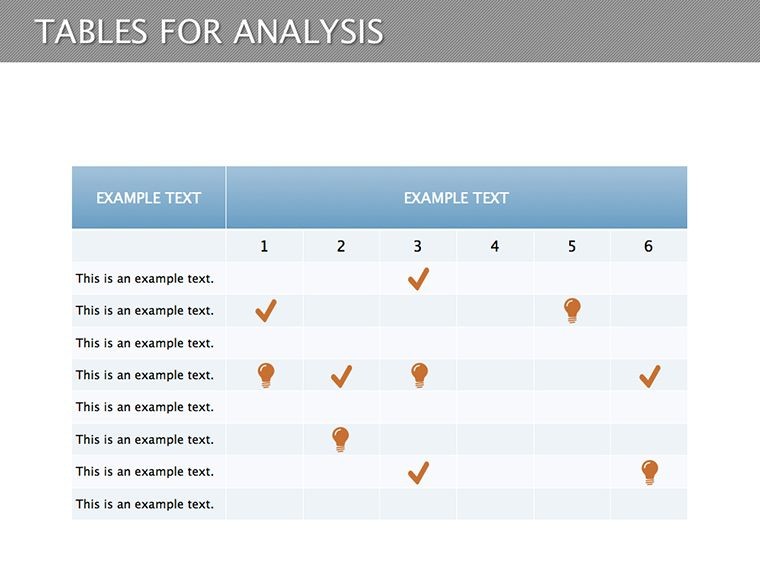
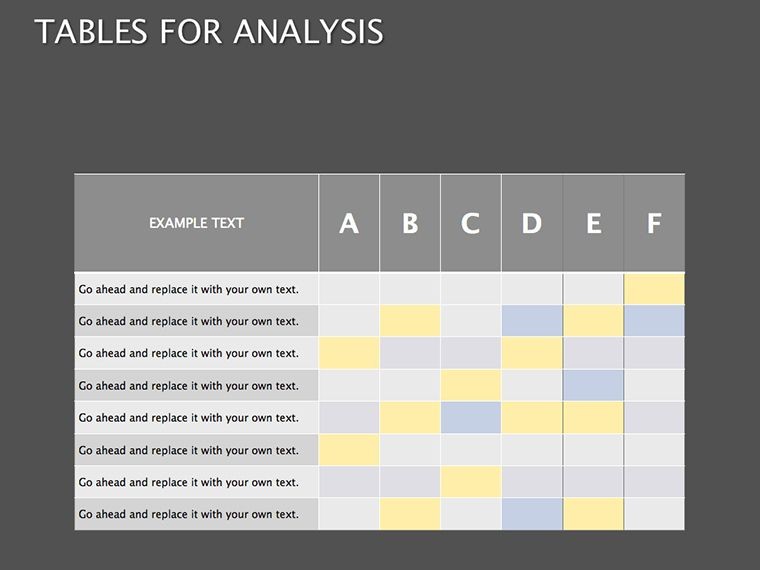
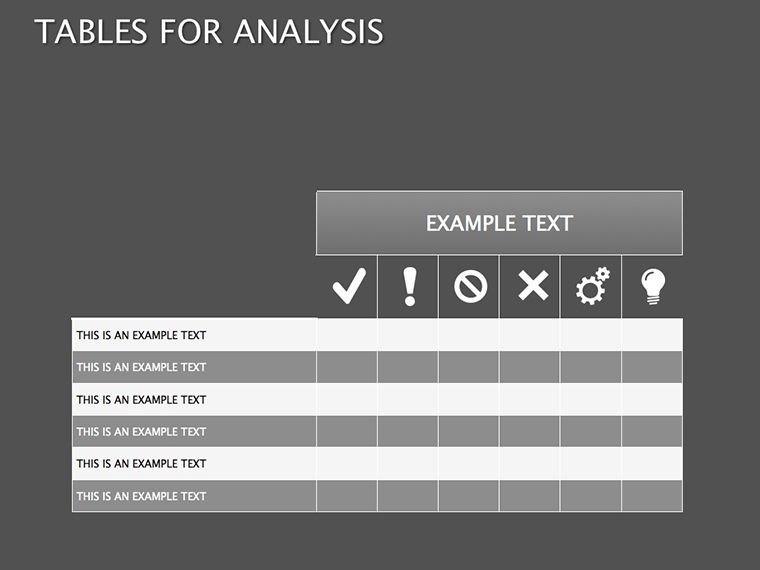
At its core, this template excels in functionality tailored for data-heavy presentations. The 18 slides feature versatile table designs, from multi-column comparisons to grid-based analytics, all in high-definition for crisp displays. Begin with foundational slides that outline key metrics, such as traffic sources or conversion rates, integrating LSI terms like "competitive benchmarking" organically.
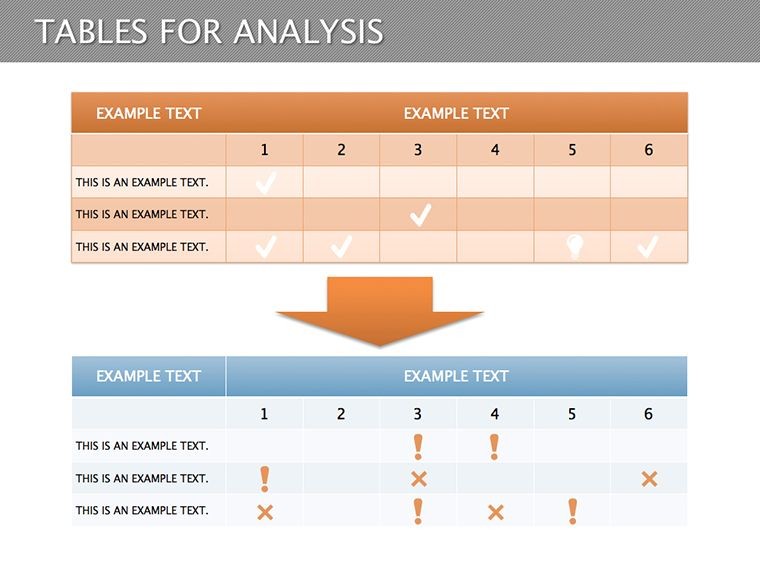
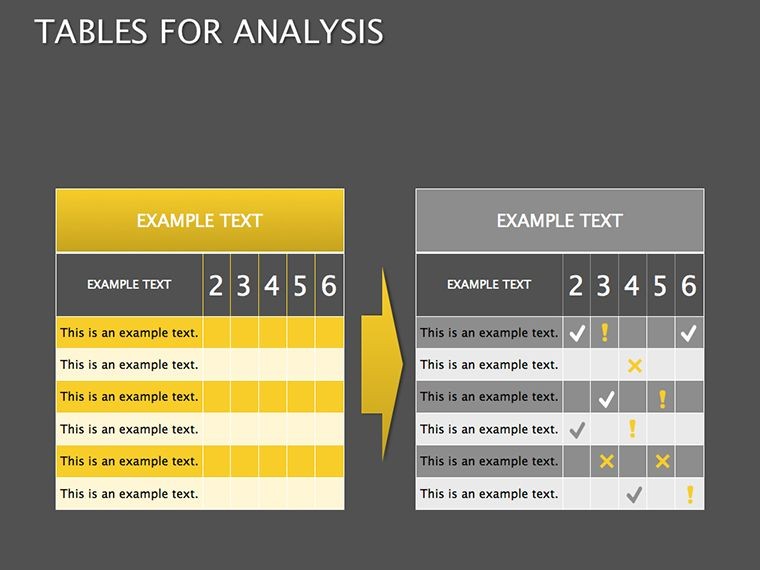
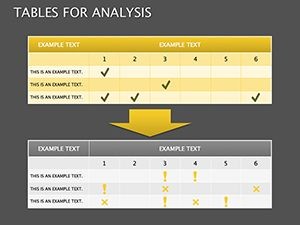
Customization stands out: Vector graphics ensure scalability, while drag-and-drop compatibility in Keynote speeds up modifications. Benefits include time savings - craft a full deck in under an hour - and enhanced clarity, reducing misinterpretations in team discussions. A notable feature is the inclusion of conditional formatting hints, allowing you to highlight outliers automatically. In practice, digital agencies have used similar templates to refine client strategies, boosting ROI by identifying underperforming elements swiftly.
In-Depth Slide Exploration
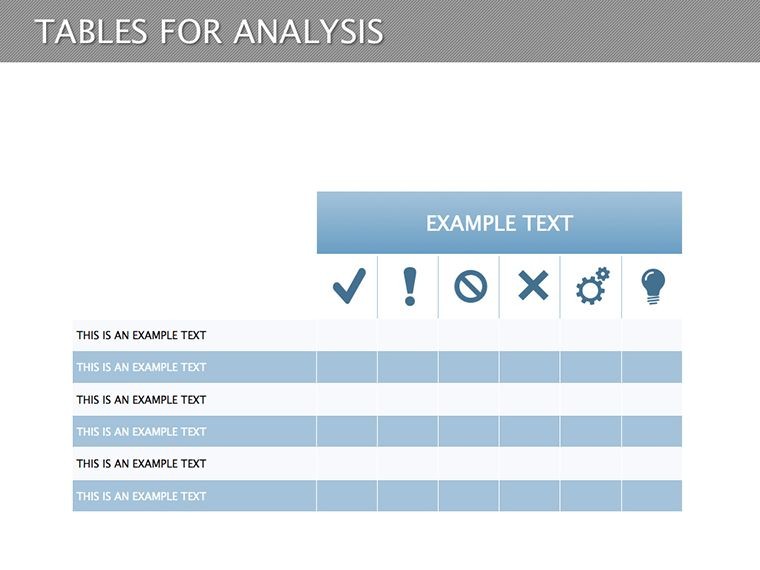
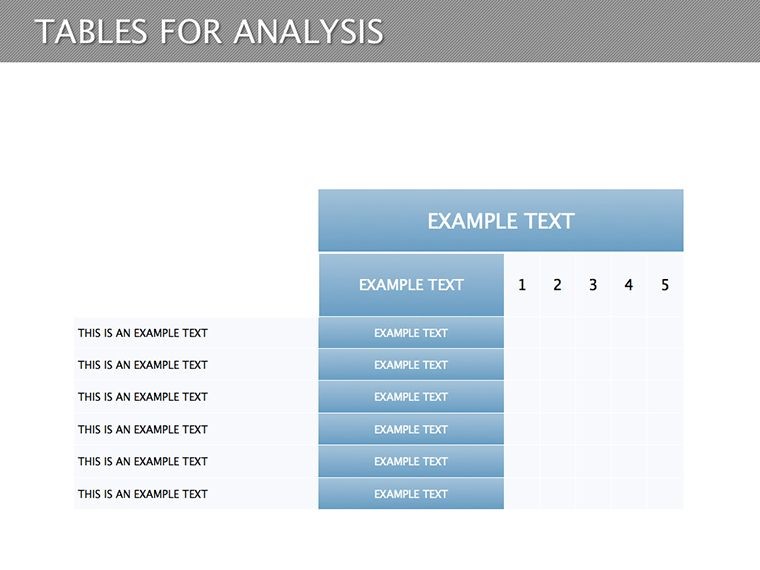
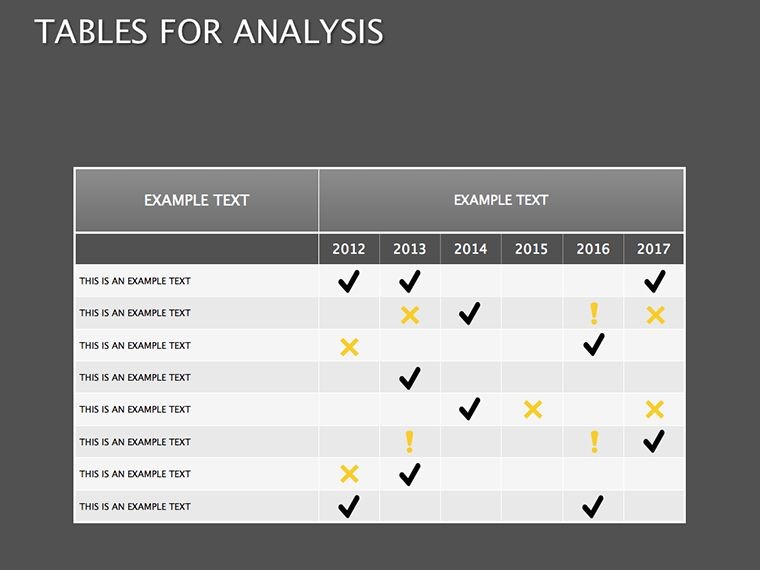
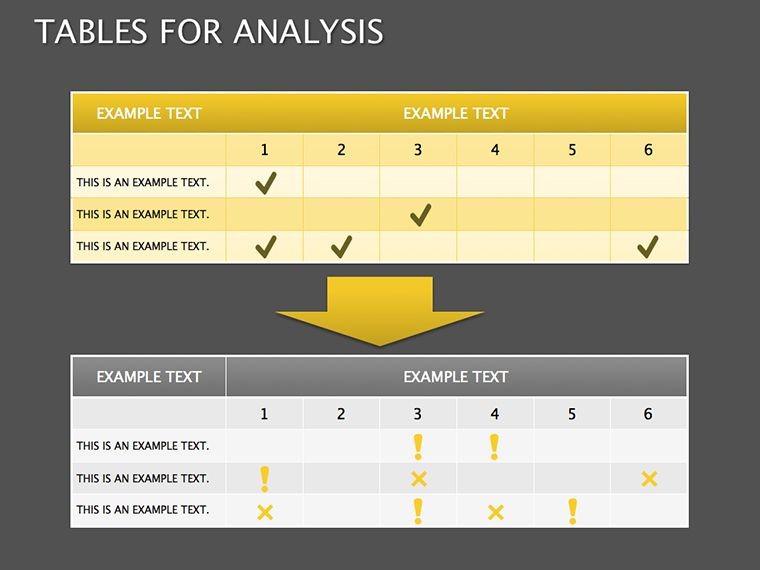
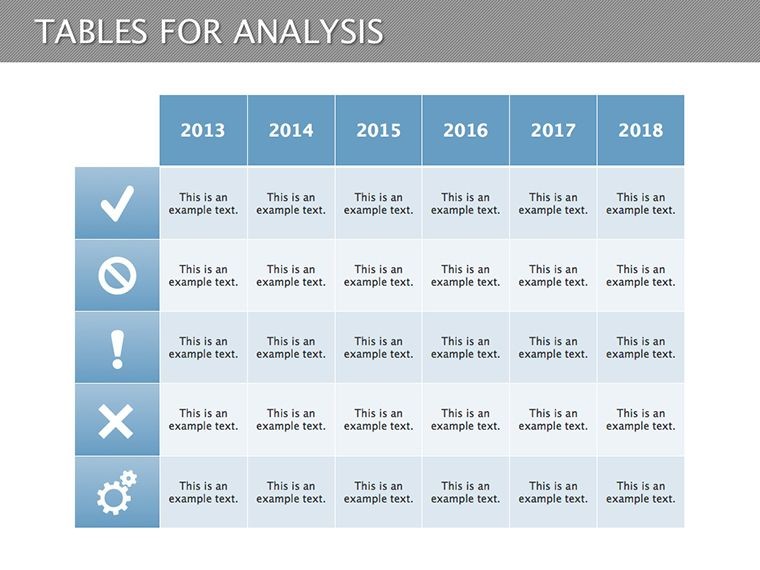
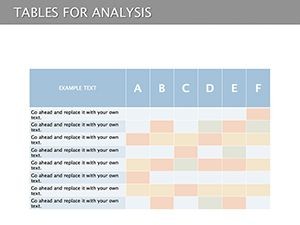
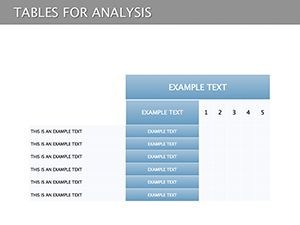
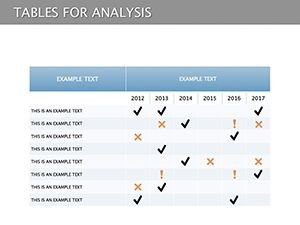
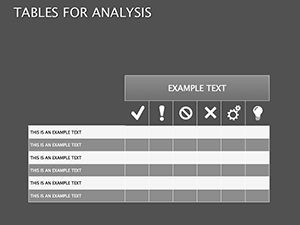
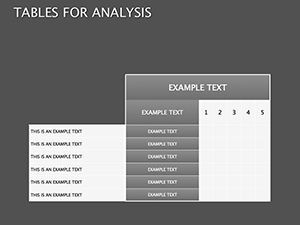
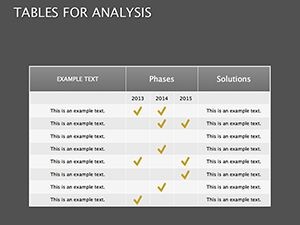
- Slides 1-4: Setup and Frameworks - Introduce analysis models with blank tables ready for SWOT or PESTLE inputs. Perfect for initial brainstorming sessions.
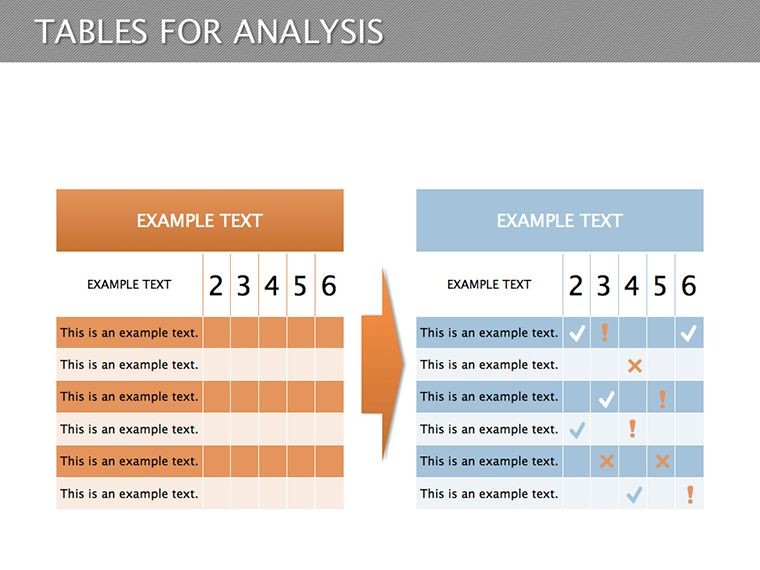
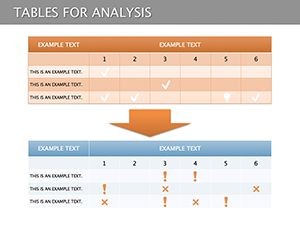
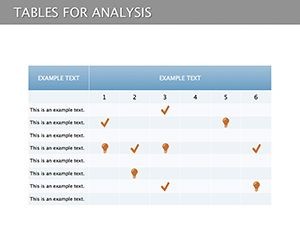
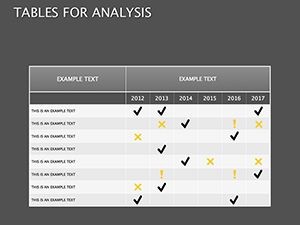
- Slides 5-9: Competitor Breakdowns - Side-by-side tables for feature comparisons, e.g., website speed vs. load times, aiding in gap analysis.
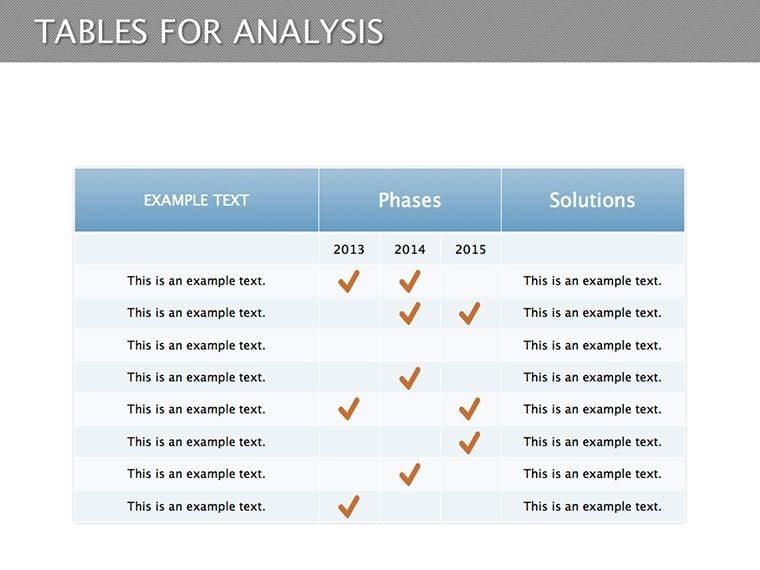
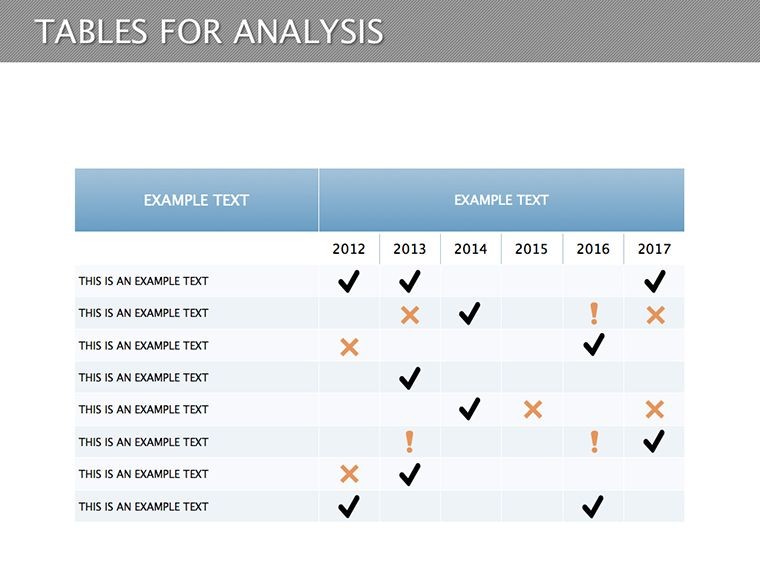
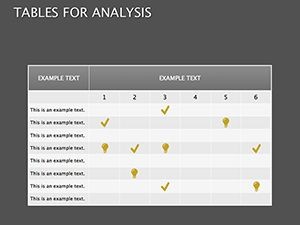
- Slides 10-13: Data Visualization - Incorporate bar graphs within tables for trends like monthly user growth, enhancing readability.
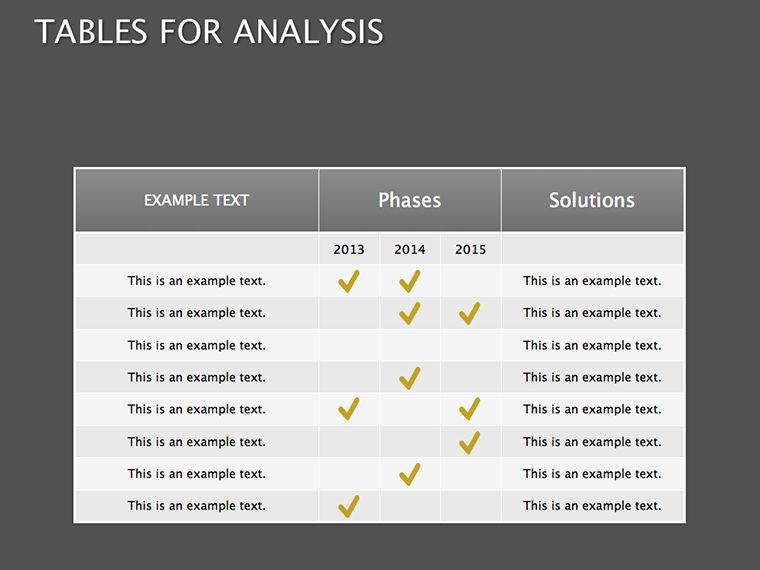
- Slides 14-16: Insights and Recommendations - Summarize findings with prioritized action items, using bullet-integrated rows.
- Slides 17-18: Executive Summaries - Condense key takeaways with overview tables, ideal for C-suite pitches.
Adapt these for virtual collaborations, exporting to shared Keynote files for real-time edits.
Practical Use Cases in Professional Settings
Apply this template across diverse scenarios to maximize its value. For a web project manager, use it to dissect competitor sites during redesign phases - populate tables with metrics from tools like SEMrush, revealing SEO weaknesses. This approach, endorsed by experts at Moz, helps prioritize updates that improve rankings.
In marketing strategy sessions, analysts can compare campaign performances, charting ROI against benchmarks. Educators in business courses might employ it for student projects, simulating real analyses of companies like Amazon vs. eBay. Step-by-step: Open in Keynote, input data via copy-paste from Excel, then animate rows for emphasis during delivery. Tips include using neutral colors for objectivity and adding footnotes for data sources, building trustworthiness.
For startups, visualize funding pitches by analyzing market landscapes - tables showing competitor funding rounds versus your projections. This narrative style engages investors, as seen in successful pitches on Shark Tank. Workflow integration is seamless; link to Google Sheets for live data pulls, ensuring up-to-date presentations.
Why This Outperforms Standard Tools
Unlike generic Keynote tables, these are pre-optimized for analysis, with built-in alignment and styling that save design effort. At $20, it's a steal compared to custom design services, offering immediate value through reusable elements. Propositions center on empowerment: Turn data overload into strategic wins, fostering a culture of evidence-based decisions.
Enhance UX with internal links to category pages on ImagineLayout for more templates. Suggest thumbnail previews to build anticipation before purchase.
Expert Tips for Mastering Analysis Presentations
To truly leverage this, focus on storytelling - pair tables with narratives explaining 'why' behind numbers. Validate data with sources like Statista for credibility. Vary slide pacing; use animations sparingly to avoid distraction. Post-presentation, analyze feedback to iterate designs. These insights, from seasoned analysts, ensure your work stands out.
Don't let data drown your message - grab the Tables for Analysis Keynote diagrams now and sharpen your edge.
Frequently Asked Questions
What makes these tables ideal for competitor analysis?
They feature pre-structured columns for side-by-side comparisons, making it easy to highlight strengths and weaknesses visually.
Is the template compatible with older Keynote versions?
Yes, it works with Keynote '09 and later, ensuring broad accessibility for users.
Can I add charts or graphs to the tables?
Certainly - Keynote's tools allow embedding visuals directly, enhancing data representation.
Are the slides print-friendly?
Absolutely; export to PDF for high-quality handouts or reports.
How do I handle large datasets in these tables?
Use scrolling features or break into multiple slides; Keynote supports dynamic content without clutter.
Does it include sample data?
Yes, placeholders with examples guide you, but they're fully replaceable.