Volatility & Pyramid Keynote Diagrams: Strategize with Clarity


Type: Keynote Diagrams template
Category: Pyramids
Sources Available: .key
Product ID: KD00114
Template incl.: 20 editable slides
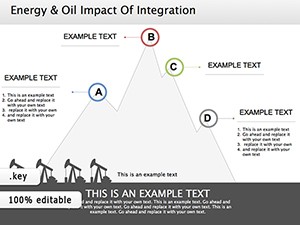
Navigate the turbulent waters of business with visuals that cut through complexity. Our Volatility & Pyramid Keynote Diagrams template provides 20 editable slides for professionals tackling risk, finance, or hierarchies. From pyramid charts depicting organizational structures to cycle diagrams showing market fluctuations, this tool empowers clear communication. Ideal for analysts forecasting volatilities or managers outlining sustainability frameworks, it combines modern design with functionality. Customize to your brand, integrate data seamlessly, and present with confidence on Mac or iOS. Backed by expert design principles, it enhances , making your insights credible and compelling. Whether in consulting or education, transform abstract ideas into structured visuals that drive understanding and action.
Mastering Volatility Through Structured Visuals
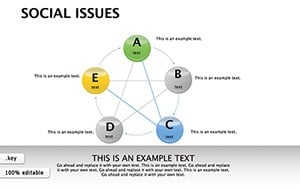
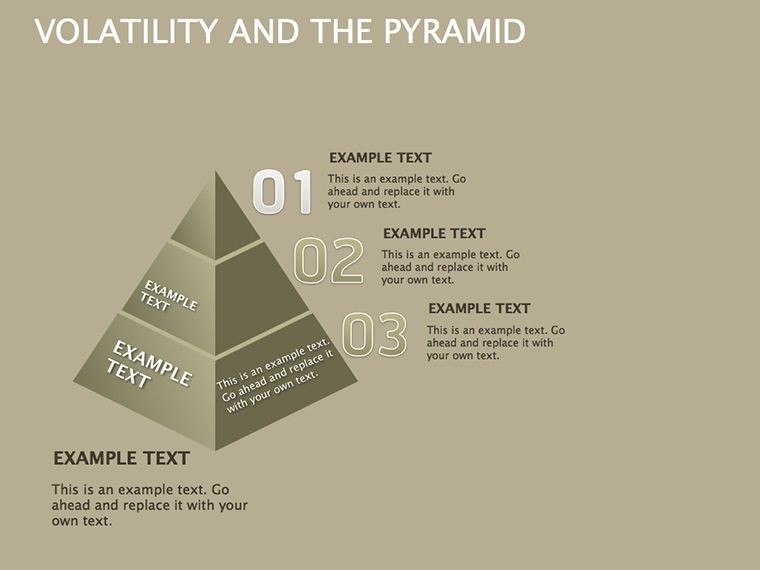
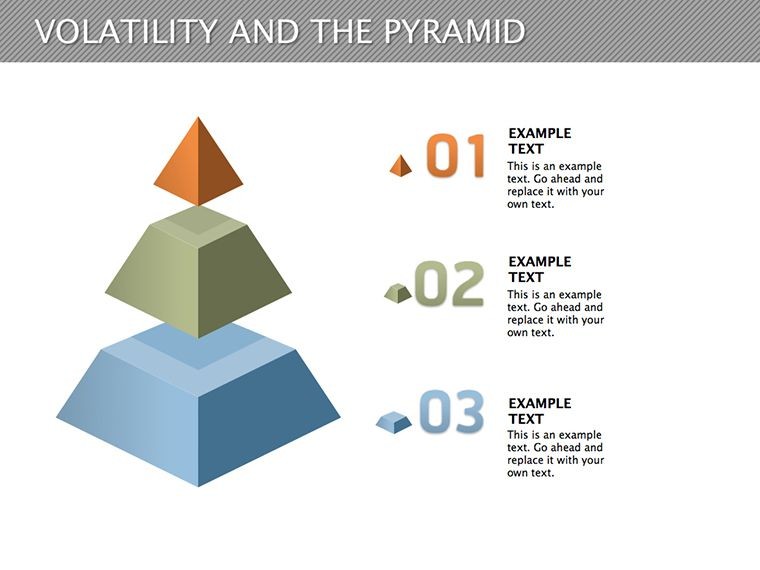
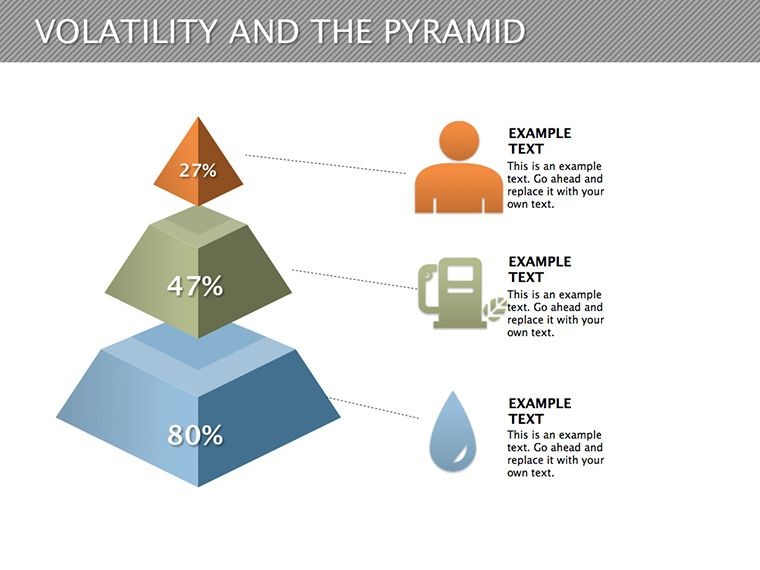
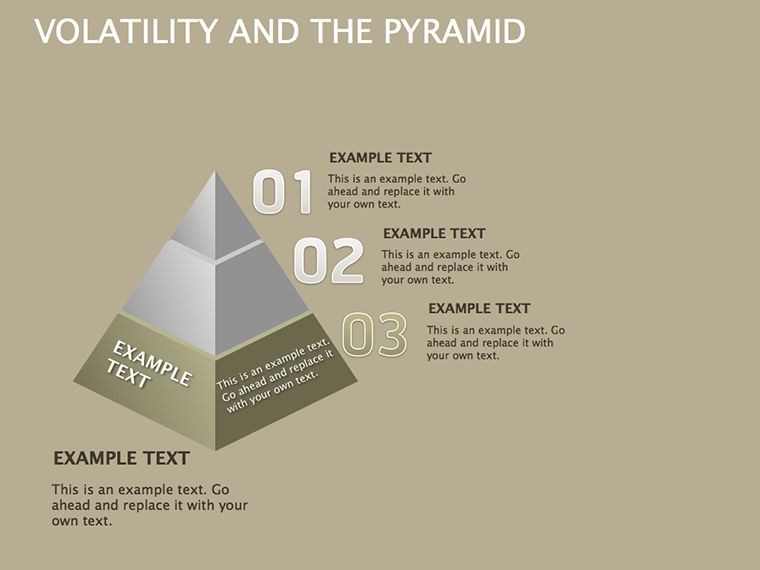
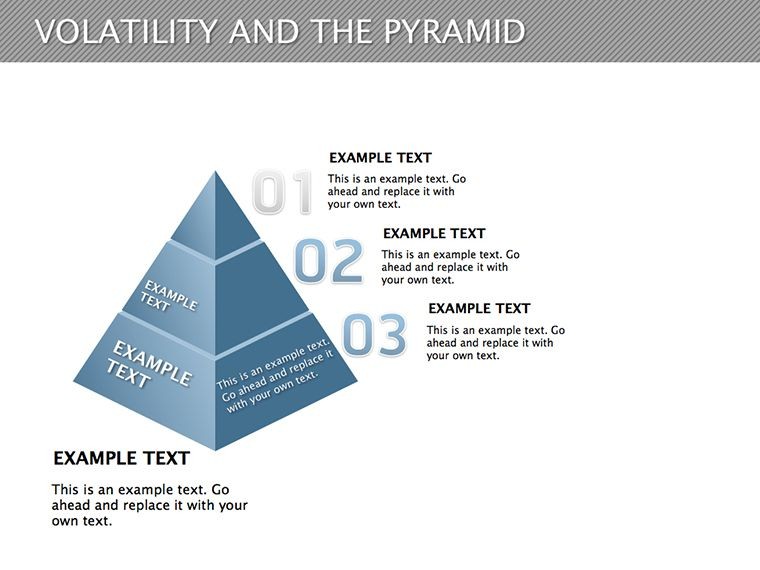
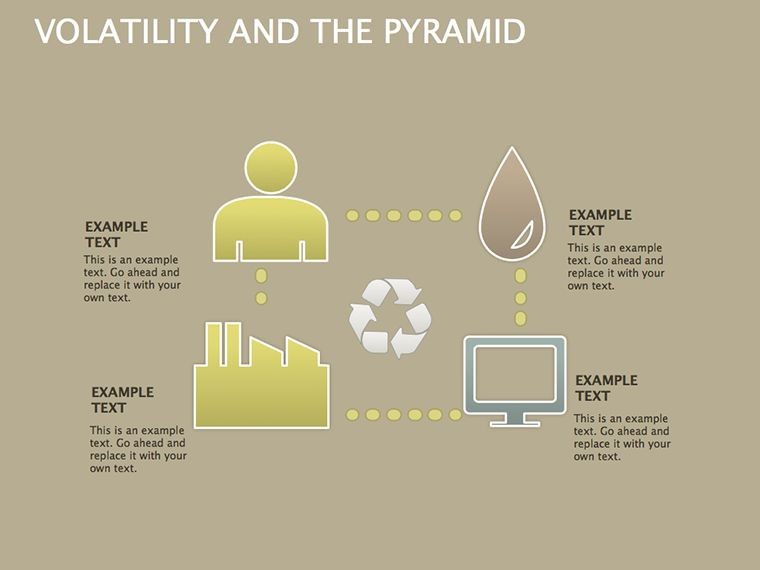
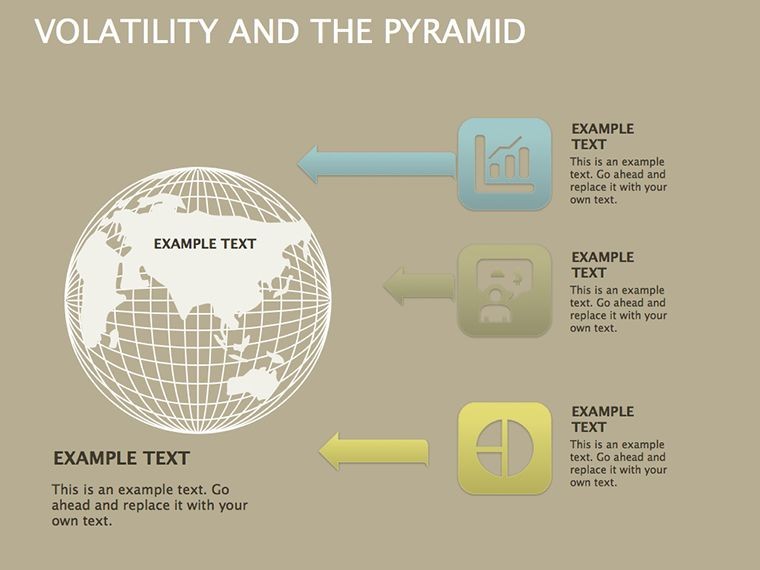
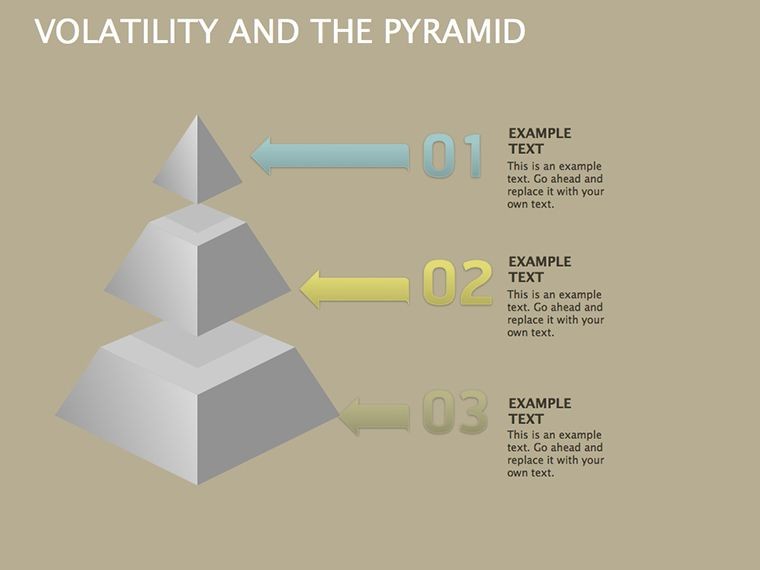
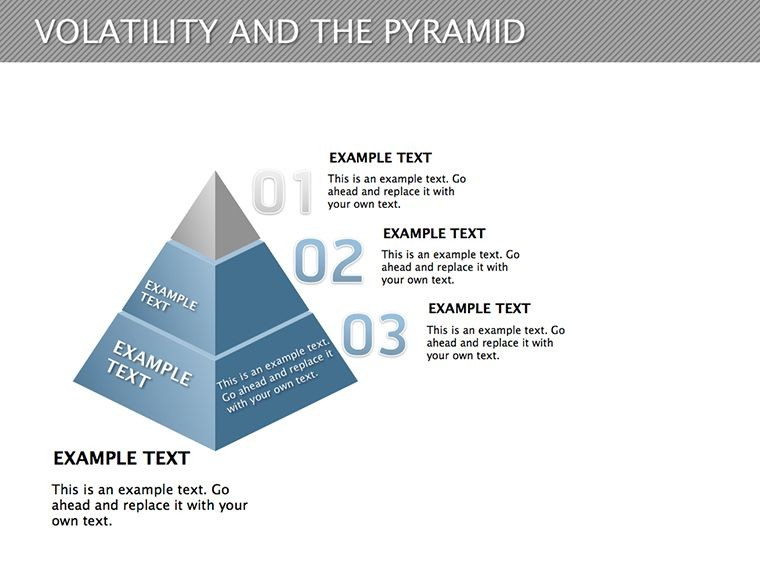
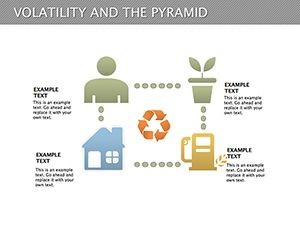
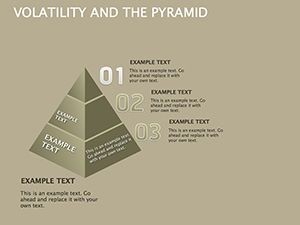
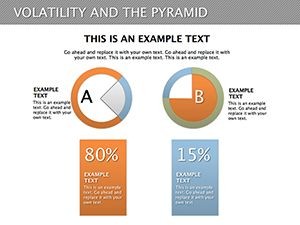
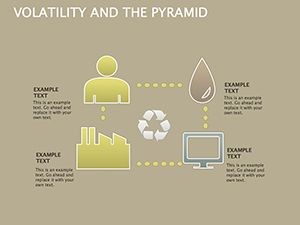
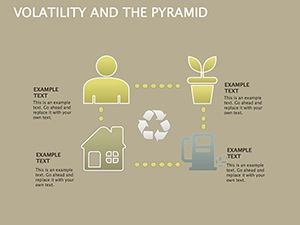
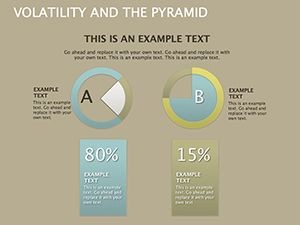
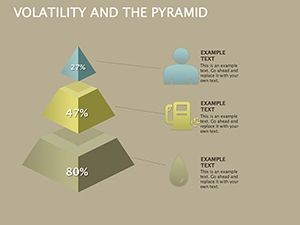
Volatility demands agile responses; our pyramids and cycles provide the framework. Use percentage pyramids for risk breakdowns, color-gradated to highlight severity. In finance, model investment volatilities with interconnected cycles, revealing patterns.
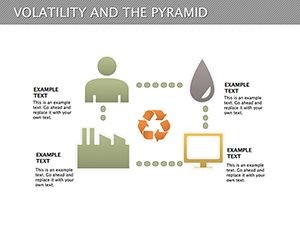
For sustainability experts, map global impacts in layered pyramids. A project manager shared how these diagrams clarified team hierarchies, boosting efficiency. This adaptability solves presentation pains, fostering engagement.
Core Features for Business Pros
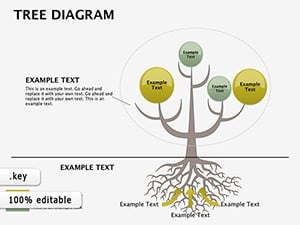
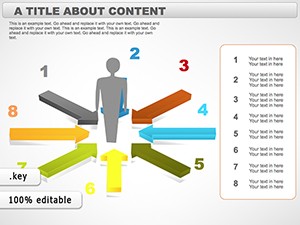
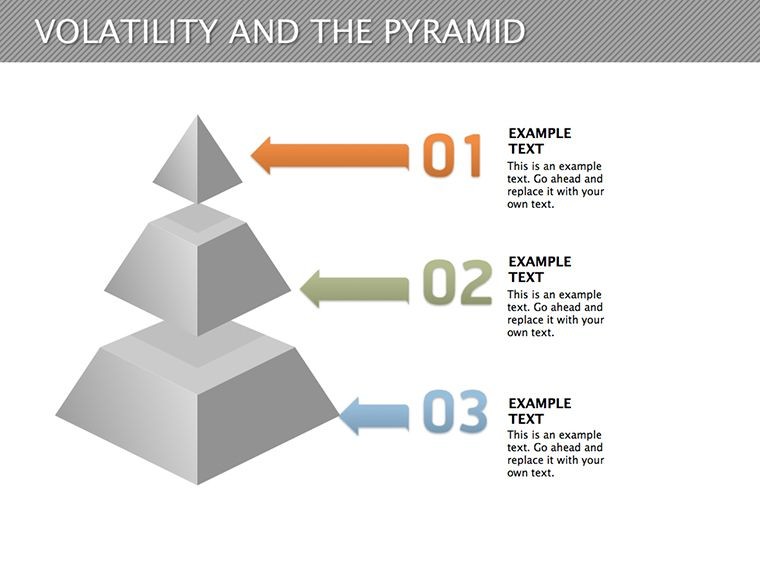
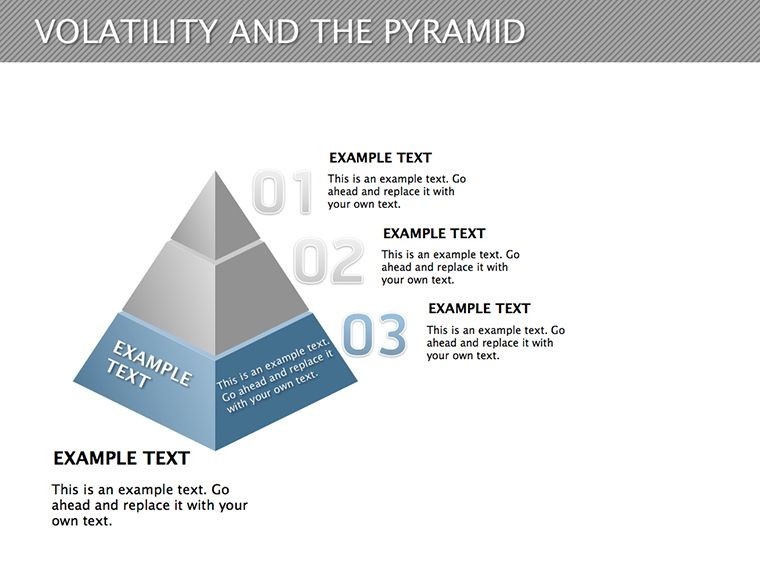
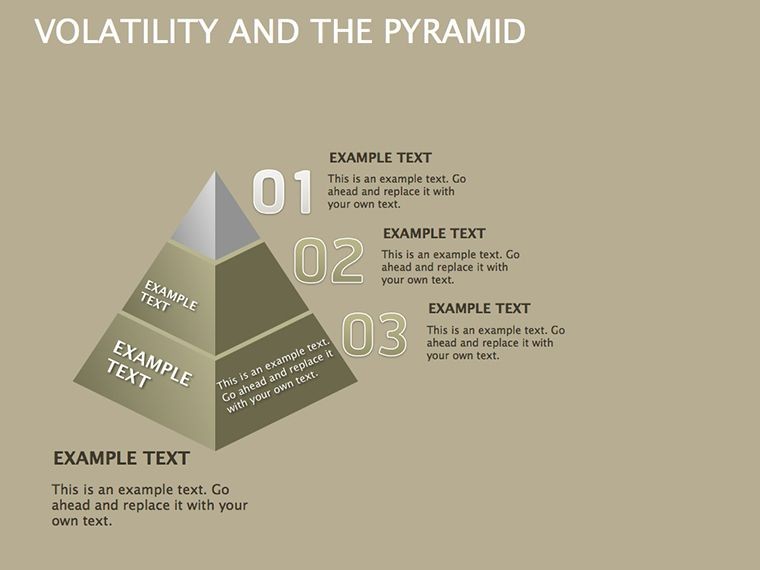
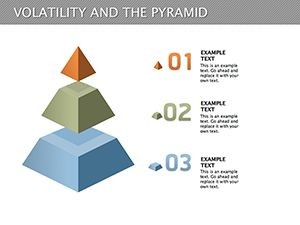
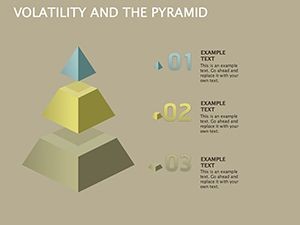
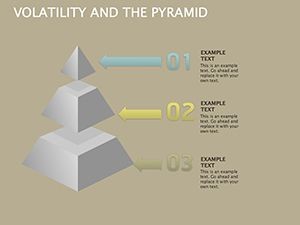
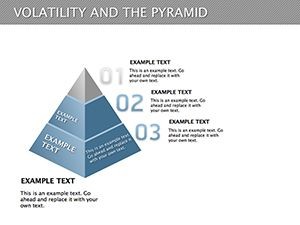
- Editable Pyramids: Adjust levels for custom hierarchies.
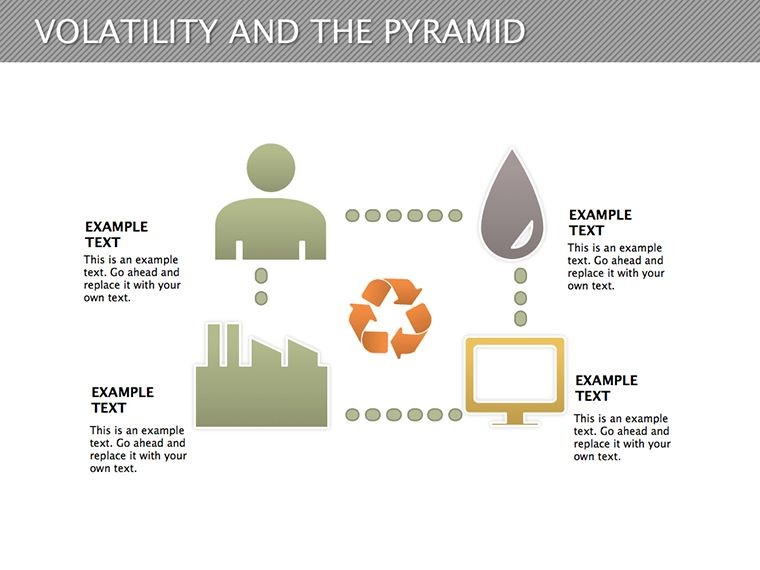
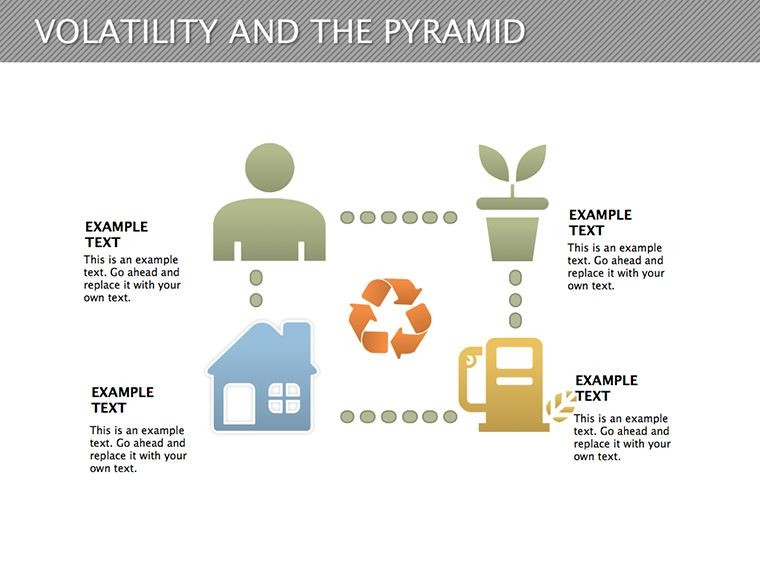
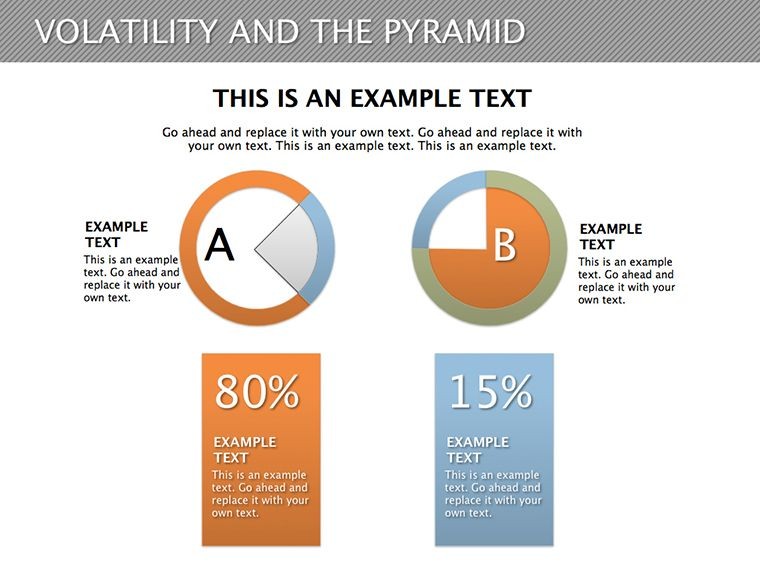
- Cycle Diagrams: Illustrate ongoing processes like market cycles.
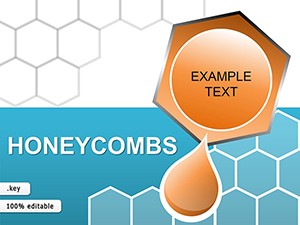
- High-Quality Aesthetics: Clean, engaging designs.
- Brand Alignment: Easy color and font tweaks.
With free updates, stay current with Keynote evolutions.
Use Cases That Drive Results
In financial reports, visualize volatility trends; in consulting, outline strategies. Educators teach economic cycles effectively. Tip: Start with data, build pyramids bottom-up for logical flow.
A sustainability report using these gained stakeholder praise for clarity. Integrate with Keynote guides for smooth workflows.
Detailed Slide Breakdown
- Pyramid Basics: Simple hierarchies.
- Volatility Cycles: Data-driven loops.
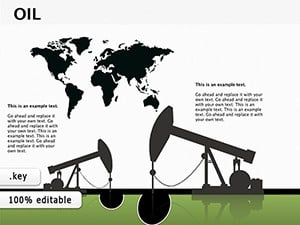
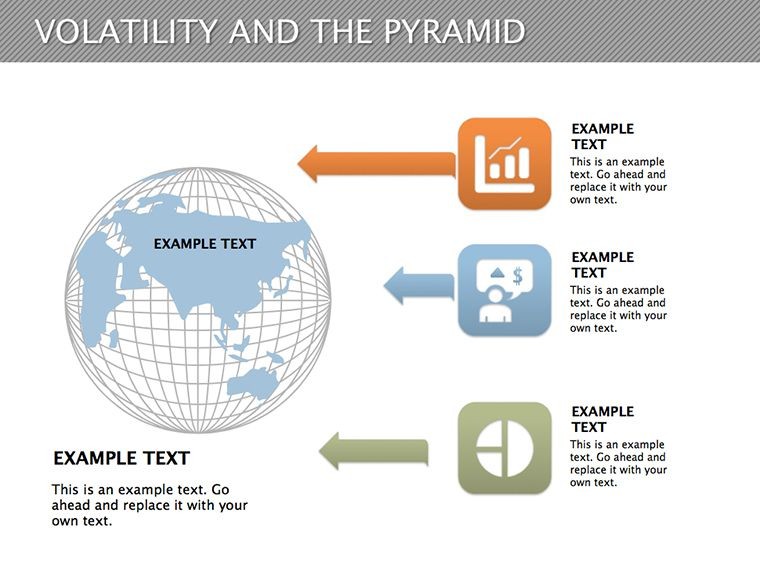
- Integrated Maps: Global strategy visuals.
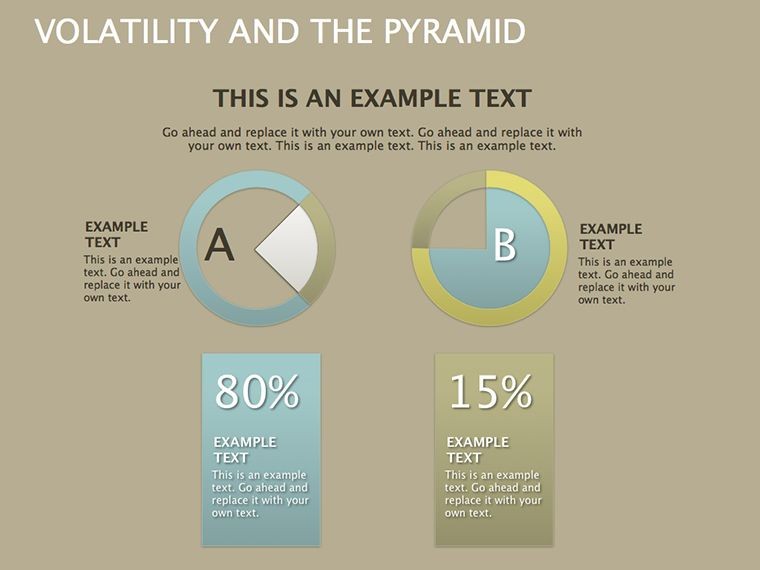
- Advanced Infographics: Multi-faceted insights.
20 slides offer versatility for diverse needs.
Pro Tips for Impactful Delivery
Customize ease, present confidently. Overcome blandness with animations; align with objectives for resonance.
Propel your strategies - acquire this template and pyramid your success.
Frequently Asked Questions
- Compatible with Windows?
- No, Mac/iOS optimized; iCloud for Windows access.
- What formats included?
- .key with PNGs.
- Commercial use allowed?
- Yes, personal and commercial.
- How editable?
- Fully, for custom fits.
- Slide count?
- 20 versatile slides.