Financial Swing Keynote Diagrams: Swing into Strategic Clarity


Type: Keynote Diagrams template
Category: Business Models, 3D, Silhouettes & People
Sources Available: .key
Product ID: KD00020
Template incl.: 12 editable slides
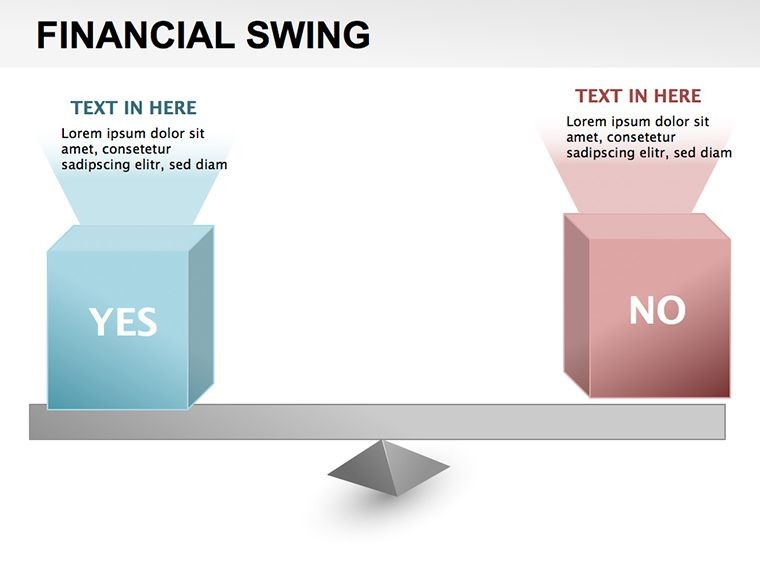
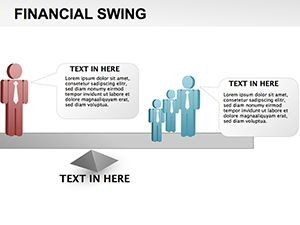
In the rhythm of markets and missions, clarity swings the balance toward success. The Financial Swing Keynote Diagrams template captures this with 12 editable slides that map logical data ties, from swing trading patterns to career trajectories. Aimed at analysts, planners, and leaders who juggle variables, it transforms tangled info into swinging pendulums of insight, making your Keynote presentations a beacon for informed decisions.
This tool demystifies relationships - think costs versus outcomes or development milestones - without the slog of redrawing connections. Versatile for trading sessions or strategy huddles, it equips you to demonstrate goals with poise, turning "what ifs" into "here's how."
Decoding Data Swings with Elegant Diagrams
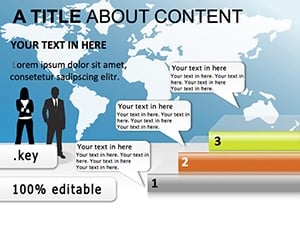
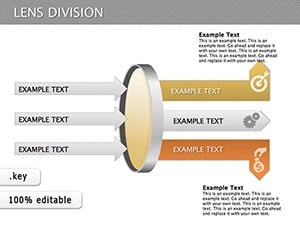
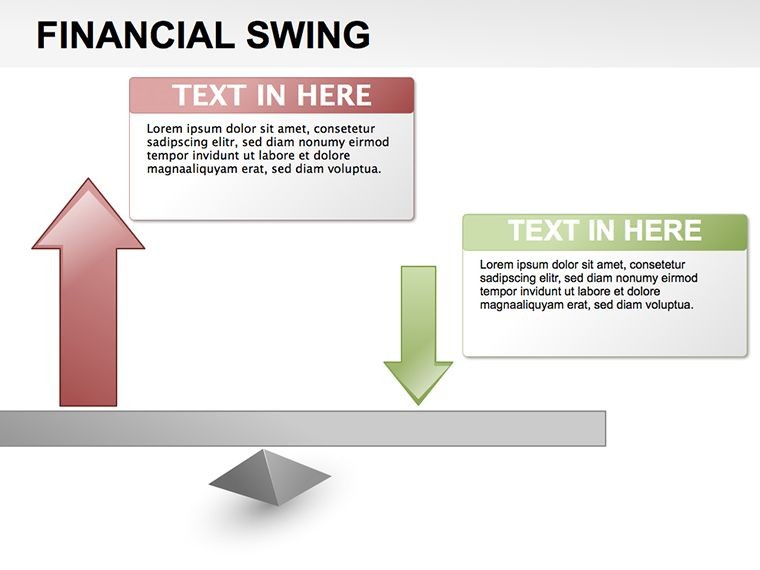
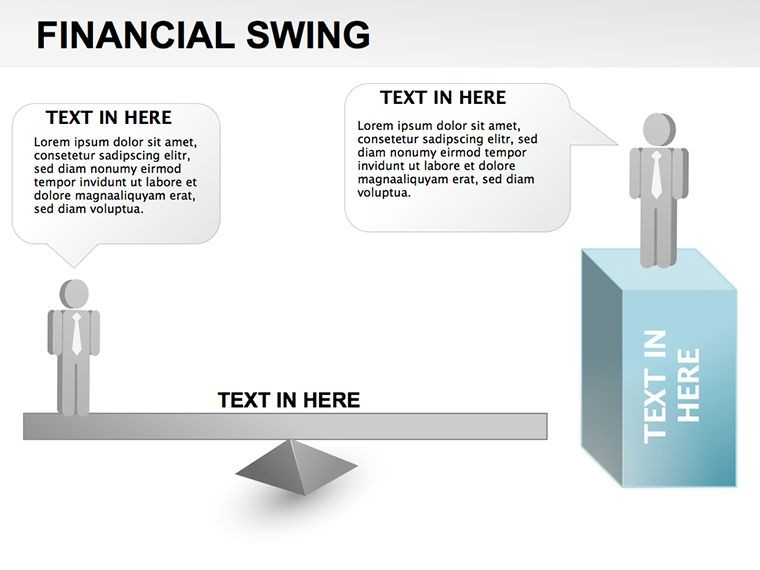
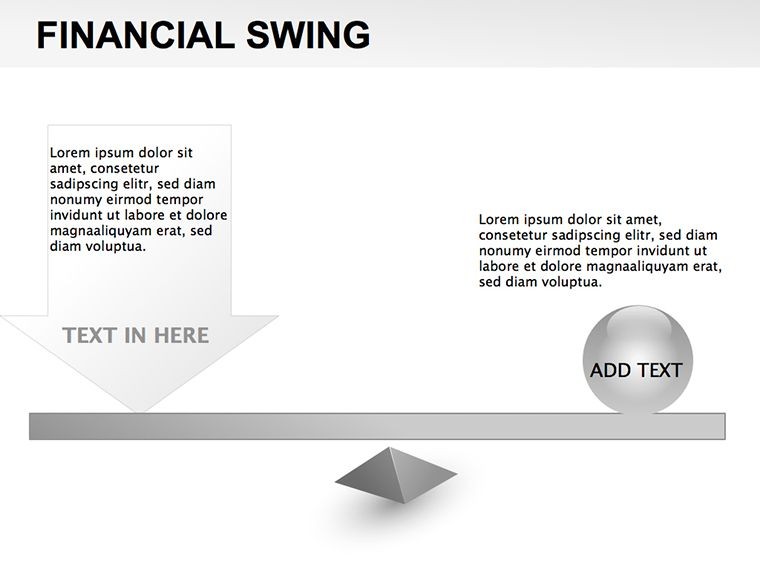
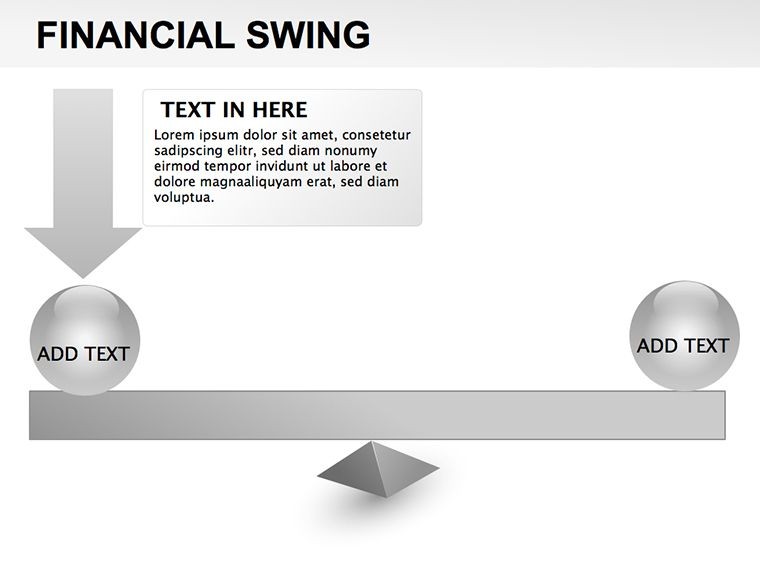
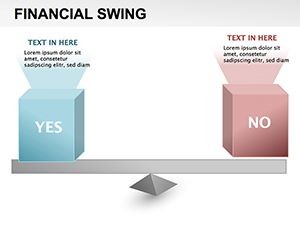
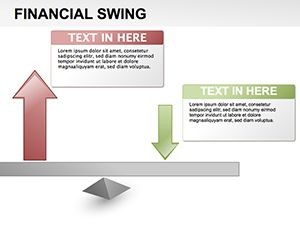
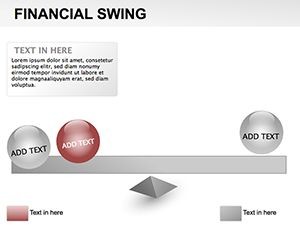
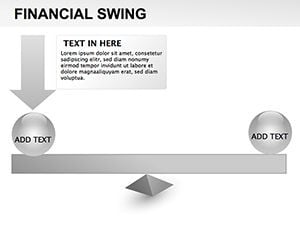
Lead with slide 1's pendulum diagram, swinging between data points to illustrate volatility in swing trades. Animate the arc to show entry-exit timing, a visual shorthand for non-traders grasping your logic.
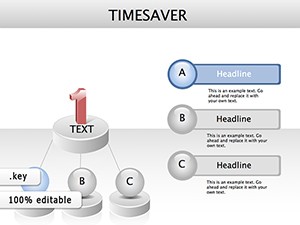
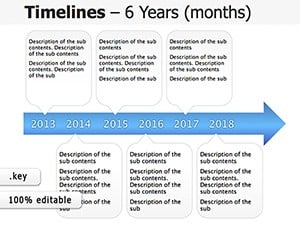
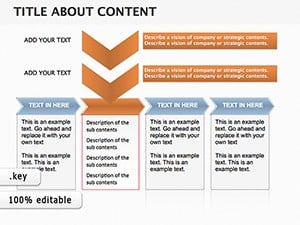
Slides 3-6 delve into goal webs, where nodes link career advances to organizational missions, with adjustable tensions mimicking real dependencies. These aren't stiff; flexible lines bend to your narrative's pull.
Customization Roadmap for Swing Mastery
- Pinpoint Pivots: Select swing points on the master diagram and label with custom metrics.
- Balance Elements: Adjust line weights in Keynote's stroke panel to emphasize key relationships.
- Infuse Dynamics: Apply "swing" paths for animations, syncing with voiceover for rhythmic reveals.
Such precision echoes trading floor tactics, where every link forecasts the next move.
Applications Across Finance and Beyond
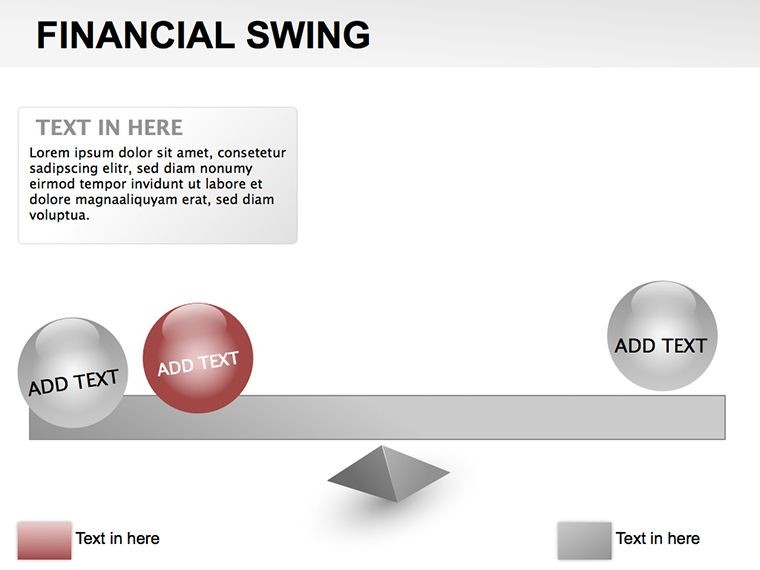
Traders harness slide 8's relationship matrix for pattern analysis, plotting assets in swinging clusters to forecast holds. Present to teams, animating shifts to debate holds versus flips.
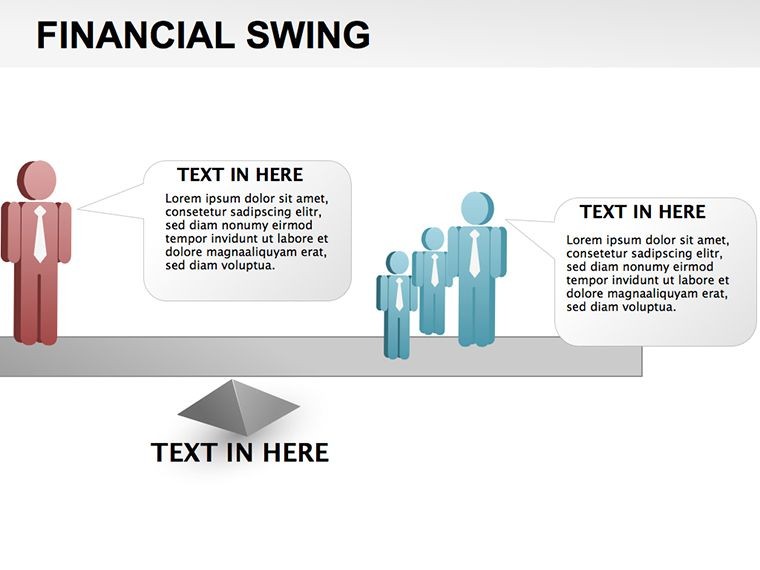
For career coaches, slides 9-11 map development swings, balancing skills against opportunities with silhouette integrations for human touch. This fosters motivational talks, visualizing progress arcs.
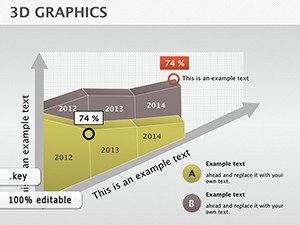
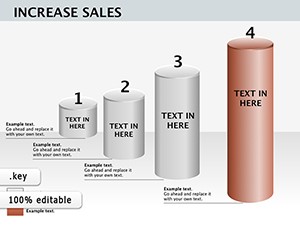
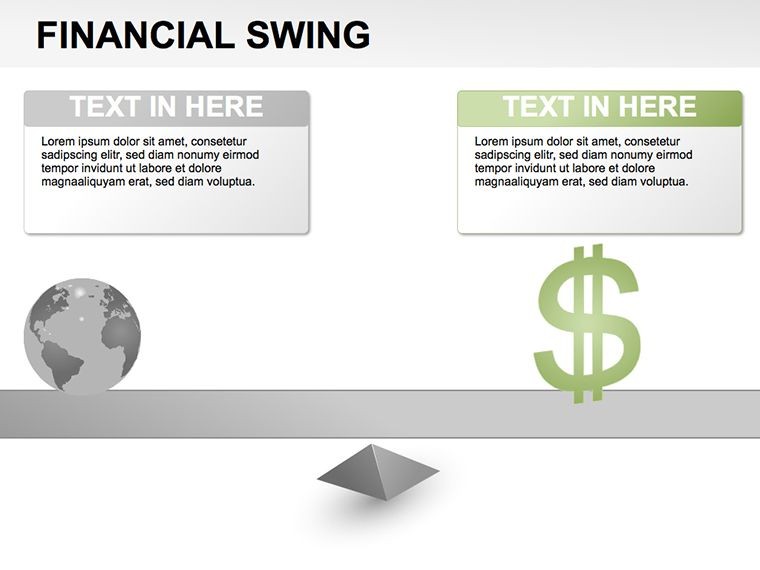
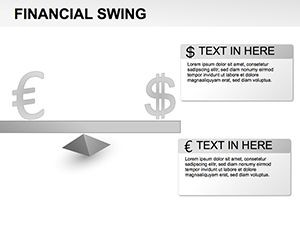
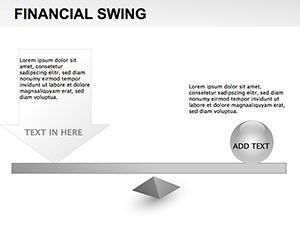
Outshining plain diagrams, this template's 3D tilts add spatial depth, preventing flatness in multi-variable views. A project lead might swing costs against timelines on slide 4, clarifying budget trade-offs instantly.
Swing Diagrams Over Conventional Charts
- Relational Depth: Curved links reveal interactions basics miss, like cost-mission feedbacks.
- Adaptive Versatility: Reshape swings for trading or planning without starting over.
- Visual Rhythm: Inherent motion cues engagement, unlike static grids.
In board strategy sessions, these pendulums model scenarios, swinging stakeholders from doubt to alignment.
Blending Silhouettes and 3D for Relatable Insights
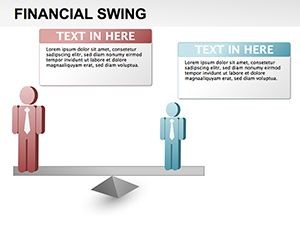
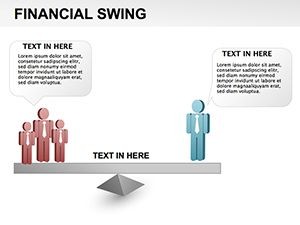
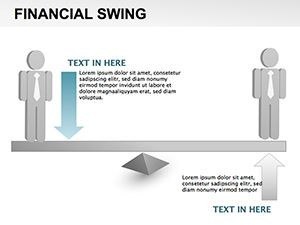
Infuse humanity with slide 7's silhouette swings, where figures balance data orbs - perfect for mission decks showing team roles in flux. Customize poses to fit contexts, from executive overviews to workshop icebreakers.
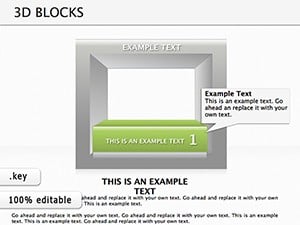
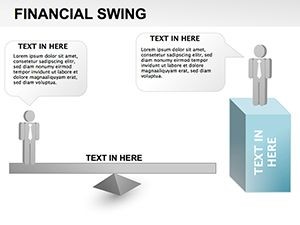
Layer 3D elements on slide 12 for volumetric goals, rotating views to explore facets. This adds immersion, like virtual models in planning software.
Pro move: Hyperlink swing ends to appendices, letting audiences drill down interactively during reviews.
Workflow for Swinging into Action
Start with core swings: Identify variables, then template-map. For hour-long analyses, limit to four diagrams, spacing for digestion. Share via Keynote Live for remote swings.
Works with Keynote 2016+, exporting to QuickTime for annotated videos.
Swing your presentations to new heights - secure the Financial Swing Keynote Diagrams template and harness the momentum.
Frequently Asked Questions
What is a financial swing diagram used for?
It's a tool for spotting data relationships in trading, goals, or planning, highlighting logical ties visually.
Are the slides focused on trading only?
No, versatile for career, development, and organizational contexts beyond finance.
Can I animate the swing motions?
Yes, Keynote's path tools let you create custom swings with ease.
Does it include 3D elements?
Several slides feature 3D-compatible designs for added depth.
How editable are the relationships?
Fully - drag lines and nodes to reconfigure links on the fly.
Compatible with Windows?
Via Keynote web or export, though optimized for Mac/iOS.