Great Value Keynote Charts Template: Mastering Relationship Visuals


Type: Keynote Charts template
Category: Relationship
Sources Available: .key
Product ID: KC00601
Template incl.: 20 editable slides
When it comes to illustrating connections and dependencies in your presentations, nothing beats a well-crafted set of relationship diagrams. The Great Value Keynote Charts template delivers exactly that, with 20 meticulously designed editable slides tailored for Keynote on Mac, iPad, and iPhone. This template shines in the 'Relationship' category, helping you map out networks, hierarchies, and interactions with ease. Whether you're a business analyst charting organizational structures, an educator explaining ecosystem dynamics, or a marketer depicting customer journeys, this tool turns complex data into compelling stories.
Picture this: You're in a strategy session, and instead of dense text, your slides reveal animated networks that build layer by layer, highlighting key relationships. That's the edge this template provides - vibrant visuals that captivate without overwhelming. Fully compatible with iWork Keynote 7.0+, it includes export options to PPT for cross-platform sharing, ensuring your message reaches everyone. The drag-and-drop editing makes customization a breeze, saving you precious time while amplifying impact.
Essential Features for Dynamic Relationship Mapping
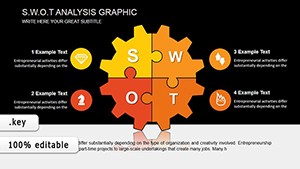
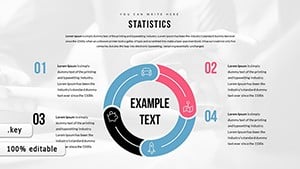
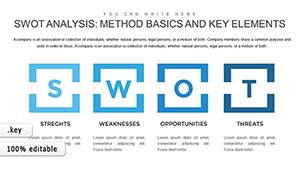
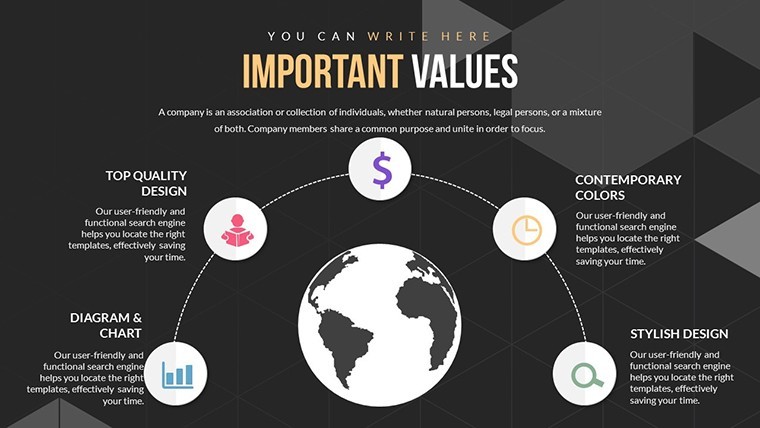
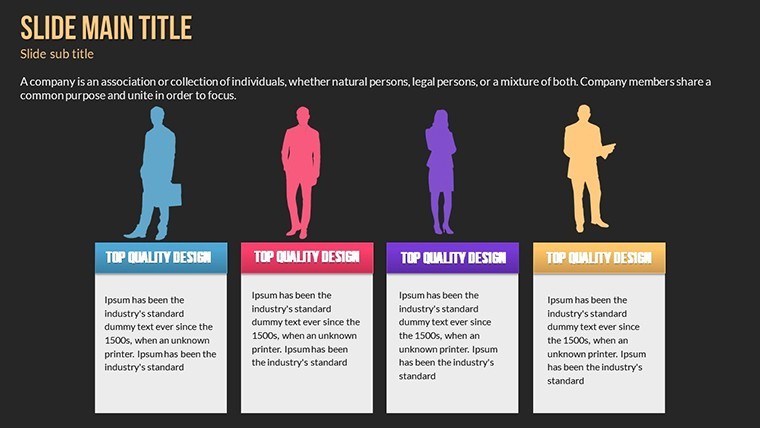
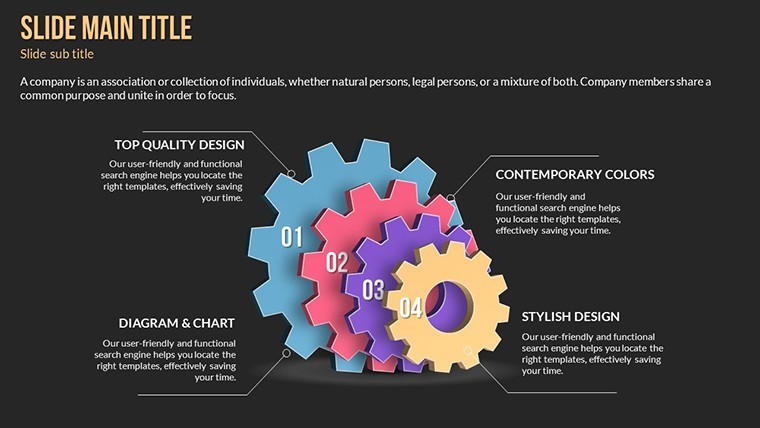
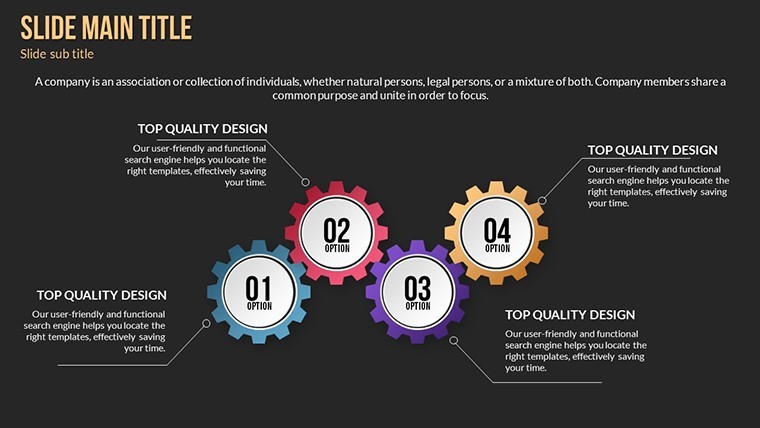
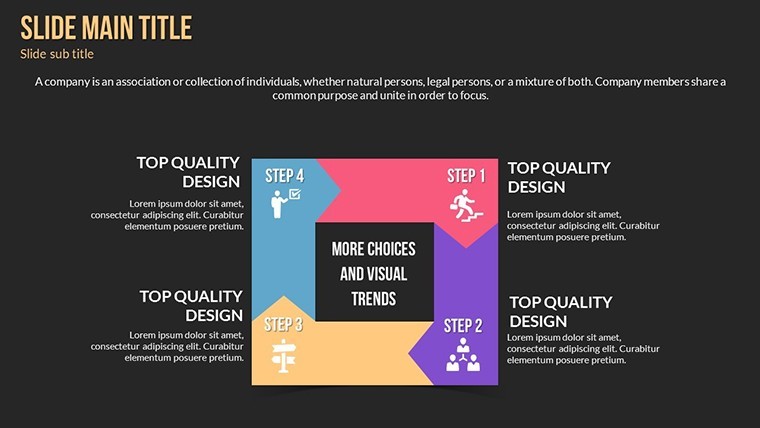
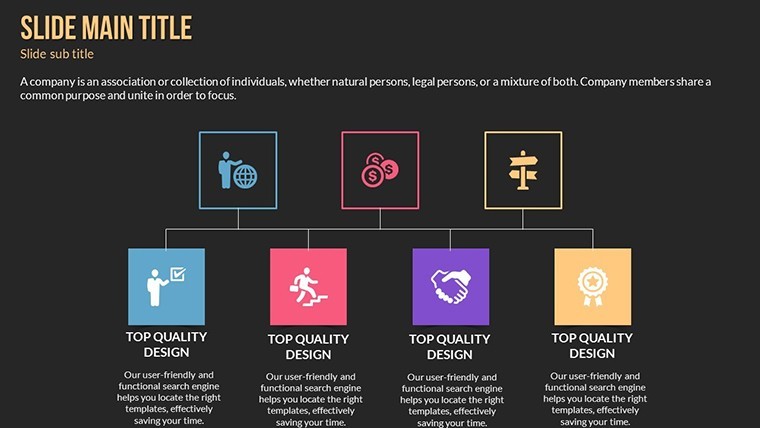
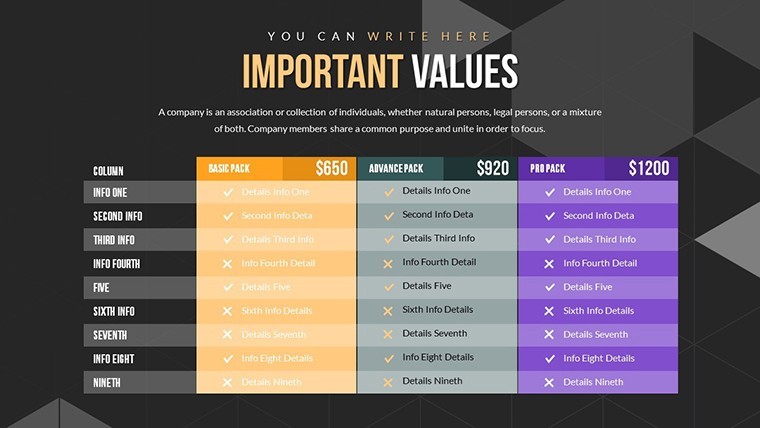
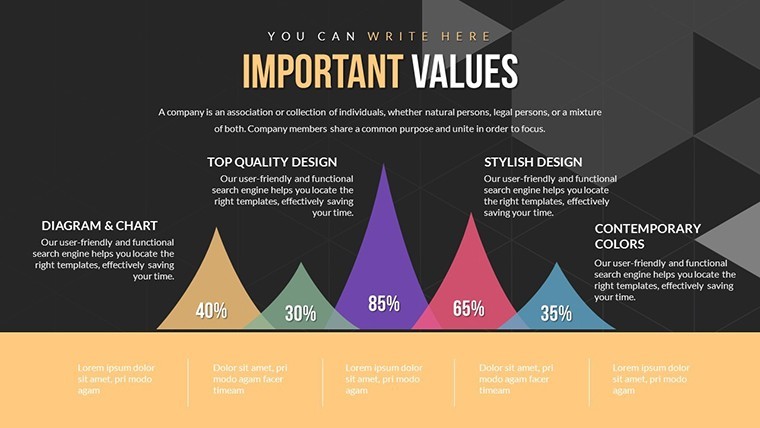
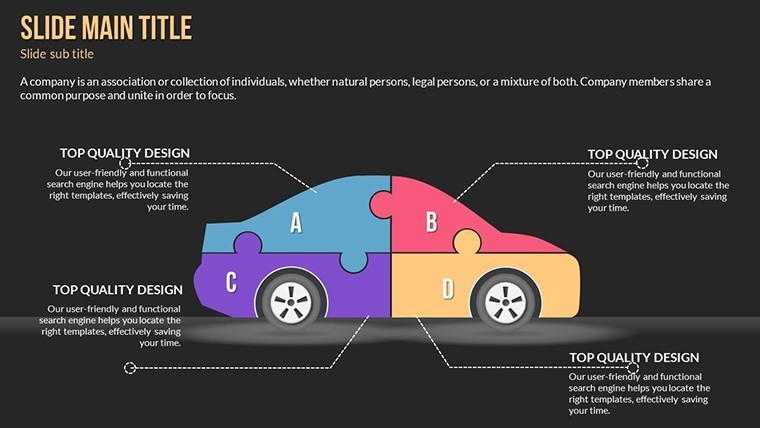
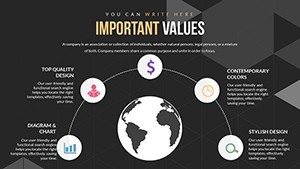
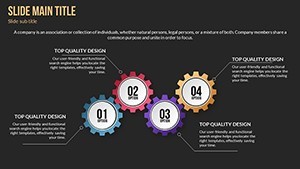
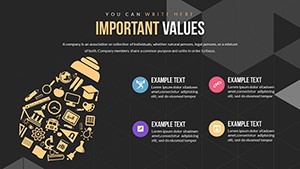
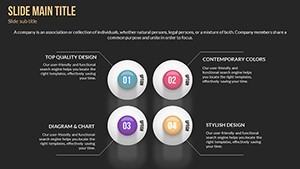
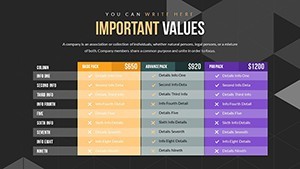
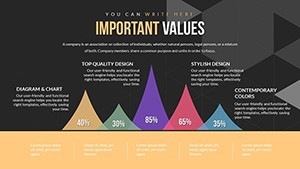
What sets this template apart? Its focus on relationship-oriented designs, packed with features that enhance usability and aesthetics. From org charts to Venn diagrams, the slides cover a spectrum of visual tools to represent interconnections.
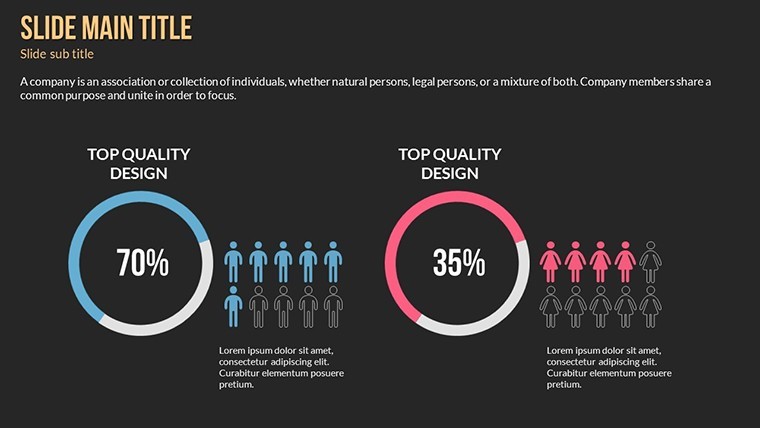
- Vibrant Color Variations: Select from bold palettes to emphasize different relationship strengths - use gradients for evolving partnerships or contrasts for conflicts.
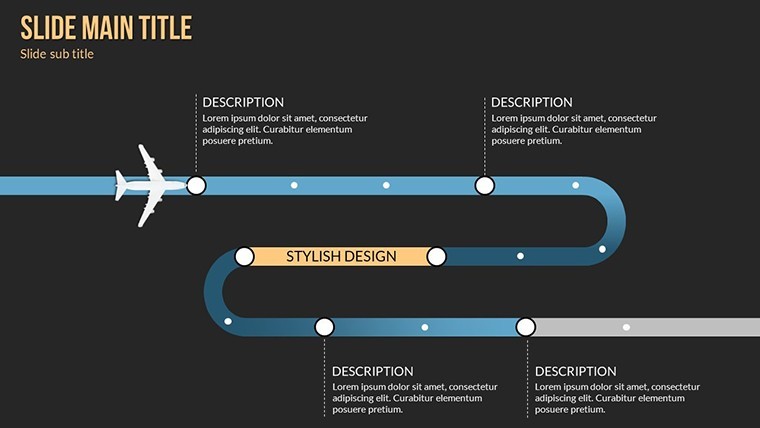
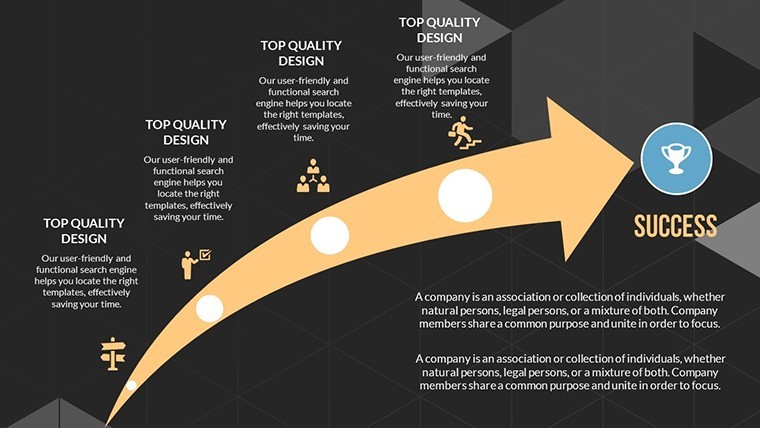
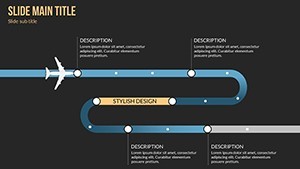
- Custom Animations: Bring diagrams to life with transitions that simulate growth, like expanding nodes in a network graph, ideal for step-by-step explanations.
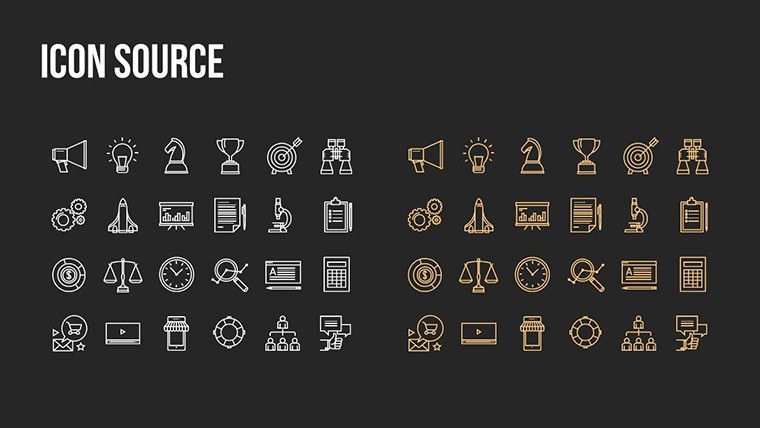
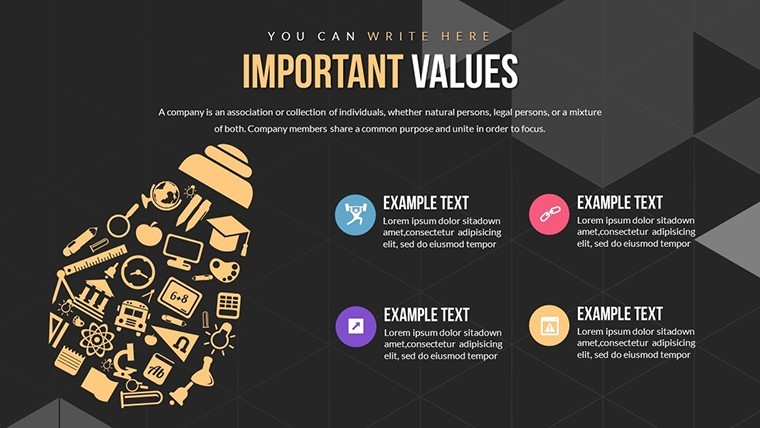
- Vector Icons and PNG Files: A library of scalable icons representing people, links, and flows, plus PNGs for transparent overlays in complex layouts.
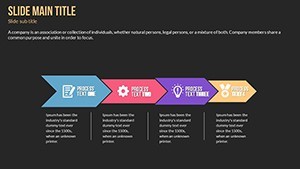
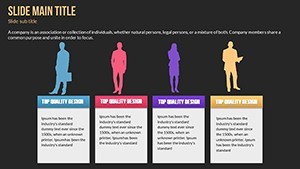
- Fully Editable Elements: Adjust shapes, lines, and labels effortlessly; integrate your data for personalized insights.
This compatibility extends to mobile devices, so you can refine presentations on the fly. Unlike generic templates, this one is optimized for high-engagement scenarios, drawing from design principles like those in "The Visual Display of Quantitative Information" by Edward Tufte.
Practical Use Cases: Connecting Ideas in Action
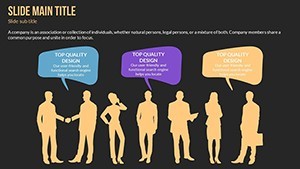
In business, use it for stakeholder mapping - visualize how departments interlink in a project, much like how companies like Google diagram their internal ecosystems for efficiency. Educators might adapt it for biology lessons on food webs, where animations show predator-prey dynamics unfolding.
A real-world example: A consulting firm used similar relationship charts to redesign a client's supply chain, identifying bottlenecks through visual hierarchies. This led to a 25% efficiency boost, as per industry reports from McKinsey. For marketers, customer relationship management becomes visual - plot touchpoints in a journey map to spot improvement areas.
Step into a sales pitch: Start with a simple node, animate expansions to show partnership growth, and end with a call-to-action slide. This narrative flow keeps audiences engaged, aligning with storytelling techniques from experts like Nancy Duarte.
Optimization Tips: Integrate and Elevate Your Workflow
To maximize this template, begin by outlining your key relationships. Import data from tools like Excel or Lucidchart, then apply animations for timed reveals.
- Download the .key zip and unzip to access slides.
- Open in Keynote and select a base diagram.
- Customize with your colors and icons via the Format panel.
- Add animations for sequential builds.
- Export or present directly for immediate impact.
Compared to starting from scratch, this saves design time while offering professional polish. With 159 ratings praising its versatility, it's a trusted choice. Subtle CTAs like "Visualize your networks now" encourage downloads, blending seamlessly into your content strategy.
For advanced users, layer in hyperlinks between slides for interactive navigation, turning your deck into a relational database of sorts. Draw authority from sources like the Project Management Institute's guides on dependency mapping to add depth.
Ultimately, this template isn't just slides - it's a bridge to better understanding. Whether forging business ties or teaching interconnections, it equips you to present relationships with precision and panache. Ready to connect the dots? Grab this template and transform your visuals today.
Frequently Asked Questions
How customizable are the relationship diagrams?
Completely - edit shapes, connections, and colors to tailor to your specific data sets.
Is it compatible with PowerPoint?
Yes, export as PPT while retaining most features, though animations may vary.
Can I add my own icons?
Sure, import custom vectors or use the included library for quick enhancements.
What Keynote version is required?
Version 7.0 or later for optimal animation and editing support.
Are there tutorials for using animations?
Keynote's help menu covers basics; our site offers advanced tips for relationship charts.
How do I handle large data sets?
Scale diagrams dynamically; duplicate slides for multi-part visuals.