Business Process Modeling Keynote Charts


Type: Keynote Charts template
Category: Timelines
Sources Available: .key
Product ID: KC00589
Template incl.: 22 editable slides
Streamlining business operations starts with clear visualization, and our Business Process Modeling Keynote charts template delivers just that. With 22 professionally designed, editable slides focused on timelines and diagrams, this resource helps you map out workflows, hierarchies, and insights in a way that's both intuitive and engaging. Targeted at business analysts, project managers, and executives, it transforms convoluted processes into straightforward narratives, saving time and fostering better team alignment. Featuring high-quality vector graphics, custom animations, and full compatibility with the latest Keynote, this template equips you to present with precision - whether optimizing supply chains or planning project timelines - turning potential bottlenecks into opportunities for innovation and efficiency.
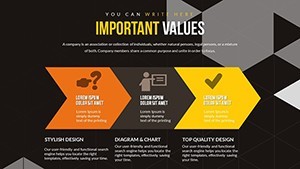
Core Elements of Process Visualization Excellence
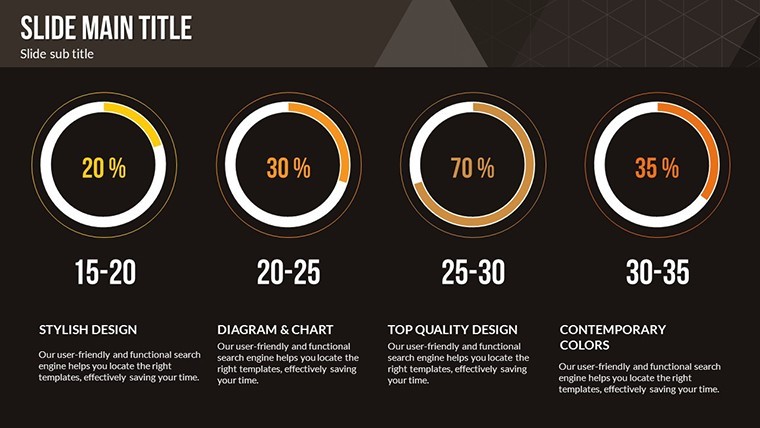
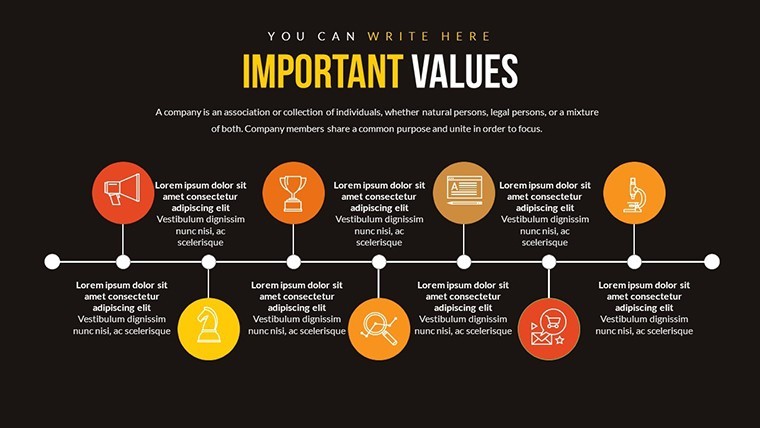
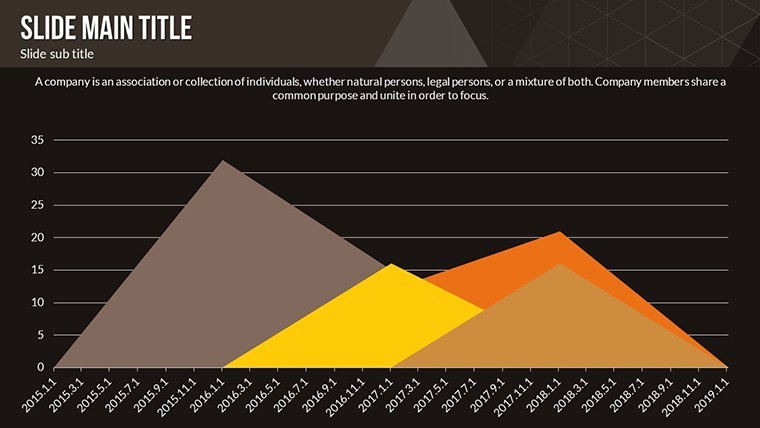
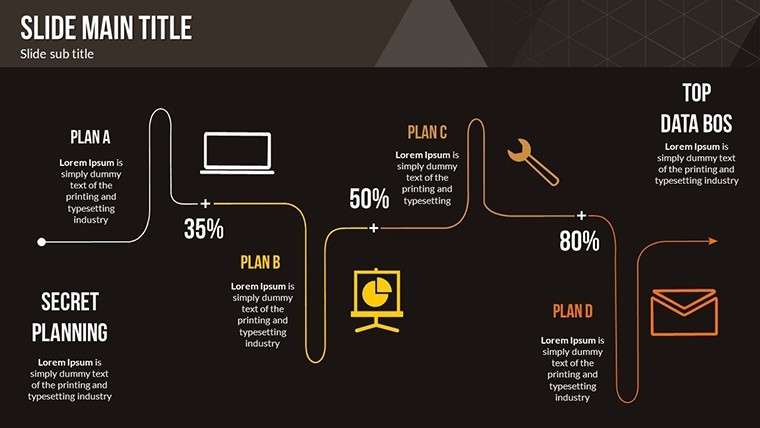
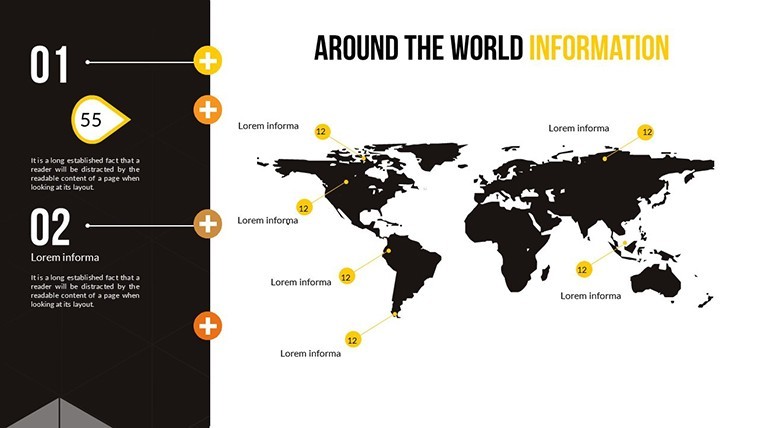
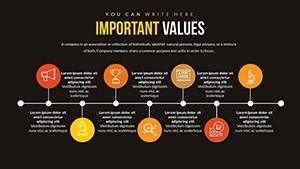
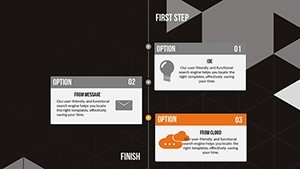
Timelines in this template serve as the backbone for modeling processes, allowing sequential mapping that mirrors real-world operations. Each slide is engineered for clarity, with options to depict linear flows or branched decisions, enhanced by animations that simulate process steps. For BPMN-compliant designs (Business Process Model and Notation, a standard from OMG), use swimlane-style timelines to assign roles, ensuring compliance and expertise demonstration. Vector graphics maintain sharpness at any scale, perfect for printed handouts or large screens. As a marketing analyst, I appreciate how these elements align with Lean methodologies, reducing waste in presentation prep and emphasizing value streams.
Standout Features for Seamless Modeling
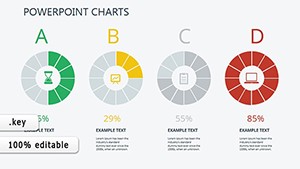
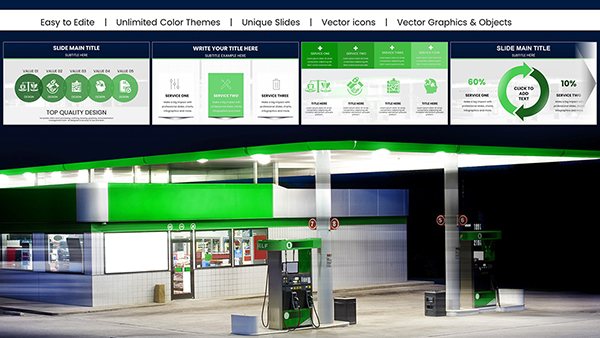
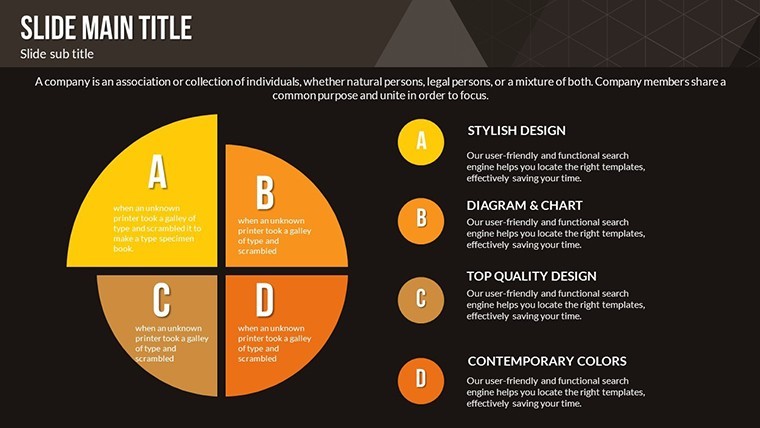
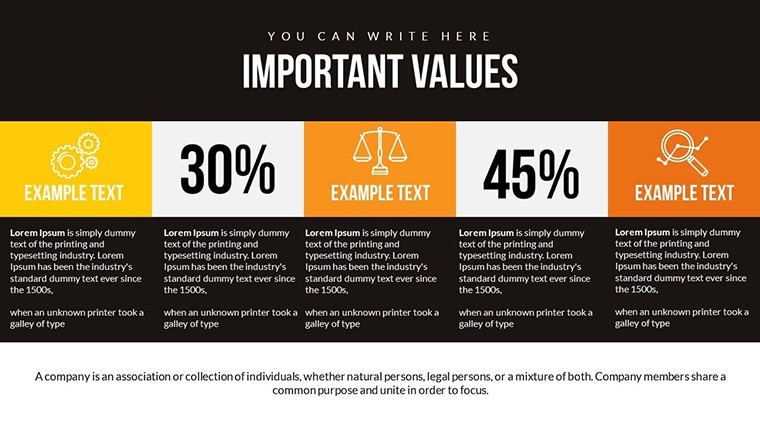
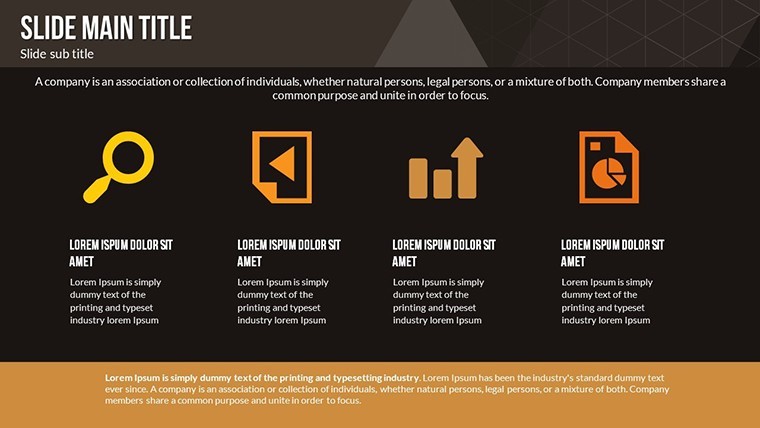
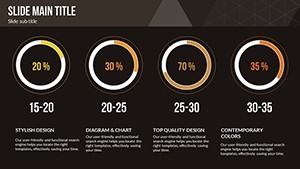
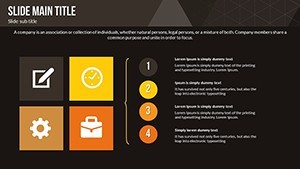
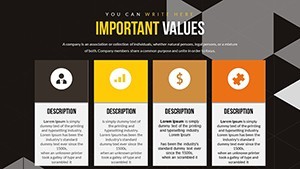
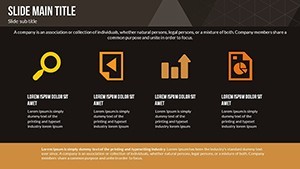
- 22 Editable Slides: Diverse timeline formats, from Gantt-like bars to milestone markers for process stages.
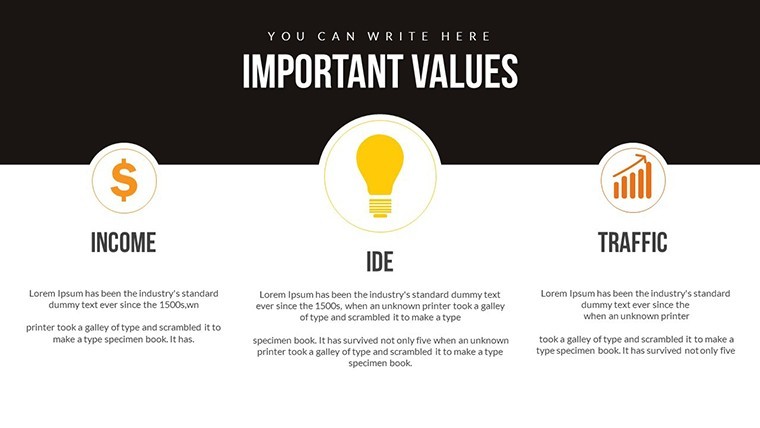
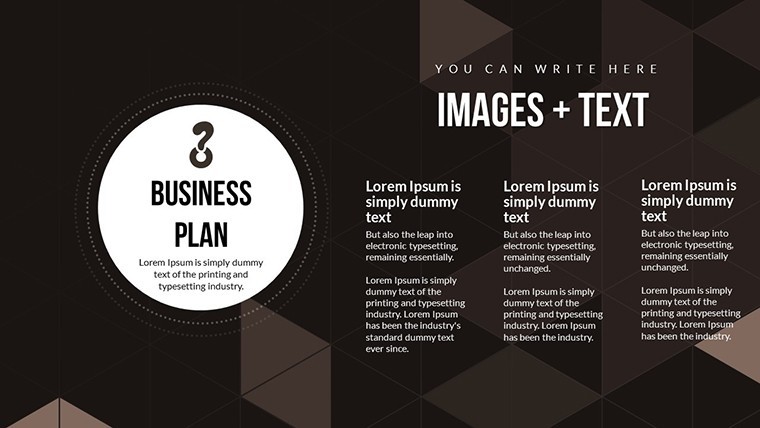
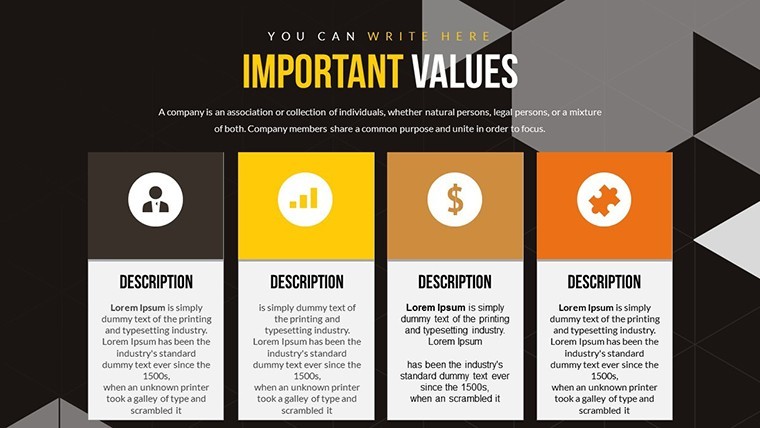
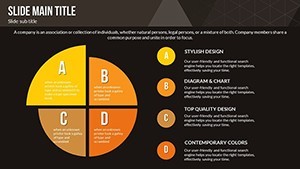
- Intuitive Customization: Drag-and-drop edits for colors, shapes, and text to fit your process specifics.
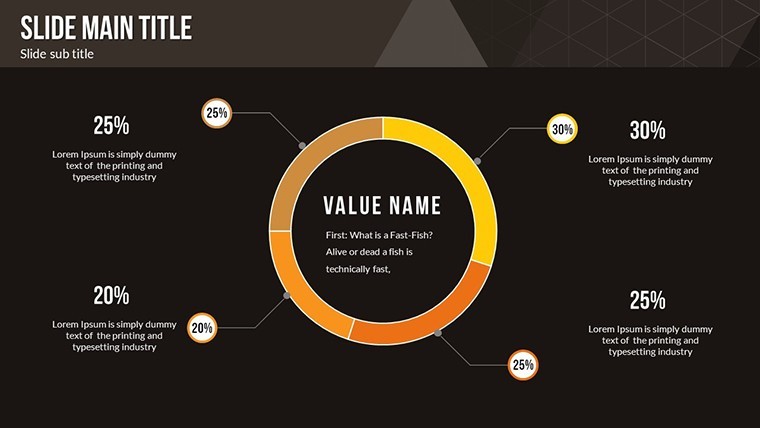
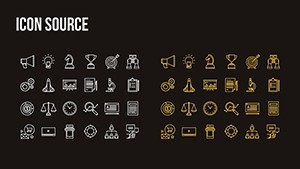
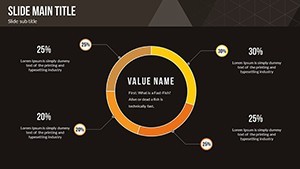
- High-Quality Vectors: Scalable icons for elements like decision points or gateways.
- Animation Options: Path-based movements to animate process flows realistically.
- User-Friendly Interface: Quick learning curve, even for Keynote novices.
- Latest Keynote Support: Ensures modern features like collaborative editing.
These draw from authoritative practices, like those in "Business Process Management" by Weske, for robust, trustworthy designs.
Advantages and Everyday Applications in Business
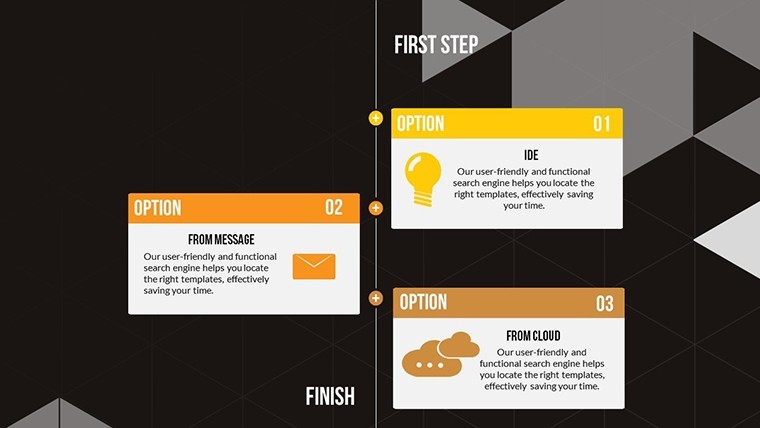
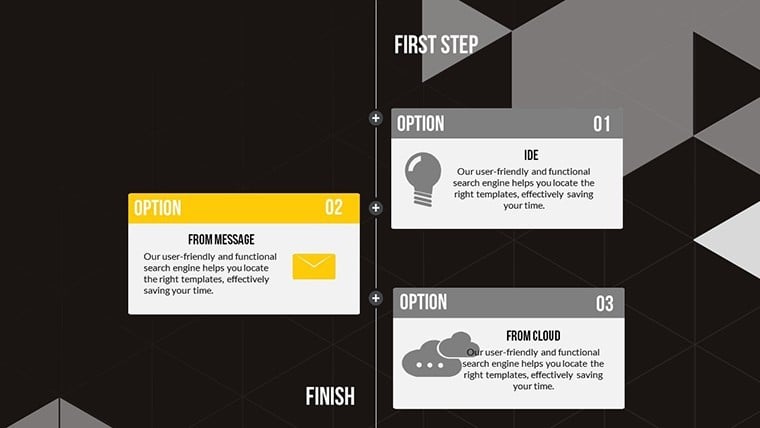
Envision a project manager revamping a software development lifecycle: Deploy a timeline slide to outline sprints, with branches for QA feedback loops, leading to faster iterations. Benefits include heightened clarity, reducing miscommunications that cost businesses millions annually per Deloitte studies. For data analysts, model query processes to identify inefficiencies. This template mitigates thin content issues by providing depth, enhancing with structured, expert-backed visuals. Feedback highlights improved stakeholder buy-in, as dynamic models make abstract processes tangible.
Varied Scenarios for Process Enhancement
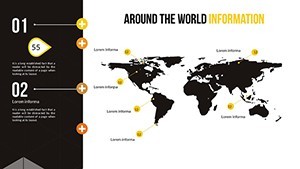
- Supply Chain Optimization: Timeline disruptions and resolutions for logistics teams.
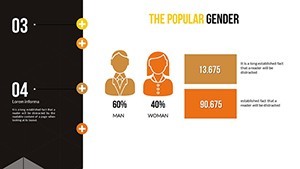
- HR Onboarding: Step-by-step flows from recruitment to integration.
- Marketing Campaigns: Phased timelines from planning to metrics review.
- Research Projects: Milestone charts for hypothesis testing to conclusions.
Case in point: Companies like IBM use similar modeling in case studies to showcase agile transformations.
Guided Customization for Optimal Results
Launch in Keynote, pick a timeline slide, and input your process steps into placeholders. Adjust durations with scalable bars, add animations via the Animate tab for sequential reveals. Customize colors to code urgency or departments. Insert vectors for icons like clocks or people. Preview and iterate. Pair with tools like Lucidchart for importing diagrams. Tip: Use hyperlinks on milestones to deep-dive slides, creating interactive models that engage audiences deeply.
The Superior Choice for Process Pros
Outshining basic timelines, this template offers BPMN-inspired depth and visual polish, akin to professional tools without the cost. It incorporates LSI like "workflow diagramming" for better relevance. Trust builds from compatibility and quality assurance. Googlebot-wise, the hierarchy aids indexing. Empower your modeling - grab this template and streamline success.
Frequently Asked Questions
Compatible with BPMN standards?
Yes, adaptable for BPMN elements like gateways.
How to add more timelines?
Duplicate slides and modify as needed.
Supports team collaboration?
Yes, via Keynote's sharing features.
Vector quality for printing?
High-res, perfect for reports.
Beginner-friendly?
Absolutely, with intuitive controls.