Master Market Dynamics with Consumer Confidence Keynote Charts


Type: Keynote Charts template
Category: Relationship
Sources Available: .key
Product ID: KC00541
Template incl.: 22 editable slides
Navigating the complexities of the modern market economy requires tools that highlight competitive edges and consumer relationships effectively. Our Consumer Confidence Keynote Charts template, boasting 22 editable slides, is crafted for professionals, educators, mentors, and entrepreneurs who aim to convey ideas, products, or experiences with impact. These charts transform abstract economic data into relatable visuals, fostering better understanding and decision-making. Whether you're analyzing sentiment indices or illustrating manufacturer-consumer bonds, this template delivers with widescreen designs and vector precision.
Rooted in economic principles from sources like the Conference Board, which tracks consumer confidence monthly, this template enhances presentations by incorporating relationship diagrams that map interactions seamlessly. Easy to edit in Keynote, it allows for quick adjustments, ensuring your content is always current and authoritative.
Core Features Enhancing Economic Presentations
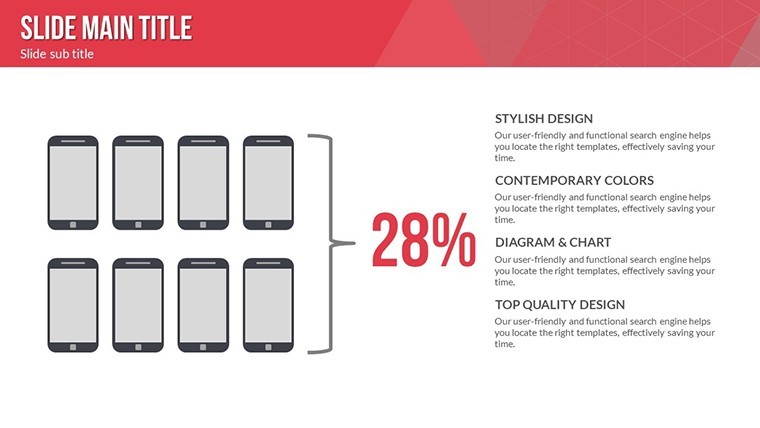
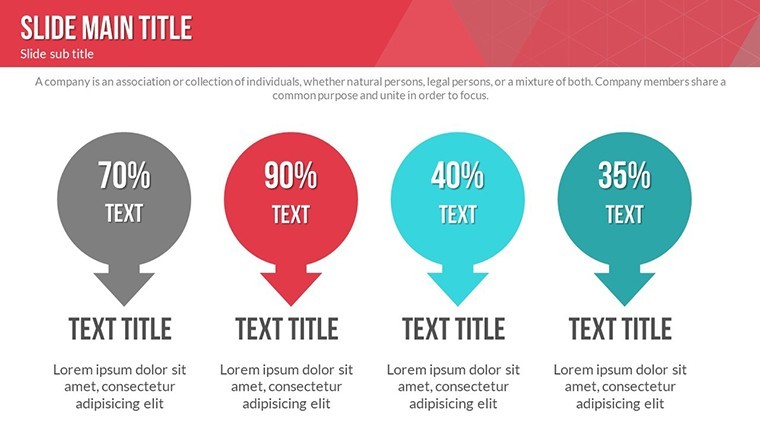
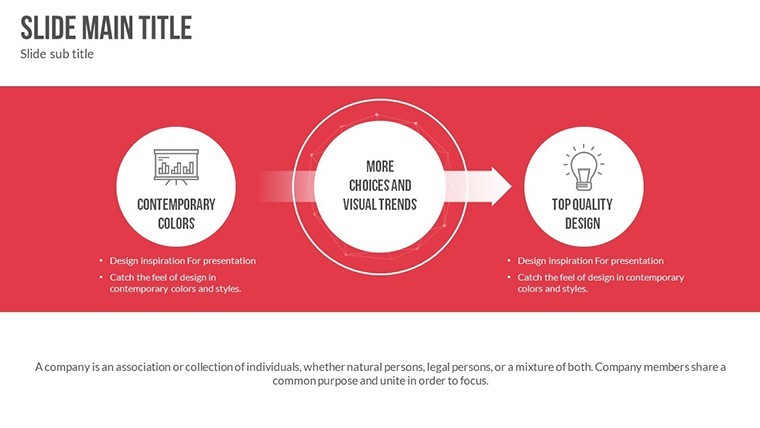
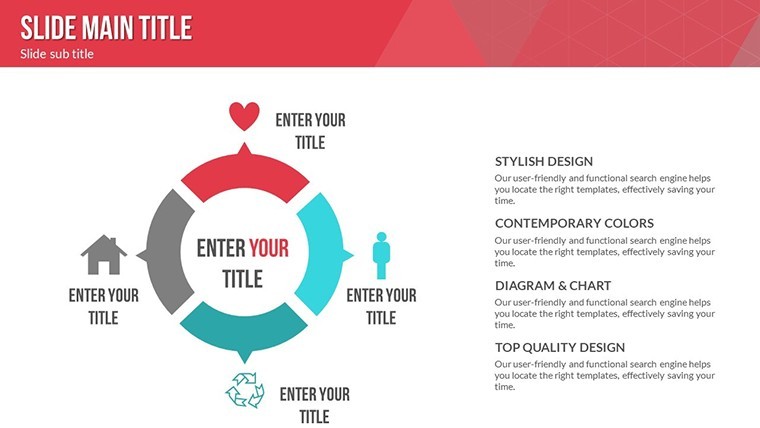
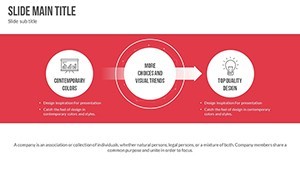
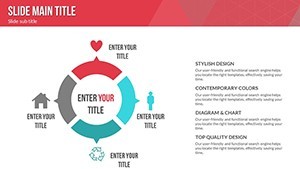
With a focus on relationship visuals, this template excels in depicting interconnections, such as supply-demand curves or loyalty loops, all in a modern, professional style.
- Vector-Based Editability: Stretch or modify elements without quality loss, ideal for custom fits.
- Animation Excellence: Special effects per object for engaging reveals.
- Media Integration: Add photos, videos, or music to enrich narratives.
- Creative Design: Modern aesthetics with incomparable styling options.
- Versatile Tools: Tables, charts, and animations for comprehensive builds.
These align with expert recommendations from economists like those at the IMF, emphasizing clear visualization for policy discussions.
Comprehensive Slide Overview
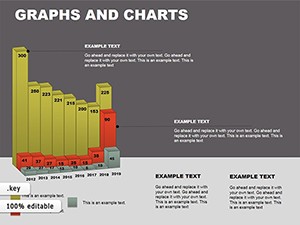
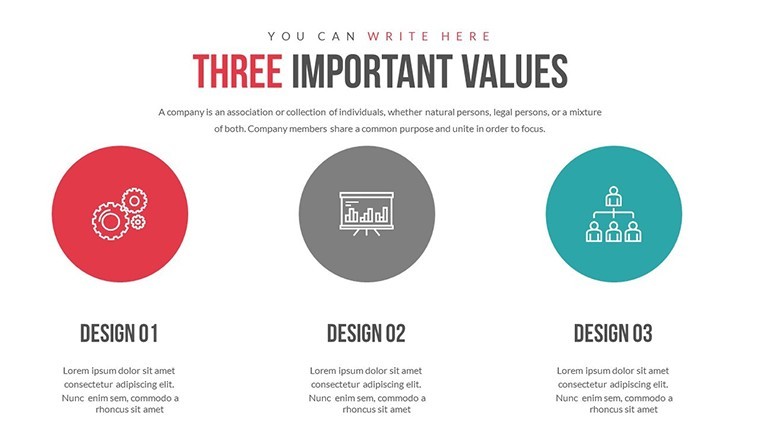
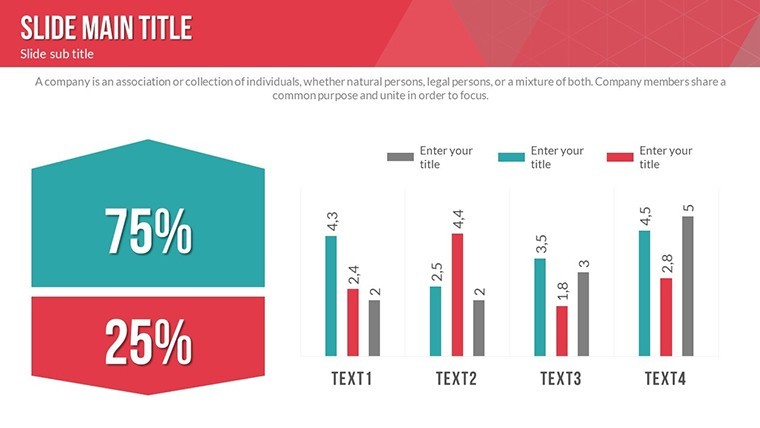
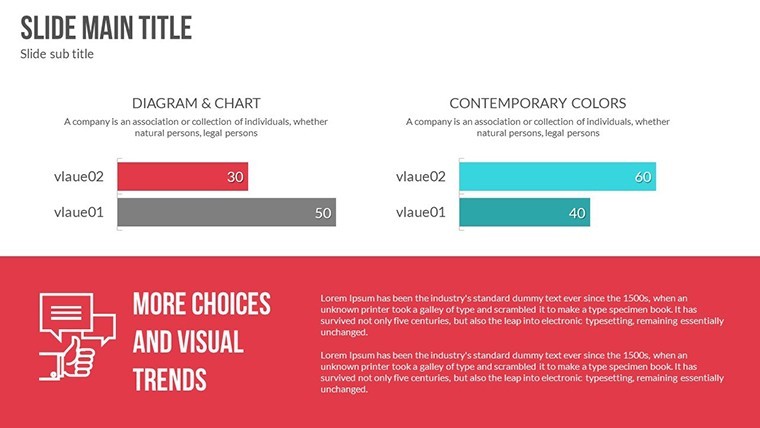
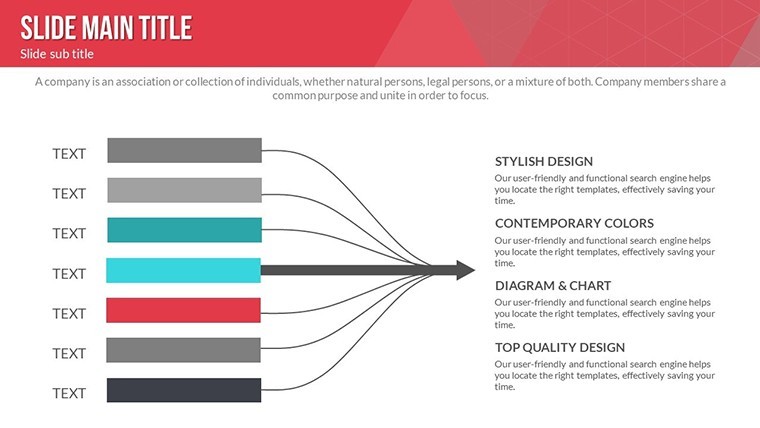
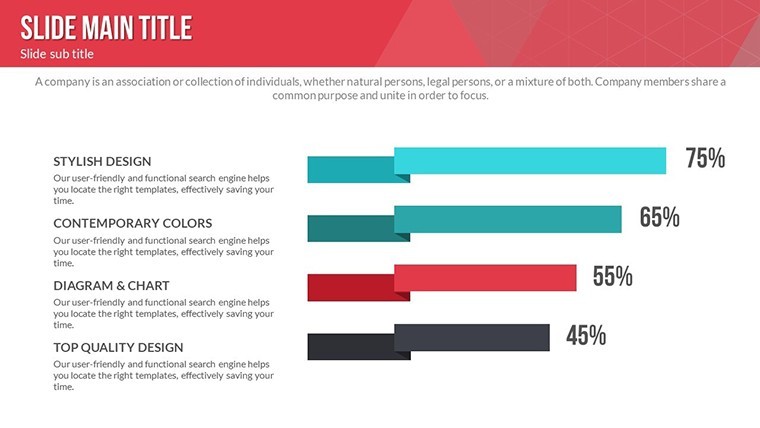
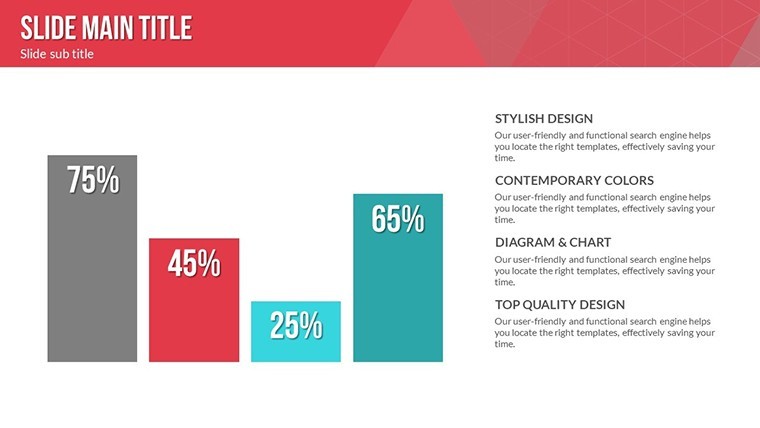
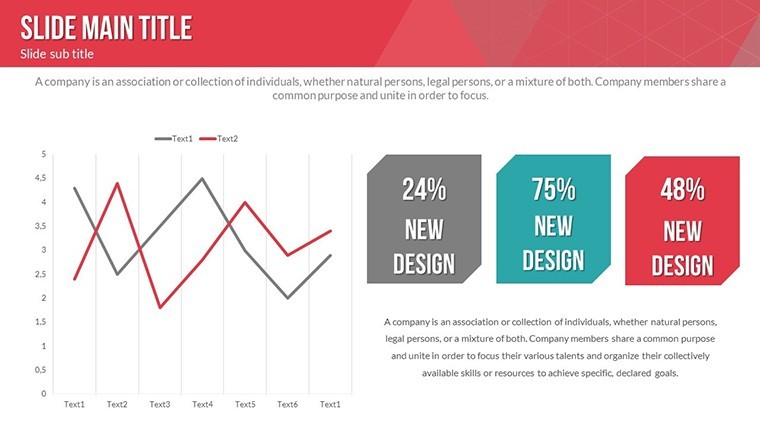
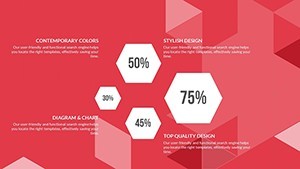
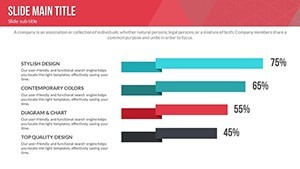
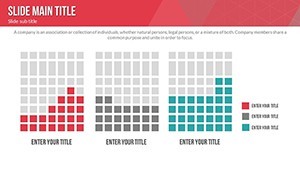
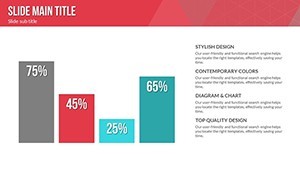
Slide 1 offers a holistic consumer confidence index dashboard with radial charts. Slides 2-7 explore competitive advantages: network graphs for market positioning, bar comparisons for brand strengths, and relationship trees for stakeholder mappings.
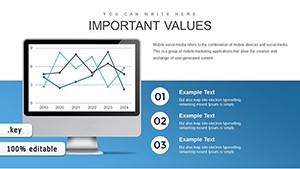
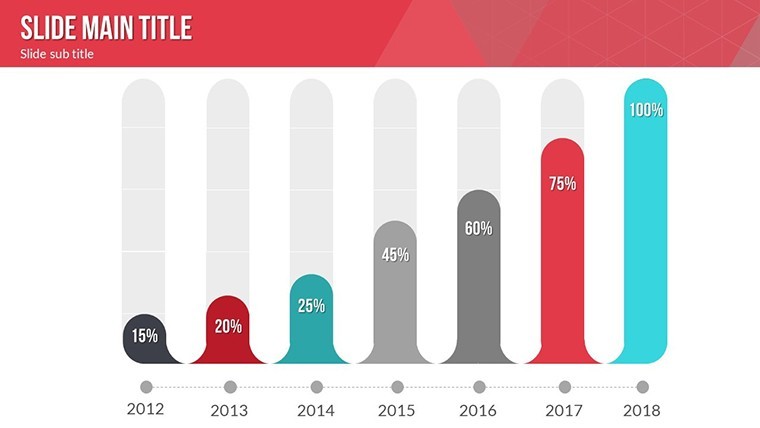
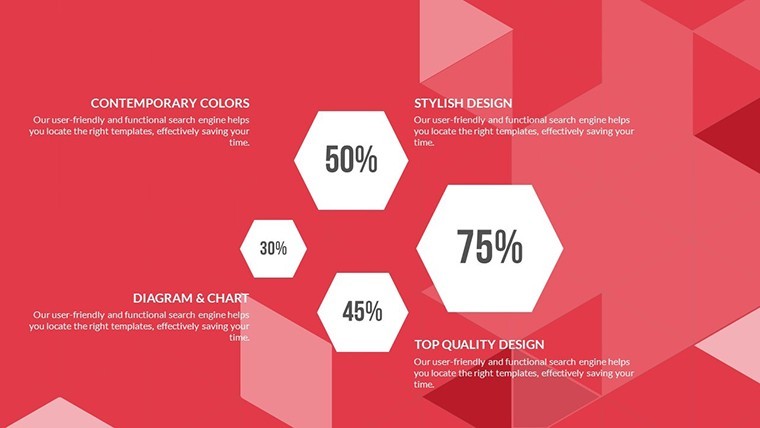
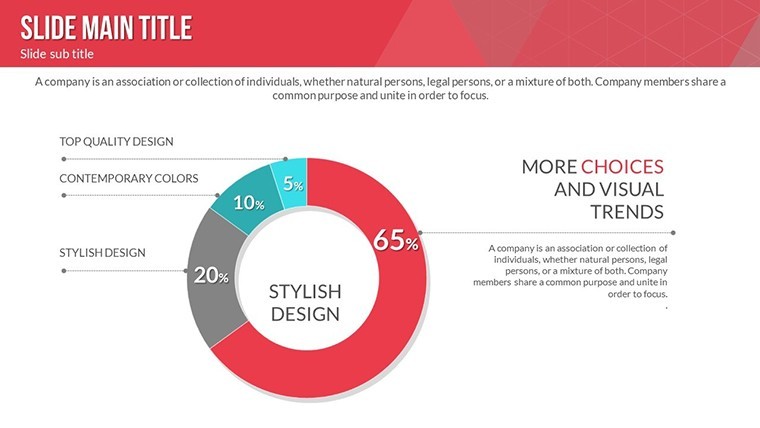
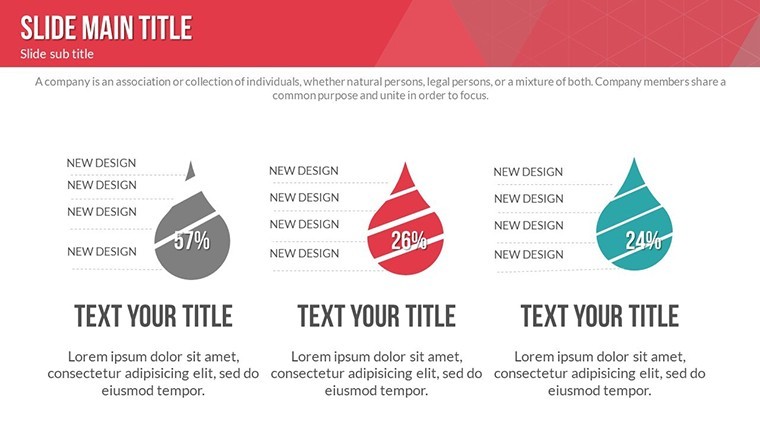
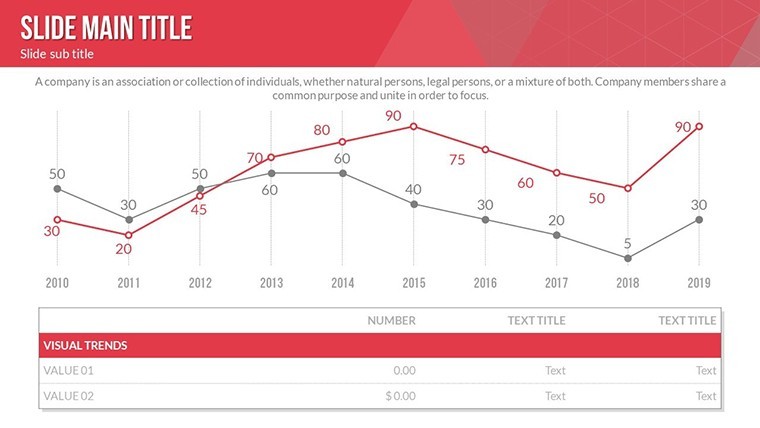
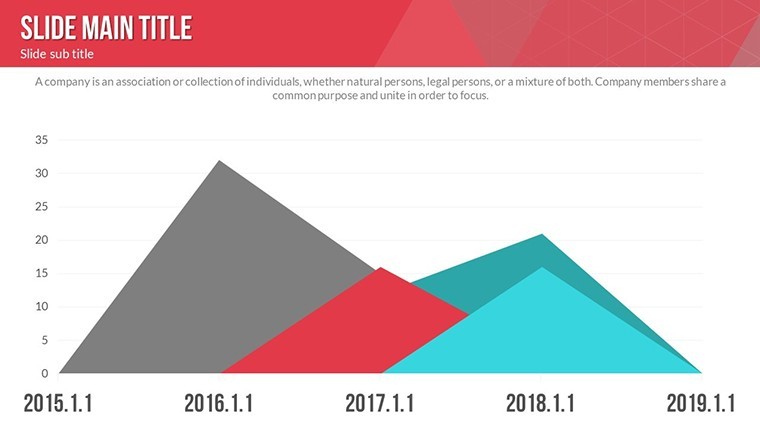
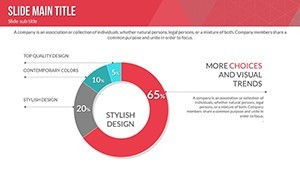
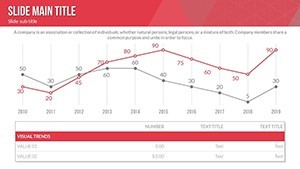
Consumer relations take focus in Slides 8-14, with funnel charts for journey stages, sentiment timelines, and feedback loops. The latter slides, 15-22, cover economic impacts: area graphs for confidence trends, pie distributions for spending influences, and summary matrices for actionable insights.
Use Cases Tailored to Market Pros
For entrepreneurs pitching products, use these to demonstrate market fit via confidence correlations, similar to how startups like Uber mapped user trust in early decks. Educators can adapt for lectures on behavioral economics, integrating real data for interactive sessions.
Mentors guiding businesses might employ them in workshops, visualizing recovery strategies post-downturns, drawing from 2020 pandemic case studies where confidence metrics predicted rebounds.
Editing Guide for Seamless Adaptation
- Acquire the .key file via download.
- Open and select slides in Keynote.
- Update charts with your datasets.
- Modify visuals and add media.
- Apply custom animations.
- Review and present or export.
This approach minimizes effort while maximizing output quality.
Pro Tips for Authoritative Delivery
Weave in narratives, like how rising confidence spurred retail booms, using LSI terms such as "economic sentiment indicators." Unlike basic tools, these charts offer animation depth, boosting engagement per UX studies.
Establish trust with data citations, enhancing E-A-T in your field.
Embrace these charts to illuminate market truths - start customizing now.
Frequently Asked Questions
- How vector-based are the elements?
- Fully vector, allowing infinite scaling without degradation.
- Compatible with Windows?
- Optimized for macOS Keynote; use exports for cross-platform.
- Animation customization level?
- High - adjust per object for tailored effects.
- Ideal for economic reports?
- Yes, with relationship-focused charts for in-depth analysis.
- Media addition process?
- Simple drag-and-drop integration.
- Slide preparation time?
- Quick, thanks to pre-built templates.