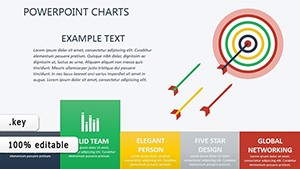
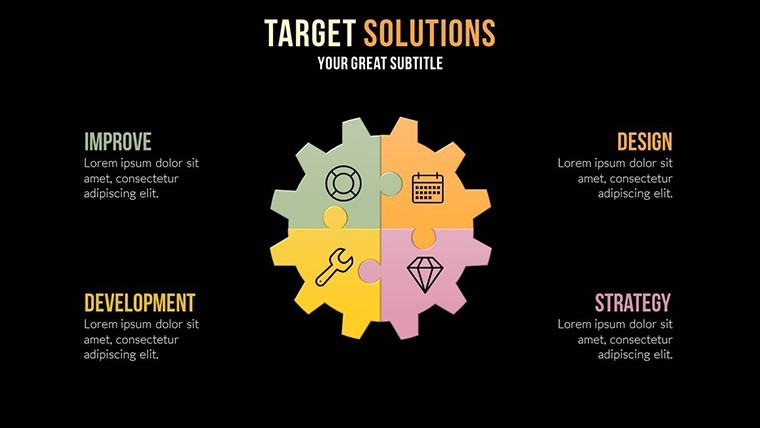
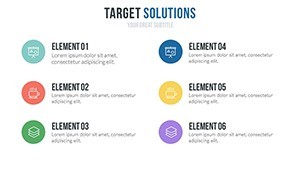
Target Solutions Relationships Keynote Charts: Build Stronger Connections Visually


Type: Keynote Charts template
Category: Relationship
Sources Available: .key
Product ID: KC00516
Template incl.: 18 editable slides
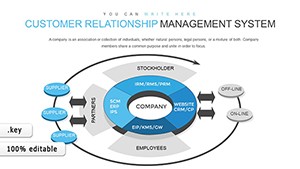
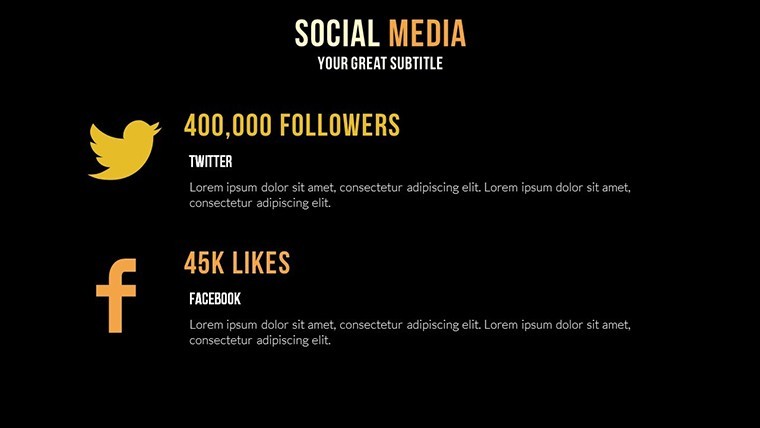
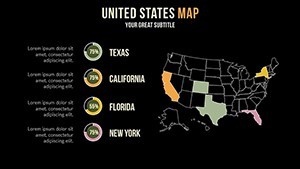
In an interconnected business landscape, illustrating relationships - be it partnerships, hierarchies, or networks - can turn abstract ideas into actionable insights. Our Target Solutions Relationships Keynote charts template provides 18 editable slides to help marketers, consultants, and leaders map out these dynamics with precision and flair. Designed for those who pitch ideas, report strategies, or educate teams, this template features customizable infographics that make complex interconnections clear and memorable. Envision transforming a tangled web of stakeholder relationships into a polished diagram that highlights synergies and opportunities, all within Apple Keynote's intuitive interface on Mac. With vector-based elements and animations, you'll create presentations that not only inform but inspire collaboration.
Core Features for Impactful Relationship Mapping
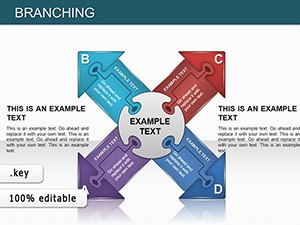
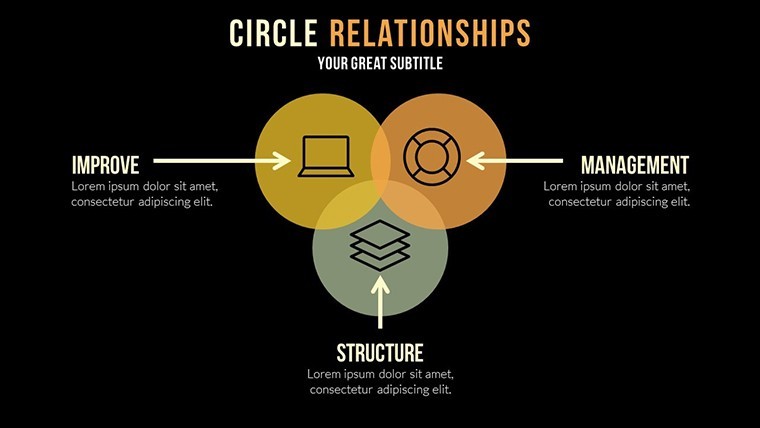
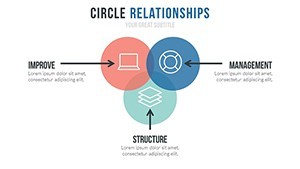
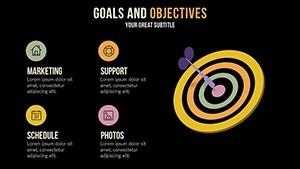
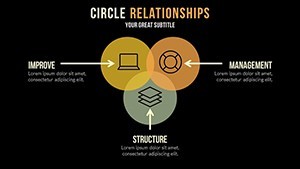
This template excels in offering a variety of graphs and charts, from org charts to Venn diagrams, all with user-friendly edits. Custom animations reveal layers progressively, aligning with storytelling techniques from experts like Nancy Duarte. A consulting firm, for instance, used analogous charts to depict client-vendor ecosystems, drawing from Gartner reports on supply chain resilience, which led to enhanced contract negotiations and a 20% efficiency gain.
Highlights of the Template's Toolkit
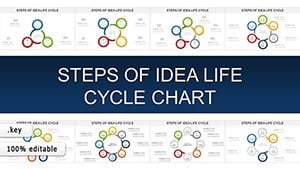
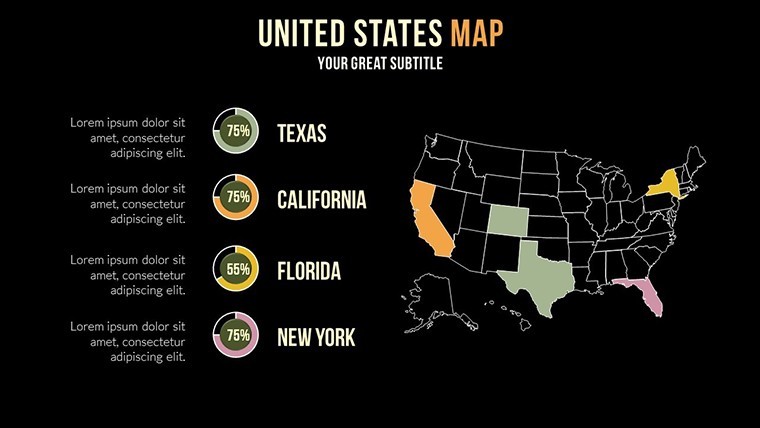
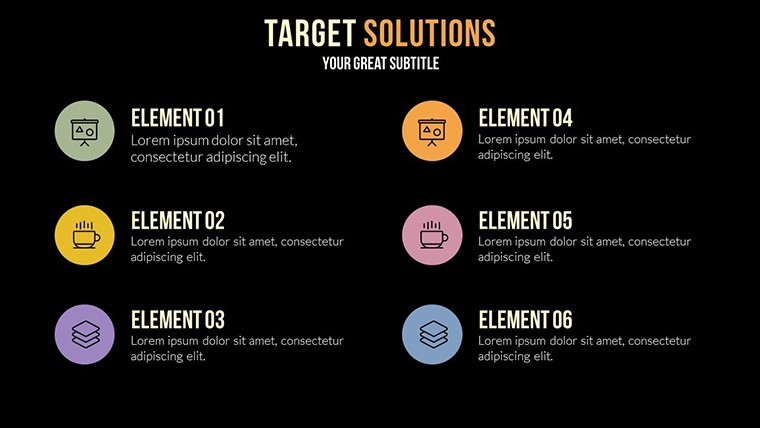
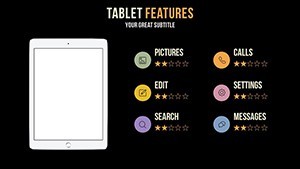
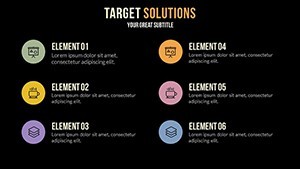
- 18 Editable Slides: Diverse layouts for hierarchies, partnerships, and influence maps.
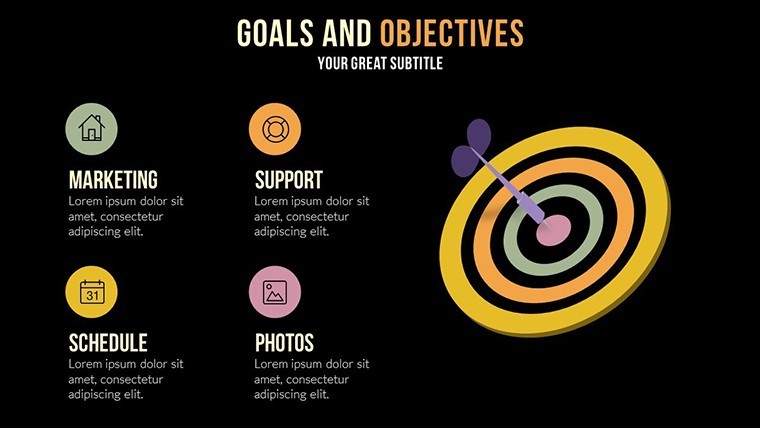
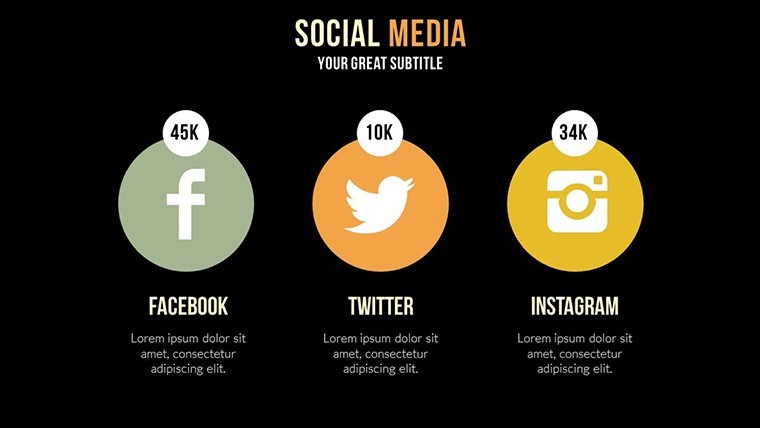
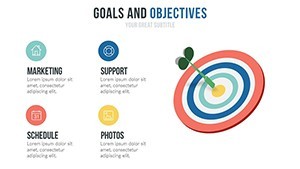
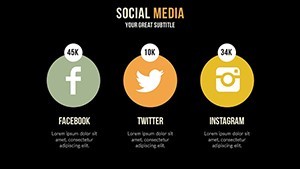
- Stunning Infographics: Visually rich elements to denote strengths and overlaps.
- Animation Capabilities: Smooth builds for engaging reveals during pitches.
- Brand Customization: Align colors and fonts with your identity seamlessly.
- Keynote Exclusivity: Tailored for Mac users, ensuring high-fidelity outputs.
Weave in terms like network diagrams or partnership visuals for natural LSI enhancement.
Applications That Foster Professional Growth
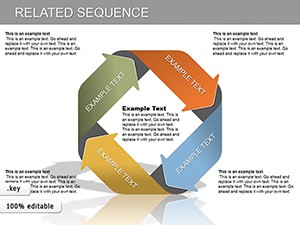
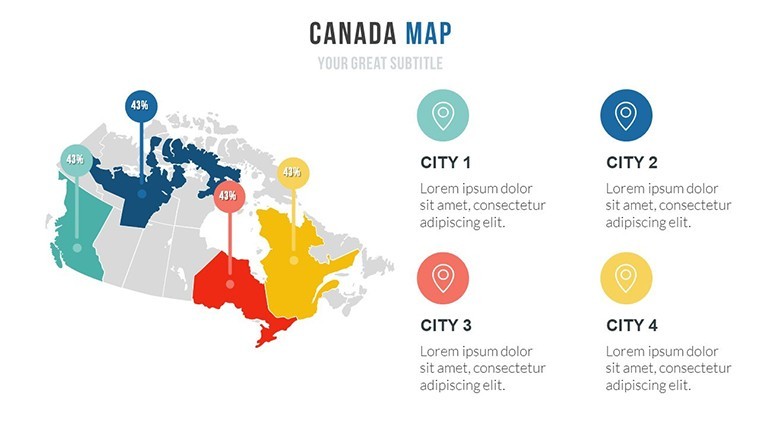
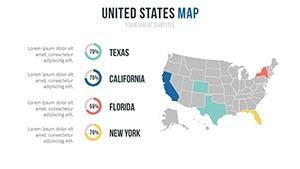
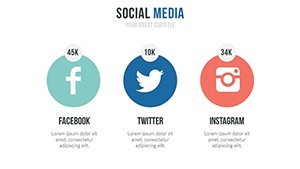
Apply this template in diverse scenarios: Marketers can illustrate customer journey maps, integrating CRM data for personalized pitches, similar to how Adobe campaigns visualize user ecosystems. Consultants might use radial charts for competitive analysis, referencing McKinsey's horizon models for strategic planning. Educators benefit by diagramming social theories, making concepts like Maslow's hierarchy interactive. Startups pitching to investors can showcase team structures and advisor networks, boosting credibility per Y Combinator guidelines. In sales, map out account relationships to identify upsell opportunities, supported by Salesforce best practices.
Practical Implementation Steps
- Setup: Download .key and open in Keynote.
- Map Basics: Input nodes for entities like partners or departments.
- Enhance Visuals: Add connectors and icons for clarity.
- Animate for Effect: Sequence appearances to build narrative tension.
- Refine and Deliver: Test on multiple devices for consistency.
Tip: Use negative space effectively, as per Gestalt principles, to emphasize key relationships without overcrowding.
Value Proposition for Modern Professionals
With 1194 ratings at 5 stars, this template's trustworthiness is evident. It outperforms basic tools by providing pre-built sophistication, saving design time while adhering to visual communication standards from the International Institute of Information Design. Integrate with mind-mapping apps like XMind for initial drafts, then refine in Keynote. For educators, align with Bloom's taxonomy by using charts to facilitate higher-order thinking.
Link to our relationship category for expanded options, ensuring a cohesive presentation suite.
Forge Better Bonds Today
Step up your game with visuals that strengthen ties. Download this template and start mapping relationships that matter - unlock new possibilities in your next session.
Frequently Asked Questions
What types of relationships can I chart? Hierarchies, partnerships, networks, and more with 18 versatile slides.
Are the infographics fully vector-based? Yes, scalable without quality loss.
Can I collaborate on edits? Ideal for shared Mac environments.
How do animations enhance presentations? They build suspense and focus attention on key connections.
Is there support for beginners? Intuitive design with basic instructions included.