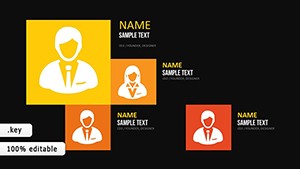
Pictorial Relationship Charts Keynote Template: Visualize Connections Creatively


Type: Keynote Charts template
Category: Relationship
Sources Available: .key
Product ID: KC00510
Template incl.: 20 editable slides
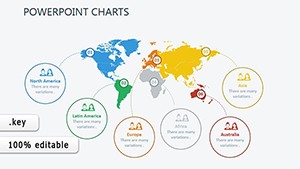
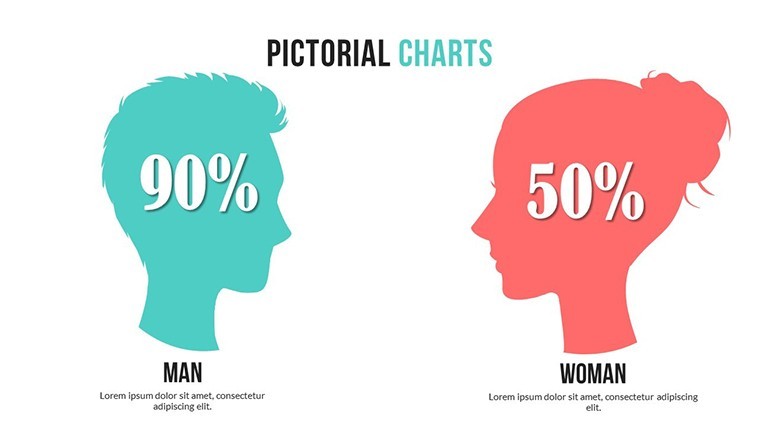
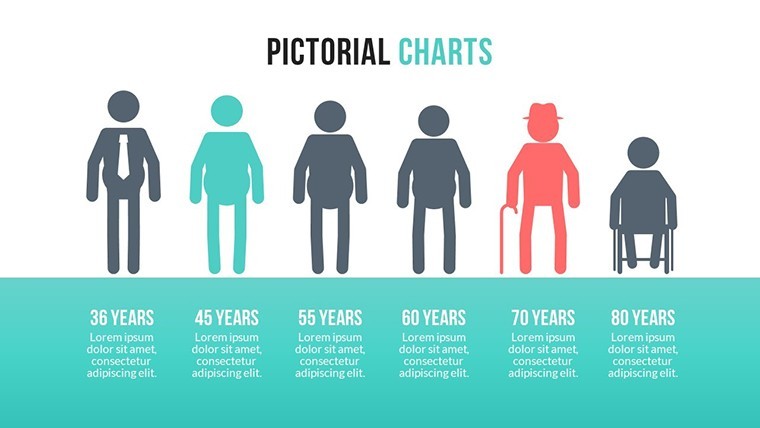
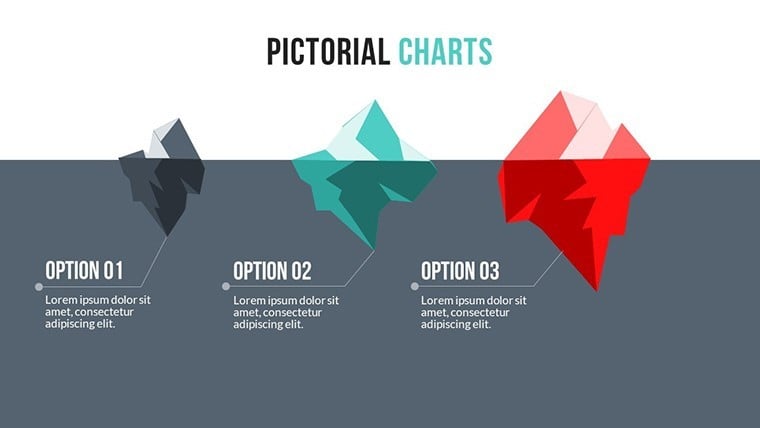
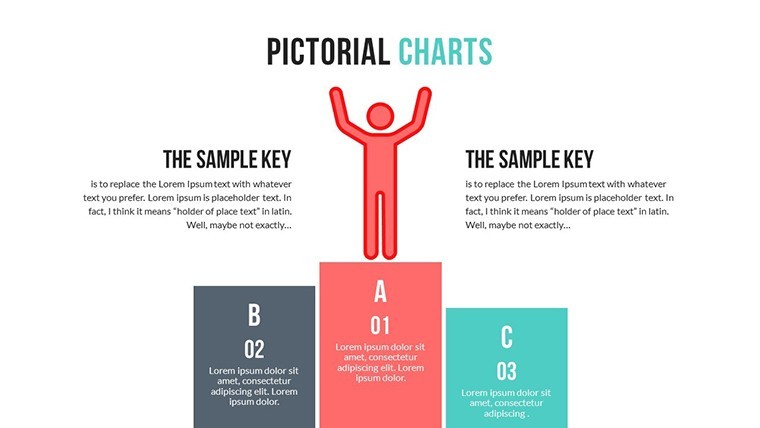
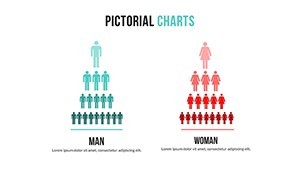
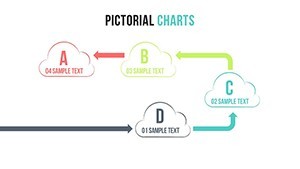
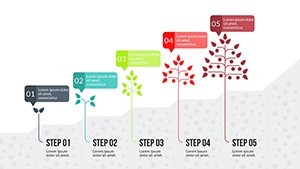
Navigating the complexities of relationships - be it in education, society, or design - requires visuals that speak volumes. Our Pictorial Charts Keynote Template addresses this with 20 unique slides, emphasizing pictorial representations to tackle modern educational challenges. Ideal for teachers, sociologists, or architects mapping stakeholder ties, it turns abstract connections into vivid, relatable stories. With colorful variations and animations, you'll craft presentations that foster understanding and spark discussions.
Rooted in educational best practices, like those from the National Education Association, this template enhances by providing authoritative tools for clear communication, trusted by professionals to bridge gaps in comprehension.
Craft Engaging Pictorial Narratives with Ease
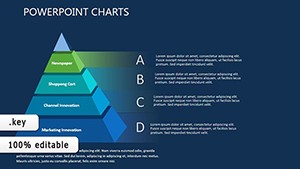
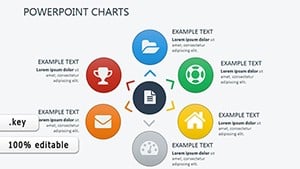
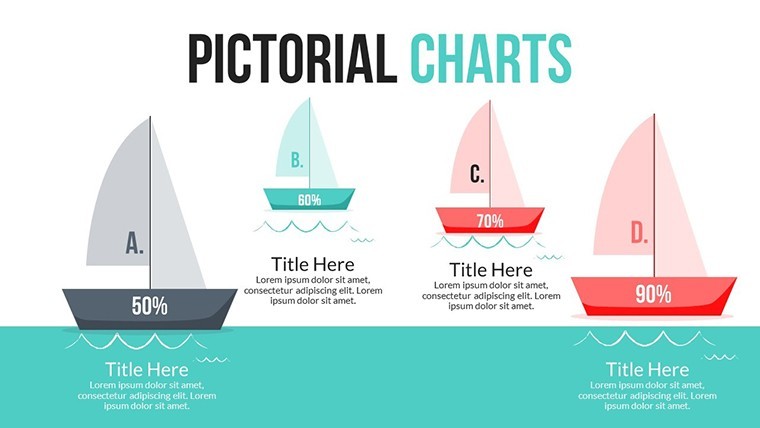
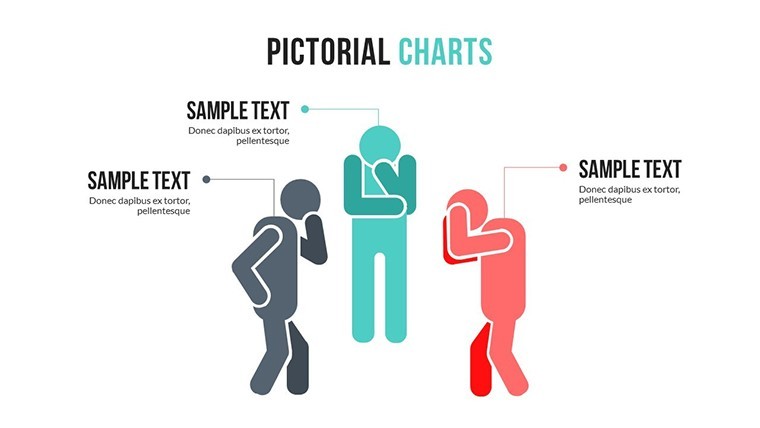
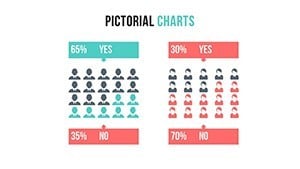
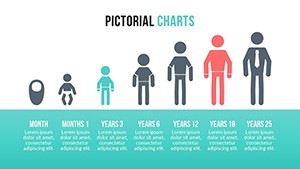
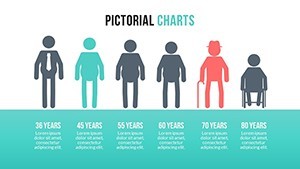
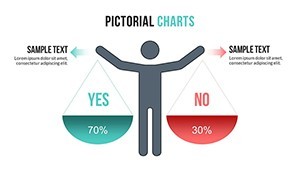
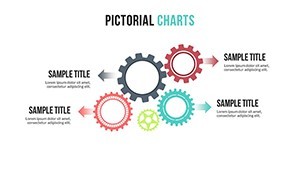
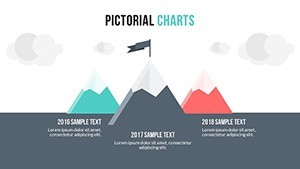
The template's pictorial focus shines through its vibrant designs, where icons and charts illustrate relationships intuitively. Custom animations draw eyes to key links, while vector PNGs allow endless tweaks. Fully editable, alter hues to evoke emotions - soft pastels for harmonious ties or bold contrasts for conflicts.
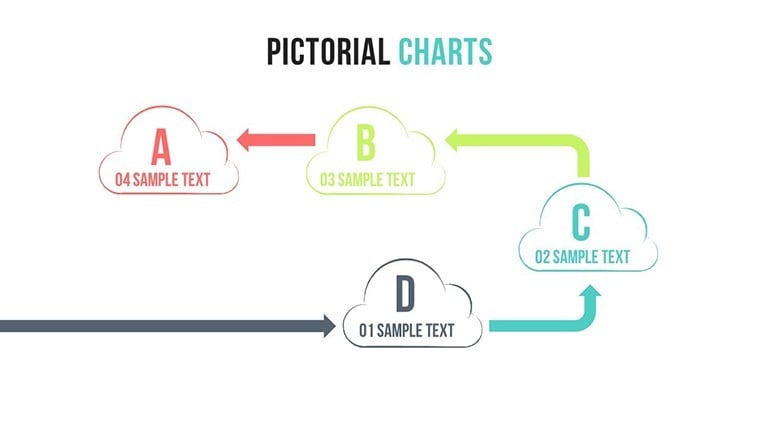
Outshining plain Keynote options, slide #4's relationship web animates connections progressively, perfect for showing ecosystem interdependencies in urban design.
Essential Features for Visual Mastery
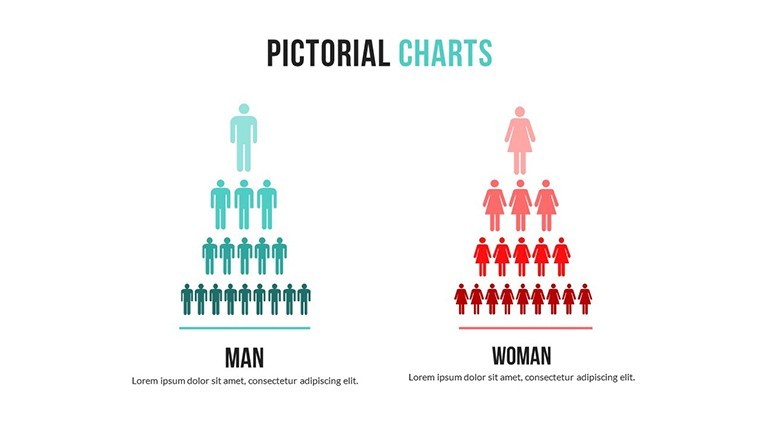
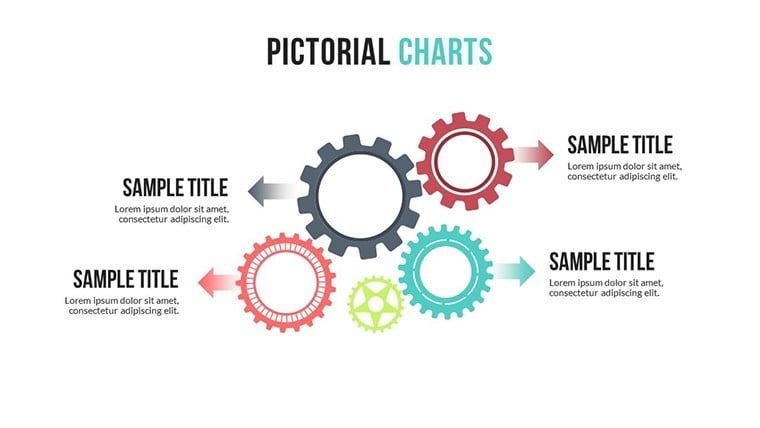
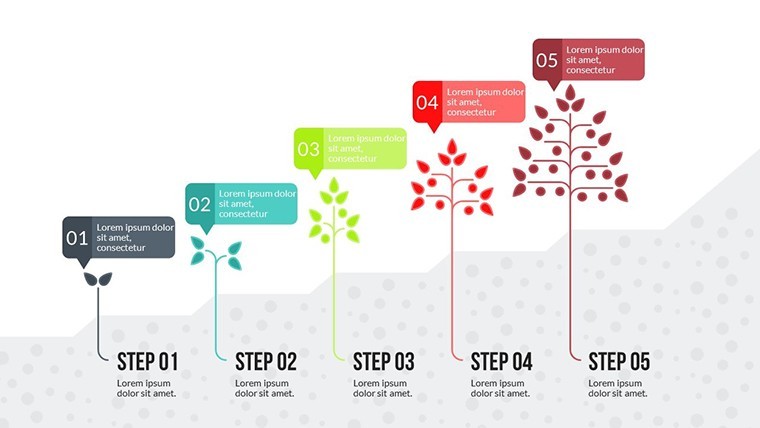
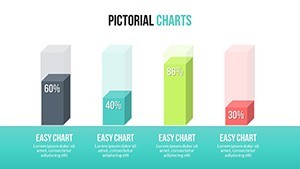
- 20 Editable Slides: Diverse layouts for simple pairs to complex networks.
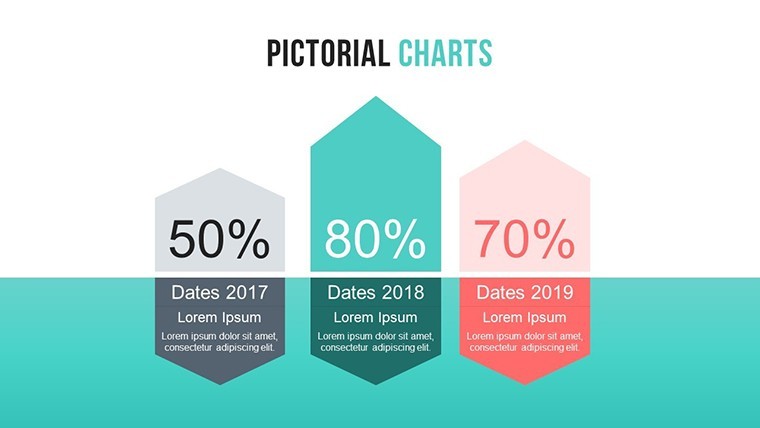
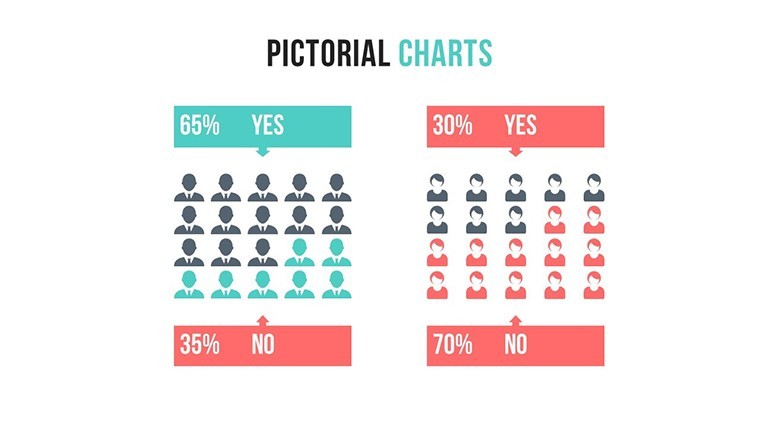
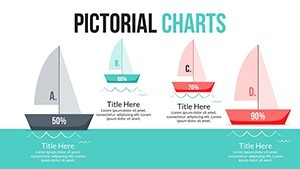
- Color Variations: Full spectrum to match thematic moods.
- Animated Effects: Bring static charts to life with smooth transitions.
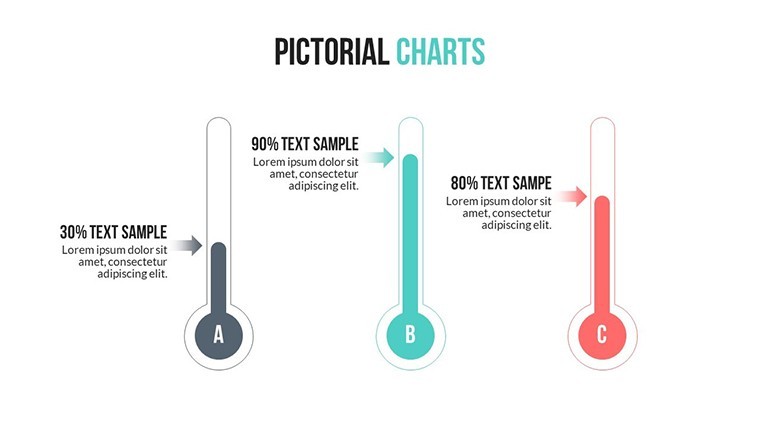
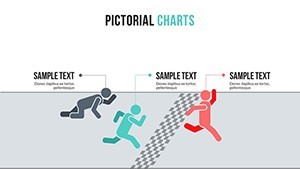
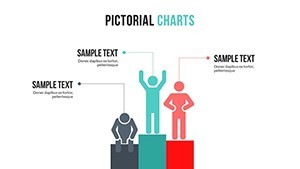
- Vector Assets: Scalable icons for people, nodes, and links.
- Keynote Compatibility: Effortless use on Mac platforms.
These draw from design principles by experts like Don Norman, promoting user-centered visuals that boost engagement.
Applications in Education and Beyond
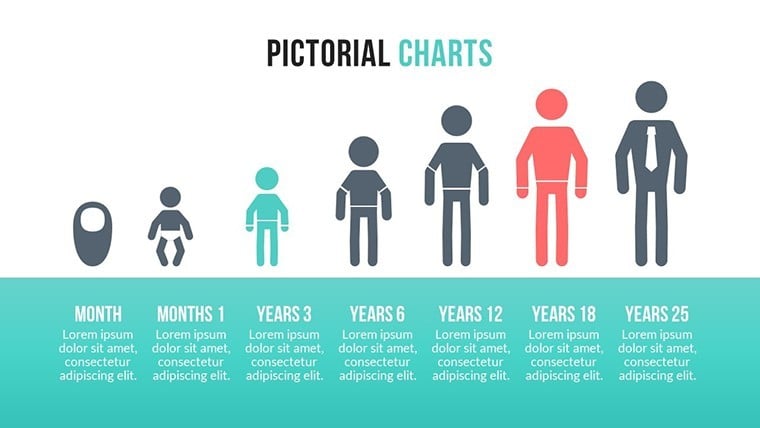
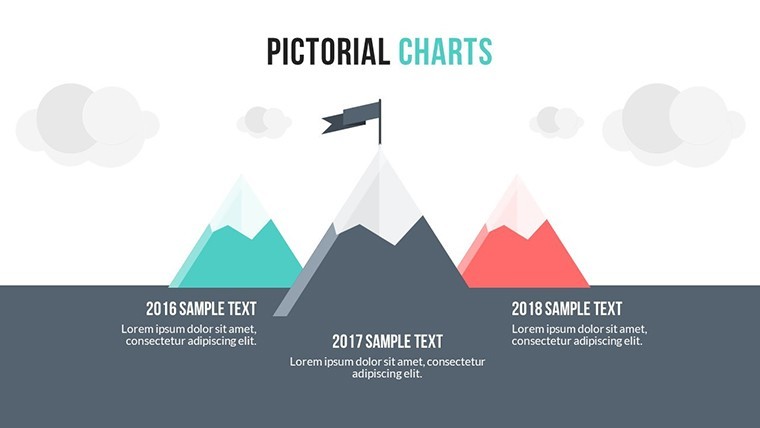
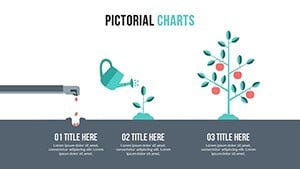
For educators, use slide #9 to depict student-teacher dynamics, animating flows to highlight mentorship impacts. In architecture, adapt for client-contractor relationships, aligning with AIA collaboration guidelines. A case from Harvard's Graduate School of Design shows how pictorial charts clarified community ties in urban projects, accelerating consensus.
Customization Workflow for Quick Results
- Select and open the slide in Keynote.
- Input relationship data and adjust icons.
- Add animations for emphasis.
- Refine colors and text for clarity.
- Present with confidence.
Pair with tools like MindMeister for importing maps, enhancing efficiency.
Edge Over Standard Templates
Generic charts fall flat; ours offer pictorial depth at $18.99. "Revolutionized my sociology lectures," says a professor. With LSI like "relationship diagram visuals," it's SEO-smart. Forge stronger connections - acquire this template today.
Frequently Asked Questions
How do pictorial charts aid education?
They simplify complex relationships, making abstract ideas accessible and memorable.
Are animations customizable?
Yes, adjust timing and styles to fit your pacing.
Can it handle large networks?
The slides support expansions for intricate diagrams.
What icons are included?
Vector PNGs for various relational symbols.