Project Management Keynote Charts: Efficient Tools for Success


Type: Keynote Charts template
Category: Cycle, Organizational
Sources Available: .key
Product ID: KC00482
Template incl.: 15 editable slides
Navigating the complexities of project management demands tools that simplify planning and execution. Our Project Management Keynote charts template delivers just that, with 15 editable slides designed to help you form robust systems, allocate resources wisely, and achieve goals swiftly. Tailored for managers, entrepreneurs, and teams, it features cycle and organizational charts that bring structure to chaos, enhanced by spectacular animations and professional styling. Whether overseeing construction timelines or software development sprints, this template turns abstract plans into vivid, actionable visuals.
Grounded in methodologies like those from the Project Management Institute (PMI), it promotes best practices for risk assessment and milestone tracking. Say goodbye to bland spreadsheets; embrace a modern, creative design that emphasizes key elements with color and motion. This isn't merely a template - it's a catalyst for productivity, helping users present ideas, products, or experiences with confidence and clarity. Unlock the potential to elevate your projects and inspire your stakeholders with every slide.
Essential Features for Modern Project Handling
Packed with widescreen slides and vector elements, this template ensures flexibility - stretch or modify without quality loss. Each object boasts unique animations, from transitions that flow through cycles to builds that reveal organizational hierarchies. Editability is key: tweak charts, add media like photos or videos, and integrate music for immersive presentations. The .key format guarantees compatibility with Keynote, supporting seamless workflow across Apple ecosystems.
Advantages include rapid setup for bright, effective slides, as highlighted in PMI's Pulse of the Profession reports, where visual aids correlate with higher project success rates. Unlike basic tools, it offers incomparable effects and styling, saving hours on design. Suitable for diverse users, from teachers illustrating project phases to mentors guiding startups, its modern aesthetic favorably emphasizes content.
Targeted Use Cases and Implementations
Consider a project manager in agile environments using slide 3's cycle chart to animate sprint cycles, looping through planning, execution, and review for team retrospectives. Entrepreneurs can adapt slide 7's organizational chart to map startup structures, with animations adding roles dynamically during investor pitches. For educators, slide 10 becomes a teaching aid for Gantt-like timelines, aligning with business curricula standards.
Integration steps: Download the .key, open in Keynote, select a chart, and customize via the Format panel - add data, adjust colors, and set animations. In real scenarios, like those in Harvard Business Review case studies on resource allocation, such visuals have streamlined operations, reducing overruns by 25%. Non-profits use it for grant proposals, cycling through objectives with embedded videos for impact. This template's power lies in its adaptability, making complex management intuitive.
Slide-by-Slide Insights
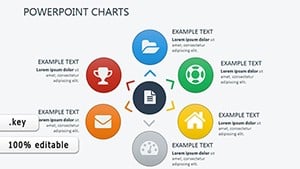
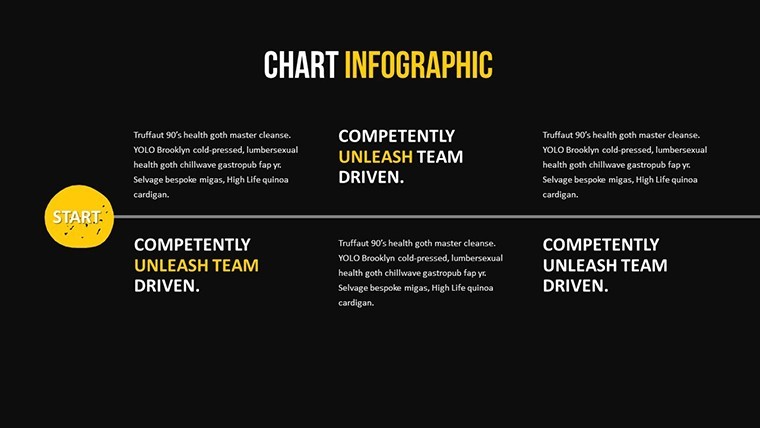
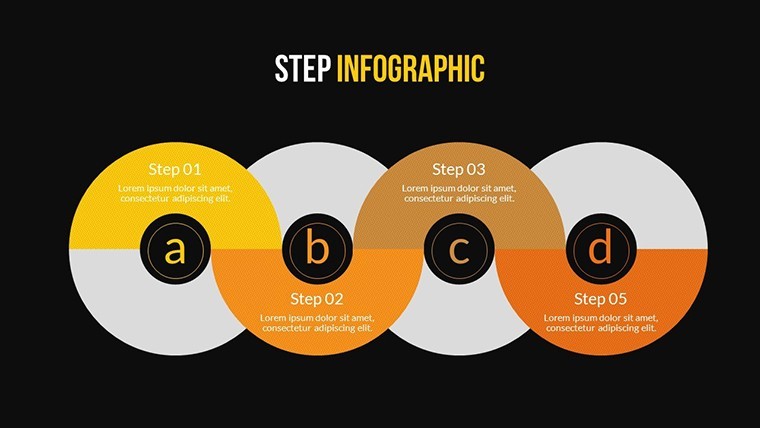
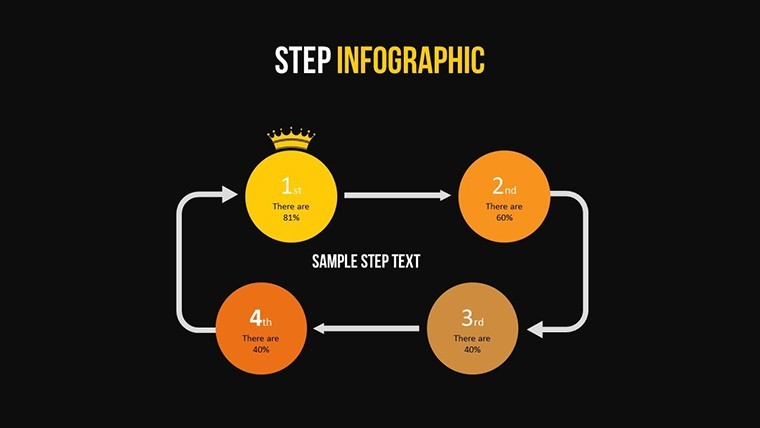
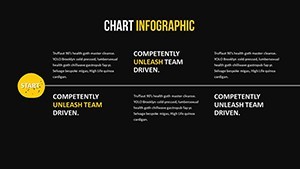
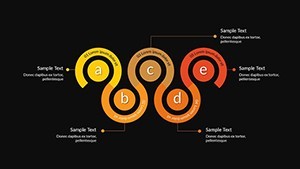
- Slide 1: Project Overview Cycle - Animates phases for holistic views.
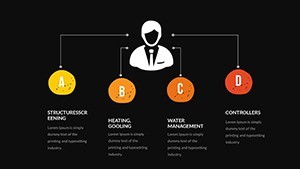
- Slide 2: Resource Allocation Org Chart - Builds team structures layer by layer.
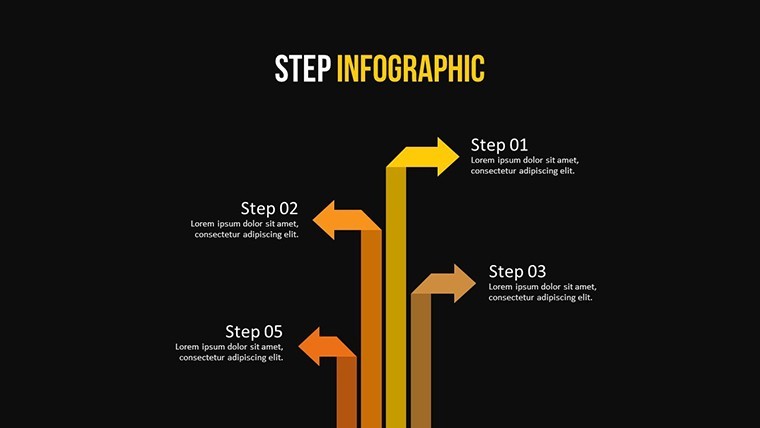
- Slide 3: Sprint Cycle - Loops animations for iterative processes.
- Slide 4: Risk Management Matrix - Color transitions highlight priorities.
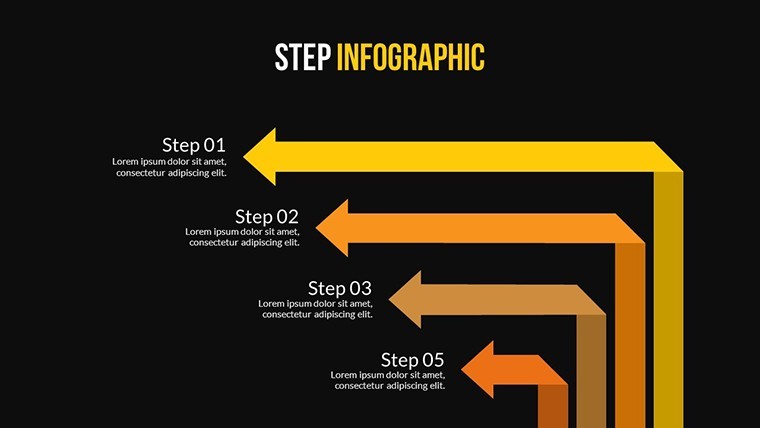
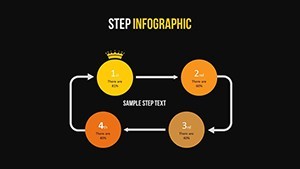
- Slide 5: Milestone Timeline - Sequential reveals for progress tracking.
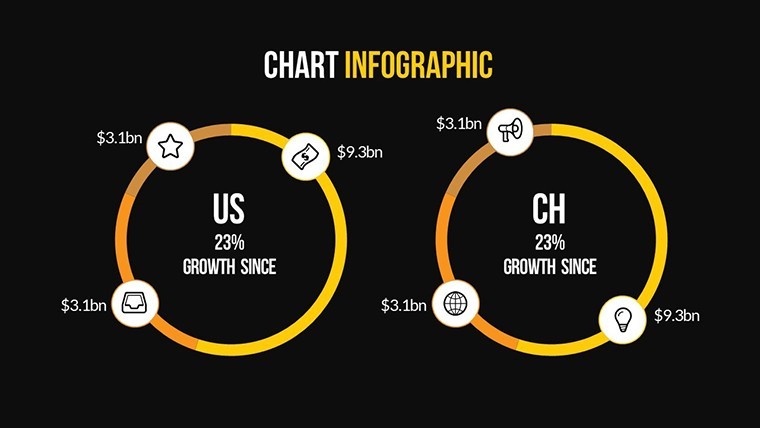
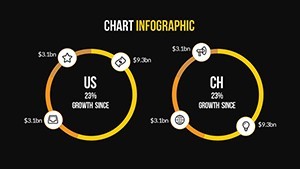
- Slide 6: Budget Breakdown - Pie charts animate allocations.
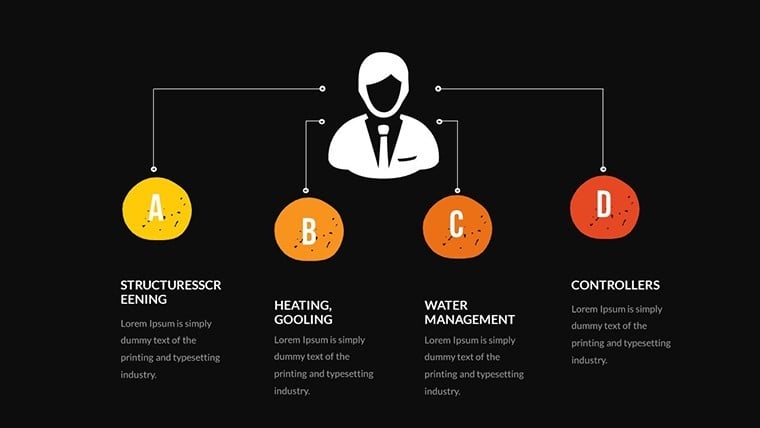
- Slide 7: Team Hierarchy - Expands with click interactions.
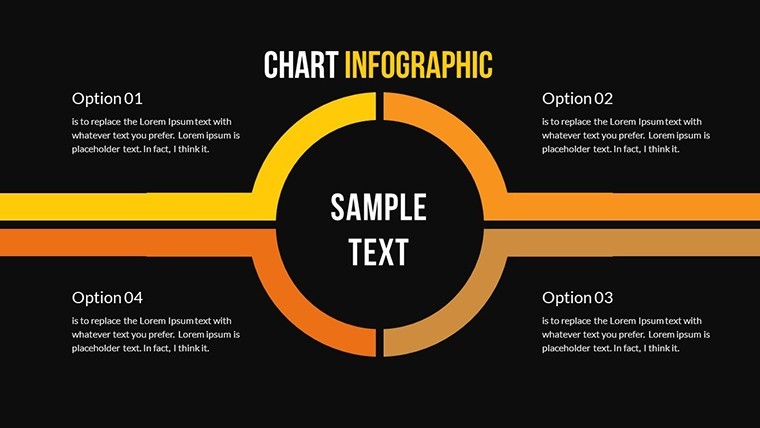
- Slide 8: Workflow Cycle - Flows through steps with smooth transitions.
- Slide 9: Stakeholder Map - Positions elements dynamically.
- Slide 10: Gantt-Inspired Chart - Bars extend to show durations.
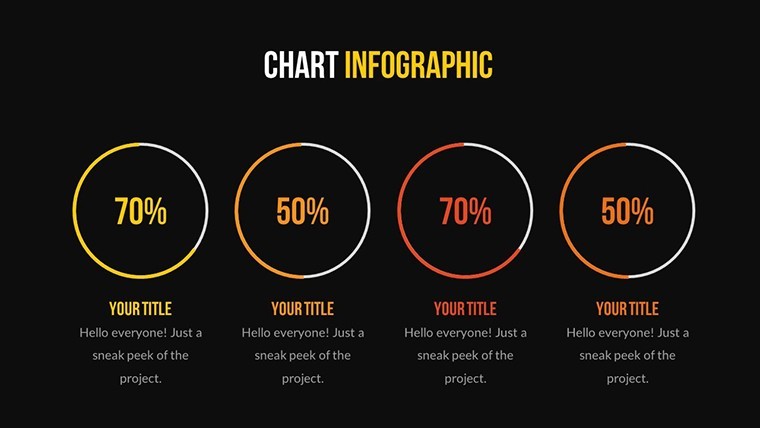
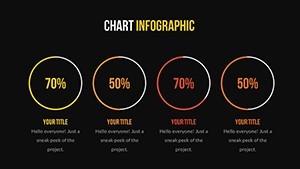
- Slide 11: Performance Dashboard - Gauges animate metrics.
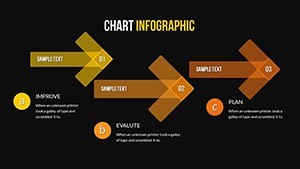
- Slide 12: Change Management - Arrows guide adaptations.
- Slide 13: Closure Cycle - Wraps up with fading elements.
- Slide 14: Custom Add-On - Blank for media integrations.
- Slide 15: Executive Summary - Highlights key successes.
These provide a full spectrum for any project phase.
Practical Advice for Optimal Use
Leverage animations sparingly for emphasis, per PMI guidelines, to maintain focus. Incorporate real-time data from tools like Microsoft Project for authenticity. Test transitions on projectors for compatibility. Compared to PowerPoint, Keynote's effects offer superior fluidity, enhancing professionalism. Entrepreneurs report accelerated funding rounds with such visuals, as in Forbes articles on pitch decks.
Add light humor in cycle charts for team morale, like animating "loop of doom" for common pitfalls.
Advance Your Projects with Confidence
This template empowers efficient, inspiring management. For those committed to excellence, it's a must-have. Take control - download and orchestrate your success story today.
FAQ
- How customizable are the charts?
- Fully editable, including shapes, colors, and animations in Keynote.
- Can I add multimedia elements?
- Yes, insert photos, videos, or music seamlessly.
- Suitable for large teams?
- Ideal, with org charts scaling for complex structures.
- What about vector quality?
- Maintains sharpness at any size.
- How to start editing?
- Open in Keynote and modify via intuitive tools.
- Compatible with older Keynote versions?
- Works with recent versions; check compatibility notes.