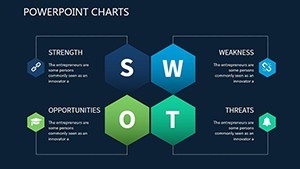
Implementation System Keynote Charts: Blueprint Your Enterprise Success


Type: Keynote Charts template
Category: Relationship
Sources Available: .key
Product ID: KC00425
Template incl.: 14 editable slides
In the fast-paced arena of enterprise management, launching a new system isn't just technical - it's a symphony of coordination, timelines, and team alignment. Enter our Implementation System Keynote Charts template: 14 meticulously designed, editable slides that demystify the rollout process for Keynote power users. Tailored for IT directors, operations leads, and system integrators, this toolkit transforms the traditional methodology - from needs assessment to go-live and beyond - into visuals that command attention and clarity.
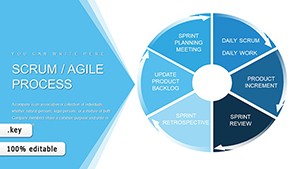
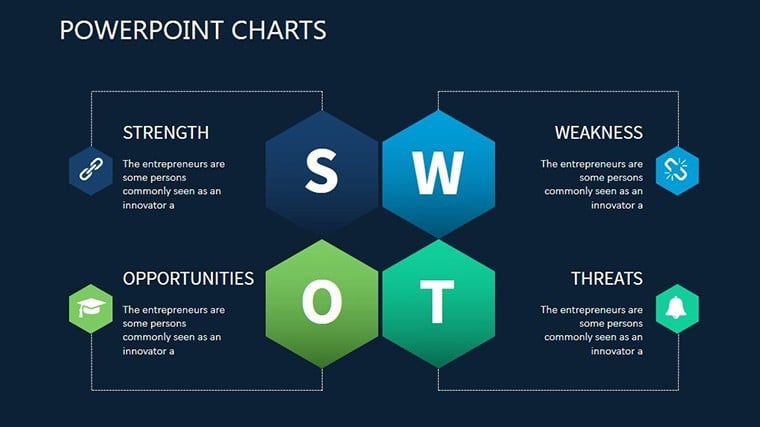
Forget clunky spreadsheets or disjointed emails; these charts provide a unified narrative. Drawing from methodologies like ITIL and COBIT, each slide captures a phase with precision: think swimlane diagrams for cross-department flows or progress bars that pulse with real-time updates. Customize effortlessly to reflect your org's structure - swap enterprise icons for cloud symbols in a SaaS migration or add custom milestones for ERP upgrades. The payoff? Shorter implementation cycles, fewer bottlenecks, and presentations that turn executives into allies rather than skeptics.
Consider a mid-sized manufacturing firm in Chicago: Using these charts, their ops team visualized a supply chain software deployment, slashing deployment time by 30% and earning kudos from the C-suite. For consultants, it's a differentiator in RFPs; educators use it to simulate real-world projects in MIS courses. With widescreen 16:9 formatting and high-res vectors, your slides scale from boardrooms to webinars seamlessly.
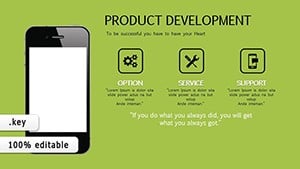
Discover the Standout Features: Precision Engineered for Rollouts
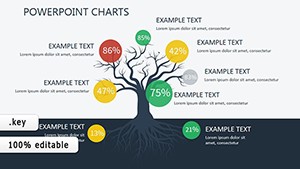
These aren't off-the-shelf graphs; they're specialized for implementation's nuances. Slide 0 kicks off with a high-level overview pyramid, layering stages from planning to evaluation. Dive into details with 13 more, each optimized for Keynote's native tools.
- Needs Assessment Funnel: Narrow down requirements with a tapered diagram - input stakeholder inputs to highlight priorities.
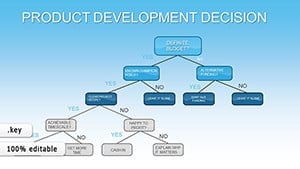
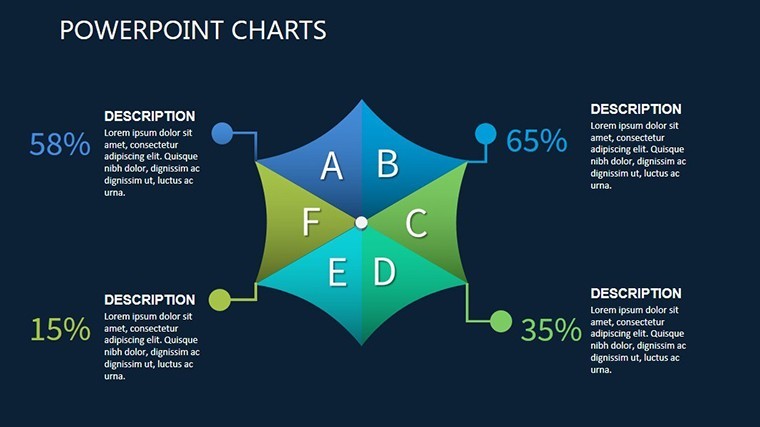
- Swimlane Process Map: Horizontal lanes for roles (IT, finance, users), arrows showing handoffs - perfect for dependency spotting.
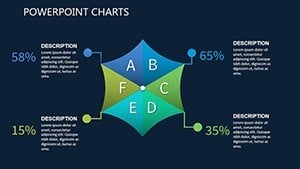
- Risk Heatmap: Color-graded grid for threats vs. likelihood, with mitigation callouts that expand on click.
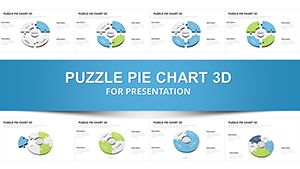
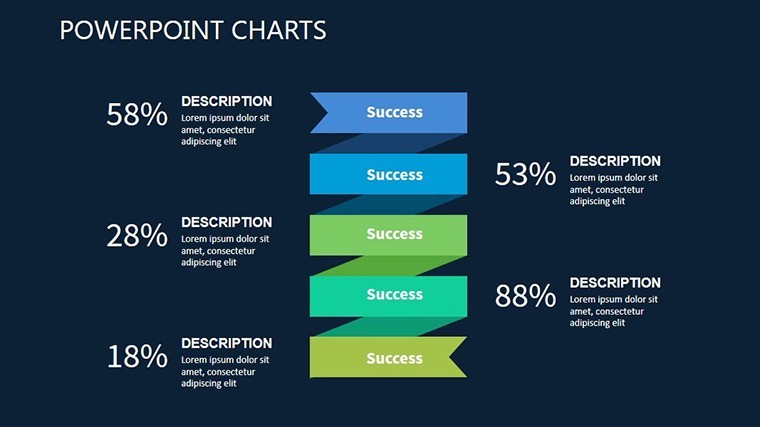
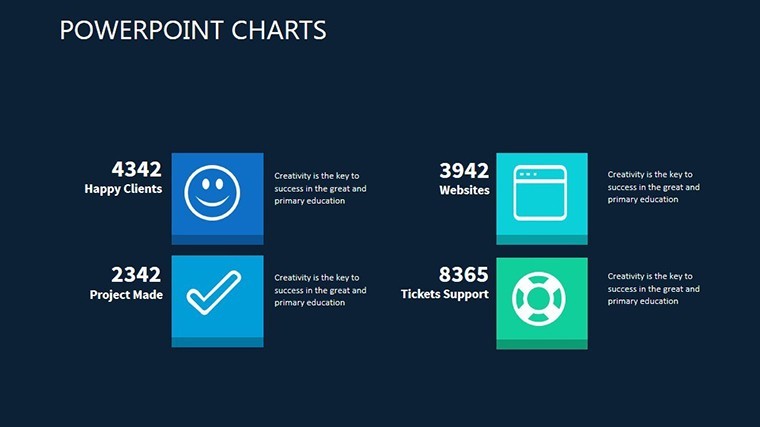
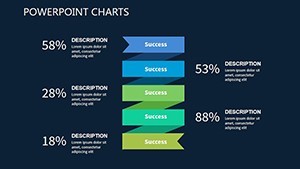
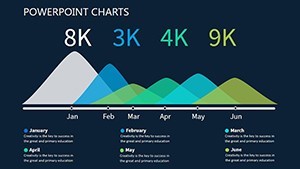
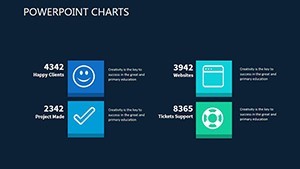
- Go-Live Dashboard: Multi-metric gauges tracking uptime, training completion, and budget - embed formulas for live data.
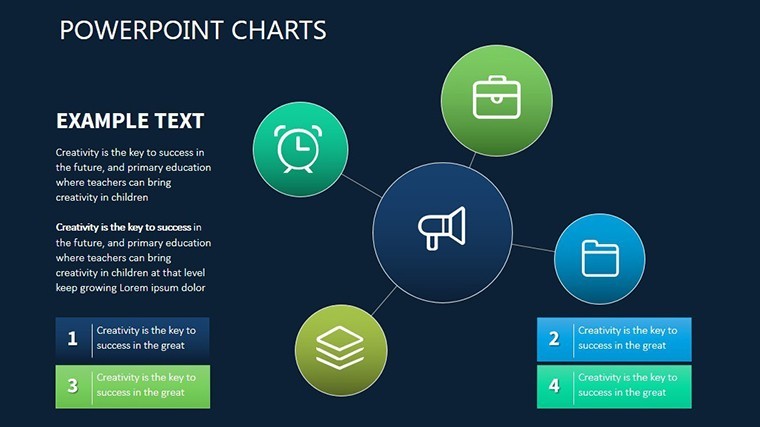
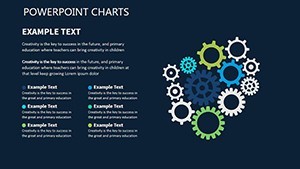
Versus standard Keynote templates, ours integrate 30+ editable icons (gears, servers, checklists) and smooth transitions, cutting design time by half. Animate phases sequentially to build suspense, or static-export for reports.
Step-by-Step Integration: Weaving into Your Workflow
- Scope the Project: Populate the overview slide with project charters; link to Google Docs for dynamic pulls.
- Map Dependencies: Customize swimlanes during stand-ups - share via Keynote Live for instant team input.
- Mitigate Risks: Update the heatmap post-audits; use conditional formatting for auto-red flags.
- Review and Scale: Post-go-live, archive metrics in the dashboard for lessons-learned sessions.
Expert hack: Pair with Jira exports for timeline auto-syncs, turning static slides into living documents. A dash of wit? Label bottlenecks as "Traffic Jams Ahead" to keep teams engaged without jargon overload.
Use Cases That Drive Results: Implementation in Action
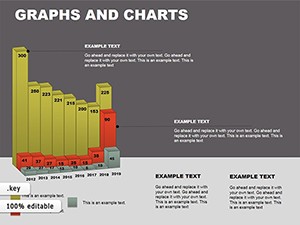
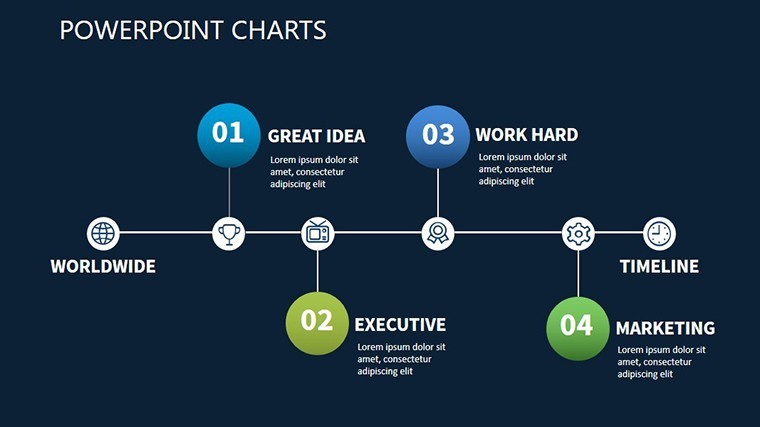
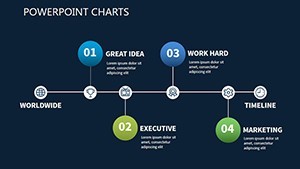
IT leads deploying CRM systems shine here: The phased timeline slide sequences data migration to user training, preempting downtime horrors. Operations managers in logistics map warehouse automations, visualizing ROI curves that sway budget approvals.
For academic simulations, professors at tech institutes use these to role-play ERP failures-turned-wins, enriching curricula with practical visuals. Consultants? Craft client-specific variants, like healthcare HIPAA compliance flows, to close deals faster.
Why wait for delays? Secure this template now and orchestrate flawless implementations.
Pro Tips for Flawless Execution
Balance detail with brevity: Limit nodes to 7 per diagram, per Nielsen's usability norms. Test animations on older Macs to ensure compatibility. For global teams, add multilingual placeholders - Keynote's text engine handles it smoothly.
Backed by Gartner insights on 50% failure rates in implementations, this template equips you to beat the odds. Adapt for agile sprints or waterfall models, ensuring every phase pops.
Empower your rollouts - Download today and map your path to efficiency in minutes.
Insider Stories: How Teams Transformed with These Charts
"From chaos to checklist mastery," raves a sysadmin from a retail chain. Its modularity supports iterative updates, ideal for agile environments.
Link to Slack bots for metric feeds, or export to Figma for designer handoffs. The true worth? Streamlined comms that save thousands in rework.
Launch with confidence - grab your charts and implement like a pro today.
Frequently Asked Questions
Are the charts compatible with other software?
Primarily for Keynote (.key), but export seamlessly to PowerPoint or Google Slides.
How many customization options are there?
Unlimited - edit shapes, colors, and data via Keynote's intuitive tools.
Is it suitable for small business implementations?
Yes, scale down for SMBs or expand for enterprises with ease.
Does it include risk management elements?
Definitely; dedicated slides for heatmaps and contingency planning.
Can I add my own data sources?
Absolutely - import from Excel or CSV for dynamic updates.
What's the slide resolution?
High-res 16:9 widescreen, optimized for Retina displays.