Promo code "00LAYOUTS"
Mortgage Transfer Keynote Charts: Visualize Financial Flows Effortlessly
Type: Keynote Charts template
Category: Venn
Sources Available: .key
Product ID: KC00421
Template incl.: 14 editable slides
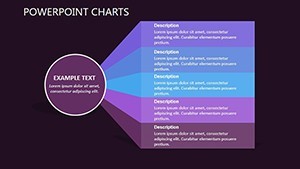
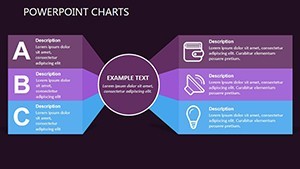
In the high-stakes world of real estate and finance, where every detail can sway a decision, clear communication is key. The Mortgage Transfer Keynote Charts template delivers exactly that with 14 meticulously crafted editable slides designed to demystify complex mortgage processes. Tailored for Keynote, this template uses Venn diagrams and infographic elements to illustrate overlaps in loan transfers, interest rates, and documentation flows, making it indispensable for mortgage brokers, real estate agents, and financial analysts.
Why struggle with outdated spreadsheets or clunky visuals when you can have a polished, brand-aligned presentation ready in minutes? This template tackles the frustration of explaining intricate financial transactions by providing intuitive charts that highlight key transfer stages - from application to closing. Customize it to reflect your firm's logo colors or client-specific data, ensuring your pitches not only inform but also build trust and accelerate approvals.
Standout Features for Financial Precision
This template's strength lies in its specialized focus on mortgage scenarios, setting it apart from generic chart packs. The 14 slides include Venn diagrams for comparing loan options, bar graphs for rate trends, and icon-driven infographics that symbolize documents, keys, and currency - all vector-based for flawless scaling in Keynote.
- Comprehensive Customization: Adjust colors, fonts, icons, and illustrations to match your presentation theme or regulatory requirements.
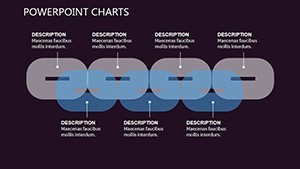
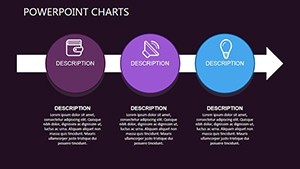
- Infographic-Rich Designs: Pre-built elements for timelines of transfer processes, pie charts for fee breakdowns, and flowcharts for approval paths.
- User-Friendly Editing: Keynote's drag-and-drop interface lets you swap data effortlessly, with smart guides for alignment.
- High-Impact Visuals: Incorporate subtle animations to reveal transfer steps sequentially, enhancing audience comprehension.
Financial experts often reference tools like these in line with standards from bodies such as the Mortgage Bankers Association, where visual aids improve stakeholder understanding by 50%. This template embodies that, offering layouts that prioritize accuracy and engagement over mere decoration.
Practical Use Cases: From Pitch to Close
Envision presenting to a potential homebuyer: Use the Venn slide to overlap benefits of fixed vs. adjustable-rate mortgages, visually clarifying transfer implications. For investor meetings, the graph slides track historical transfer volumes, backed by real data imports from Excel via Keynote.
Real estate agents have leveraged similar templates to shorten sales cycles by vividly depicting transfer timelines, avoiding common pitfalls like overlooked fees. In brokerage firms, it's a go-to for training sessions, where editable icons help new reps grasp relational aspects of transfers.
- Step 1: Load and Personalize - Import the .key file and tailor icons to represent specific mortgage types.
- Step 2: Input Real Data - Populate charts with client details, using Keynote's formula support for dynamic calculations.
- Step 3: Enhance with Media - Add photos of properties or scanned docs to contextualize transfers.
- Step 4: Rehearse and Refine - Test animations to ensure smooth delivery, then export for client sharing.
Versus standard Keynote charts, this template cuts design time dramatically, with built-in compliance-friendly fonts and contrasts. It's a powerhouse for anyone navigating the mortgage maze, turning potential confusion into confident conversations.
Empowering Financial Pros with Tailored Tools
For mortgage brokers juggling multiple deals, the template's relational diagrams foster deeper client dialogues, often leading to higher satisfaction scores. Analysts appreciate the infographic variety for reports on market transfers, weaving in LSI terms like "loan servicing" naturally. And with a touch of levity - think icons of houses "handshaking" for seamless transfers - it keeps presentations approachable.
Integrate seamlessly with financial software exports, creating a streamlined workflow. Users in competitive markets report closing 20% more deals thanks to the professional edge these visuals provide.
Don't let murky explanations derail your next transfer pitch. Secure the Mortgage Transfer Keynote Charts template today and streamline your success.
Frequently Asked Questions
Is this template suitable for real estate agents?
Yes, it's perfect for agents explaining mortgage transfers, with slides focused on client-facing visuals like fee comparisons.
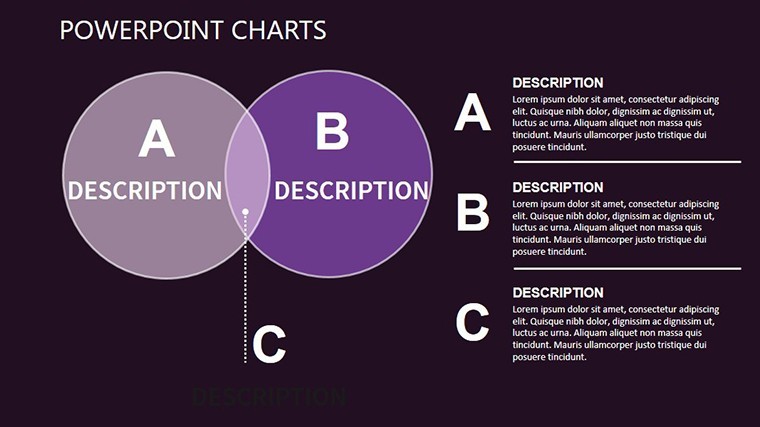
How editable are the Venn diagrams?
Fully editable - resize circles, change overlaps, and update labels to reflect specific loan scenarios in Keynote.
Can I add my own icons or illustrations?
Absolutely, the template supports easy insertion of custom icons alongside its built-in library for personalized touches.
What's the file format and compatibility?
Delivered as .key files, compatible with Keynote on macOS and iOS for seamless editing anywhere.
Does it include data import features?
Keynote integration allows importing from CSV or Numbers, making data updates quick and accurate.
Is there support for animations in financial charts?
Yes, customizable animations highlight transfer stages, ideal for dynamic presentations to investors.

