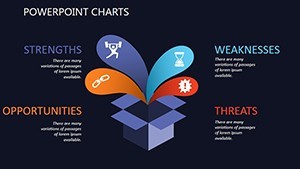
Dynamic Customer Service Skills Charts: Charting Paths to Excellence


Type: Keynote Charts template
Category: Relationship, Business Models
Sources Available: .key
Slide size: widescreen (16:9)
Product ID: KC00383
Template incl.: 12 editable slides
In the intricate dance of modern customer interactions, where every touchpoint tells a story, having the right visuals can mean the difference between a forgotten report and a roadmap to loyalty. Enter our Customer Service Skills Keynote Charts template: 12 meticulously designed, editable slides that empower business analysts, CRM specialists, and service innovators to map out strategies for gathering customer intelligence across their entire lifecycle. Inspired by frameworks from HubSpot's customer journey models, this template bridges advanced management practices with IT tools, turning raw data into strategic gold.
Whether you're dissecting feedback loops or forecasting engagement trends, these charts provide a canvas for your expertise. With a clean, modular layout in Keynote's native format, you'll spend less time formatting and more time deriving actionable insights. Envision a Sankey diagram flowing from acquisition to advocacy, or a cohort analysis grid revealing retention patterns - each slide is a building block for narratives that drive decisions, much like how Salesforce users leverage similar visuals to optimize pipelines.
Core Features: Tools for Lifecycle Mastery
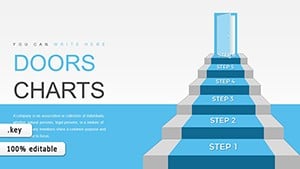
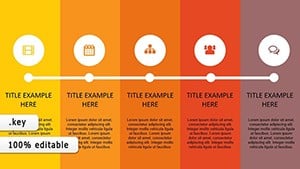
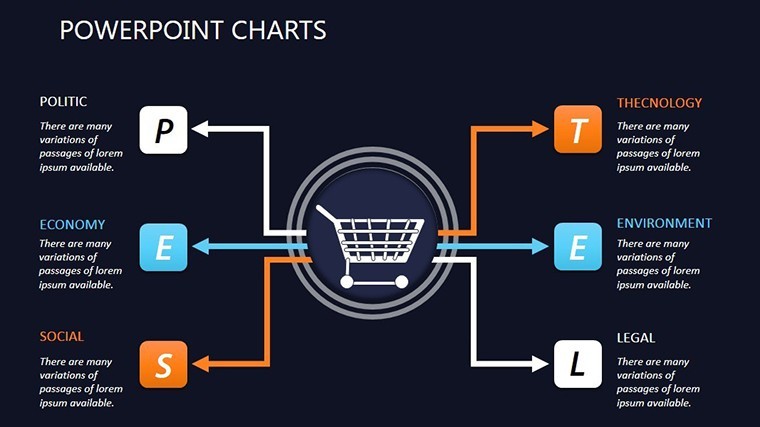
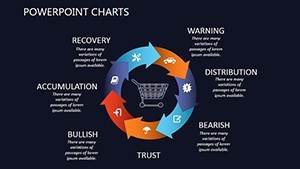
This template shines in its depth, offering visualizations that mirror the ebb and flow of customer relationships. Slide 1 introduces a holistic lifecycle wheel, segmenting stages from awareness to delight with adjustable segments for your metrics. It's not just pretty - it's precise, with formula-embedded elements that recalculate percentages on the fly.
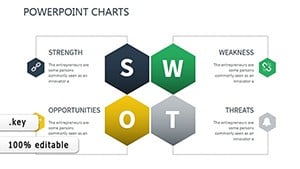
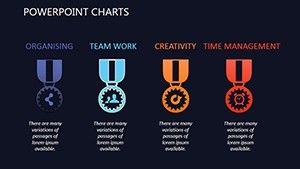
- Advanced Chart Variety: Sankey flows for pathway analysis, heatmaps for engagement intensity, and radar charts evaluating skill gaps in service teams.
- IT-Integrated Design: Pre-linked placeholders for API pulls from tools like Intercom, ensuring your data stays fresh without manual updates.
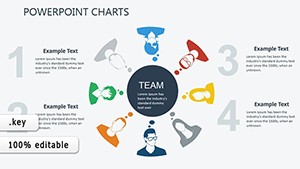
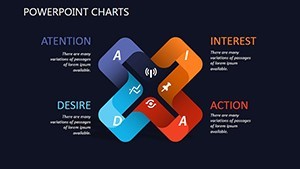
- Modular Aesthetics: Neutral grays accented by lifecycle blues, with scalable icons of gears, data streams, and user avatars for thematic relevance.
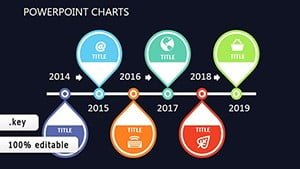
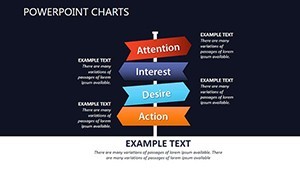
- Animation Sequences: Phased reveals that simulate progression, ideal for walkthroughs in strategy sessions.
Dive deeper into Slide 5's dependency graph, which illustrates how IT investments correlate with service outcomes - a nod to McKinsey's digital transformation insights, where such mappings have accelerated ROI by up to 30%.
Effortless Editing for Busy Strategists
Customization here is intuitive: Select a cohort table on Slide 7, input your segmented user data via drag-and-drop, and let Keynote's smart guides align everything perfectly. For a touch of personalization, swap icon sets to match your company's digital motifs - think circuit patterns for tech-savvy firms. Our design team recommends starting with the master slide to enforce brand fonts, ensuring every export to PDF or video maintains polish.
Strategic Use Cases: From Data Collection to Decision-Making
Picture a SaaS startup using Slide 3's waterfall chart to break down acquisition costs versus lifetime value, revealing untapped upsell opportunities in the nurture phase. Or a retail chain employing Slide 9's bubble plot to size customer segments by loyalty and spend, informing targeted campaigns that echo Deloitte's findings on personalized service boosting revenues.
For IT-service hybrids, Slide 4's network diagram connects feedback channels to resolution engines, highlighting automation wins. In executive briefings, transform Slide 11 into a scenario planner with branching paths, simulating 'what-if' impacts of skill training programs.
- Lifecycle Audits: Employ progression bars to track stage conversions, identifying leaks like post-purchase drop-offs.
- Skill Development Workshops: Radar assessments to benchmark team competencies against industry averages from Forrester.
- Tech Stack Reviews: Matrix charts comparing tool efficacy in data capture, guiding upgrades.
A CRM consultant we collaborated with adapted our template for a client audit, uncovering silos in data flow that streamlined operations by 25% - proof that these charts aren't mere graphics, but levers for efficiency.
Superior to Standard Templates
Unlike Keynote's default libraries, which lack lifecycle specificity, ours weaves in relational threads - every chart interconnects, fostering a cohesive deck. Unlimited revisions mean it grows with your strategies, from nascent pilots to scaled implementations.
Workflow Hacks and Expert Advice
Integrate seamlessly by syncing with Google Sheets for collaborative edits, then polish animations to pace your pitch. For virtual demos, use Keynote's presenter notes to embed talking points tied to each visual. Insider tip: Vary opacity on overlay elements in multi-layer charts like Slide 6's to guide viewer focus, enhancing comprehension without clutter.
The essence? These slides democratize data storytelling, making sophisticated analysis accessible to all levels. Secure your Customer Service Skills Keynote Charts now and architect journeys that retain and delight. Check out related relationship templates for deeper dives.
Frequently Asked Questions
How does this template support customer data collection strategies?
It features dedicated flows and grids for lifecycle stages, integrating IT touchpoints to visualize comprehensive intel gathering.
What's the compatibility with other presentation software?
Native to Keynote, with easy exports to PowerPoint; animations preserve best in Apple environments.
Can I adapt charts for non-service industries?
Yes, the modular design suits any relational modeling, like sales funnels or project timelines.
Are there built-in formulas for dynamic data?
Indeed, many charts include auto-calculating functions for percentages and trends.
What's the file size and download process?
Lightweight .key file, instant access post-purchase with secure links.
Does it include usage rights for commercial presentations?
Fully licensed for business use, with no attribution required.