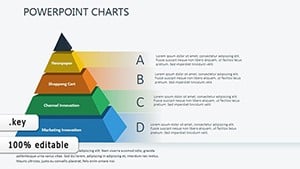
Pyramid Chart Keynote Template for Economic Analysis


Type: Keynote Charts template
Category: Pyramids
Sources Available: .key
Product ID: KC00344
Template incl.: 12 editable slides
As a consultant who`s spent countless hours breaking down economic models for executive teams, I know how tricky it is to make abstract concepts like supply chains or market shifts feel tangible. That`s where this Pyramid Chart Keynote Template steps in. Designed specifically for economic analysis, it turns those layered ideas into sharp, intuitive visuals that stick with your audience. Whether you`re mapping out consumer needs in a volatile market or tracing how policy changes ripple through industries, these slides let you build your story layer by layer, starting from the base realities and climbing to bold innovations.
I`ve used templates like this in high-stakes boardroom sessions for clients in finance and policy, where dim lighting and dense data are the norm. The dark theme here isn`t just stylish - it`s practical, cutting through the haze of late-night reviews or conference hall spotlights. You get 12 fully editable slides, all vector-based, so resizing or tweaking colors won`t muddy the details. Import your data from Excel, and watch the pyramids auto-adjust, keeping everything precise without the hassle of manual redraws.
Why Pyramid Structures Dominate Economic Presentations
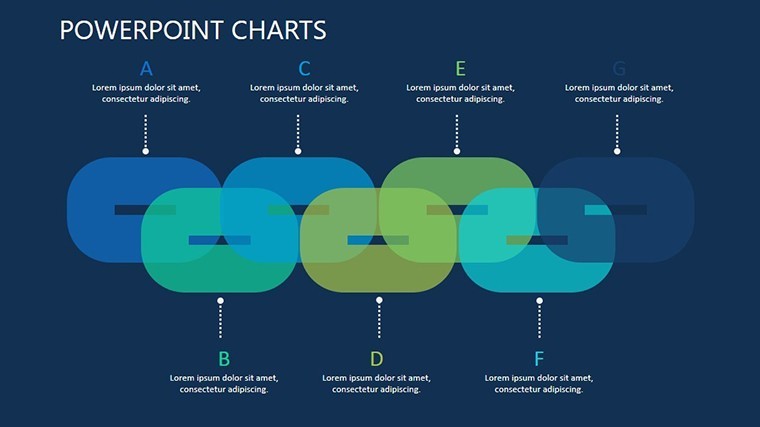
Think about it: economics is all about hierarchies. At the bottom, you`ve got foundational elements like resource access or basic market demands. Higher up, those feed into adaptive strategies, and at the peak, game-changing disruptions emerge. Traditional bar graphs or pie charts flatten that depth - they treat everything as equals when it`s not. Pyramids, on the other hand, force a natural flow, guiding eyes upward as your narrative unfolds.
In my work with project managers forecasting growth trajectories, I`ve seen how a well-structured pyramid slide can shift a skeptical team`s buy-in. Suddenly, they`re not just hearing numbers; they`re seeing the climb from stability to opportunity. This template captures that essence with clean, high-contrast layers in deep charcoals and midnight blues. Subtle accents in silver or indigo draw focus to key tiers, making it easy to highlight, say, how regulatory hurdles in the mid-layer stifle innovation at the top.
Walk Through the Core Slides: From Base to Breakthrough
Start with the title slide - a towering pyramid silhouette against a velvet-dark backdrop. It sets a tone of depth and discovery right away, with space for your session title and a subtle tagline like "Mapping the Climb to Economic Resilience." No clutter, just enough intrigue to pull viewers in.
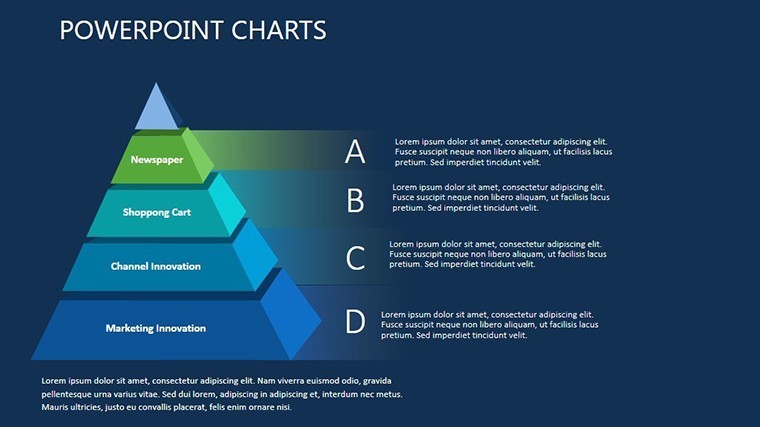
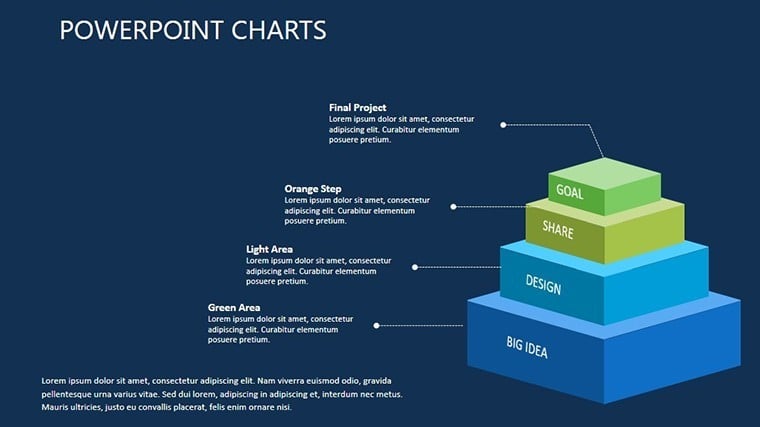
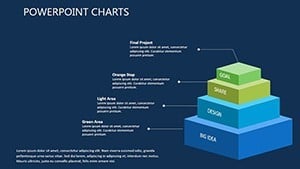
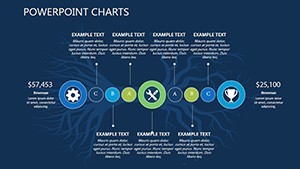
Move to the foundational layer slide, around slide two or three. Here, the pyramid`s broad base fills the screen, segmented into blocks for essentials: labor markets, capital flows, consumer behaviors. Each block is a editable text box with room for bullet points or mini-charts. I`ve dropped in simple icons - like stylized gears for infrastructure or waves for demand fluctuations - and they scale perfectly, adding a human touch without overwhelming the layout.
By slide four, you`re into the connective tissue: curved arrows linking your base to the middle tiers. These aren`t stiff lines; they`re fluid paths that suggest momentum, ideal for showing how grassroots innovations bubble up to influence broader systems. Picture animating this in Keynote - the base fades in first, then arrows pulse gently, revealing mid-level adaptations like tech integrations or supply chain pivots. It`s that sequencing that turns a static slide into a dynamic reveal, keeping even the most data-weary audience locked in.
The heart of the deck hits around slides five through eight, where layered pyramids dissect specific scenarios. One standout has the structure divided into grayscale bases transitioning to vibrant apexes, perfect for economic evolution stories. Layer in historical parallels - base needs during a recession, mid-shifts via policy tweaks, top-tier recoveries through entrepreneurial sparks. Another slide flips it to a multi-pyramid view, side by side, comparing pre- and post-event landscapes. It`s gold for educators breaking down case studies or marketers pitching adaptive campaigns.
Toward the end, slides nine and ten offer derivative builds: glow effects on pivotal elements to spotlight outliers, like a single innovator figure amid market waves. These are your "aha" moments, where you zoom in on what breaks the mold. The final slides wrap with a synthesis pyramid, pulling all threads into a unified peak - room for calls to action, next steps, or Q&A prompts. Everything ties back seamlessly, leaving your audience with a clear path forward.
Tailoring It for Your Real-World Challenges
For founders pitching to investors, this template shines in framing your business model as an economic pyramid: base as market validation, middle as scalable ops, top as exponential growth. I`ve customized one just like it for a startup client, swapping in their revenue projections - the dark scheme made their bold forecasts pop against competitor blandness.
Project managers handling timelines will love the flow diagrams; they double as Gantt-lite visuals when you layer in dates along the ascent. Consultants in strategy? Use the multi-pyramid for SWOT deep dives, subordinating threats at the base to strengths climbing high. And for educators or trainers, the accessibility tweaks - WCAG-compliant contrasts - ensure your economic lessons land equally well in virtual Zooms or packed lecture halls.
Customization is straightforward: Keynote-native animations let you sequence builds at your pace, and the 16:9 ratio exports cleanly to PowerPoint if your team mixes tools. Tweak opacities for emphasis, or lighten the palette for daytime demos. It`s built for speed - I`ve prepped full decks in under an hour, focusing on story over setup.
The Edge You Get in Dim-Lit Strategy Sessions
Presenting economics isn`t about dazzling with flash; it`s about clarity in complexity. This template delivers that edge, reducing the mental load on your viewers so they engage with ideas, not eye strain. In my experience guiding teams through downturn analyses, slides like these have sparked more "let`s do this" conversations than any spreadsheet ever could.
Open it in Keynote and make it yours in minutes - drag in your data, align with your brand hues, and rehearse the climb. You`ll walk away with a tool that doesn`t just inform but inspires action, turning economic puzzles into persuasive pathways.
Frequently Asked Questions
What makes this pyramid template ideal for economic presentations?
It structures data hierarchically, mirroring how economic forces build from basics to breakthroughs, with editable layers for precise storytelling.
Can I use this in PowerPoint instead of Keynote?
Yes, it converts smoothly to PowerPoint, retaining most edits and dark effects - just a quick check on animations.
How many slides come with the template?
You get 12 fully customizable slides, covering intros, layered builds, comparisons, and closers.
Is it easy to add my own data?
Absolutely - link to Excel for auto-updating charts, or paste directly into text fields for quick tweaks.
Does the dark theme work for all lighting conditions?
It`s optimized for low light but versatile; adjust accents to brighten for any setup.
Who benefits most from this economic pyramid template?
Economists, strategists, founders, and educators who need to visualize layered market dynamics clearly.