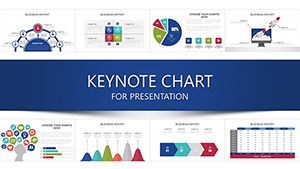
Training Infographic Keynote Charts - Instant Download | ImagineLayout


Type: Keynote Charts template
Category: Organizational
Sources Available: .key
Product ID: KC00342
Template incl.: 20 editable slides
Package Contents
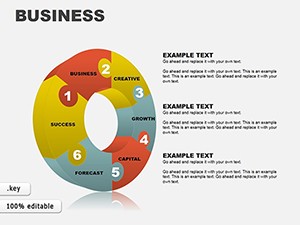
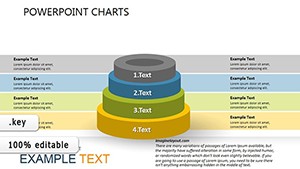
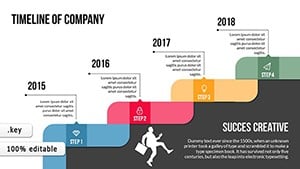
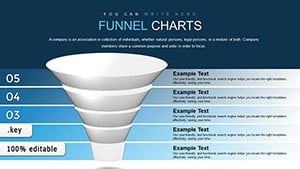
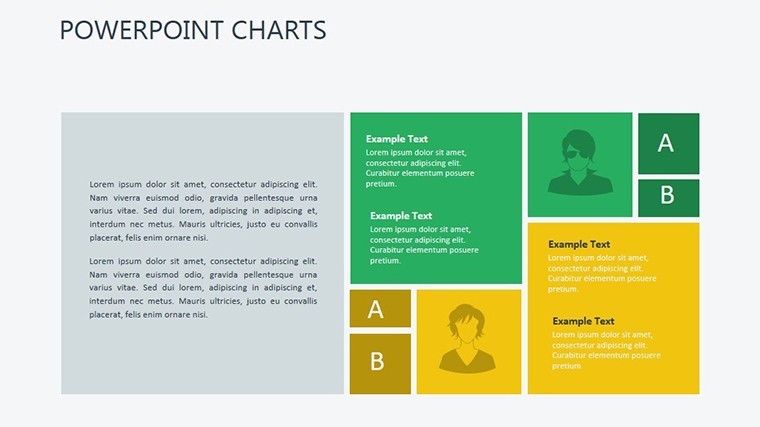
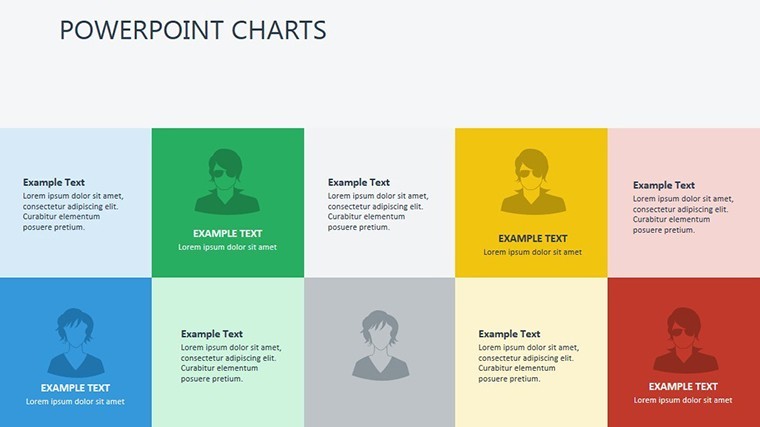
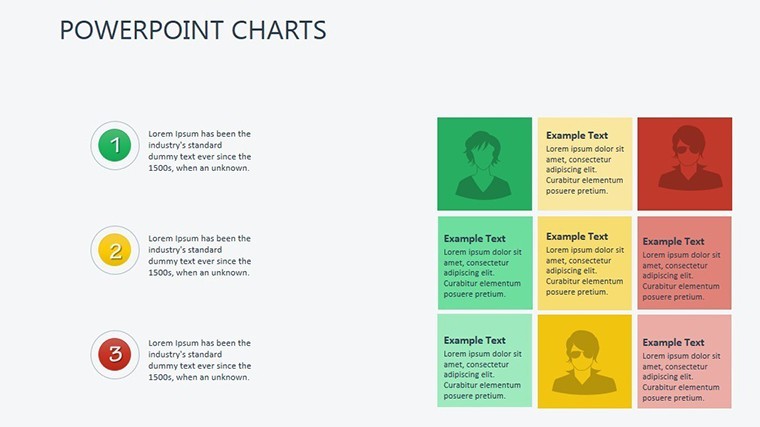
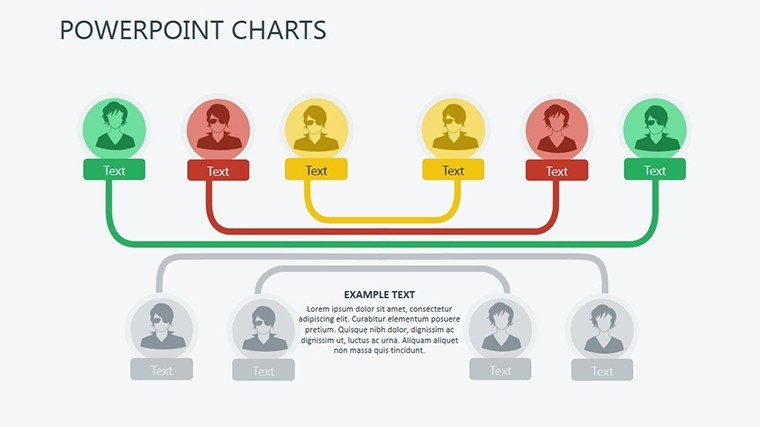
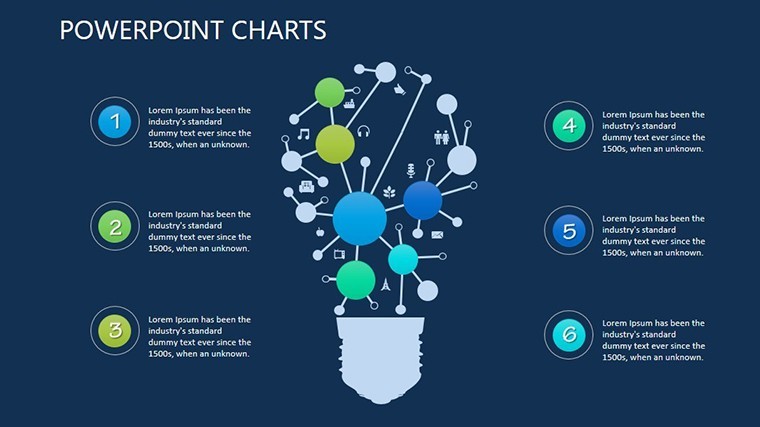
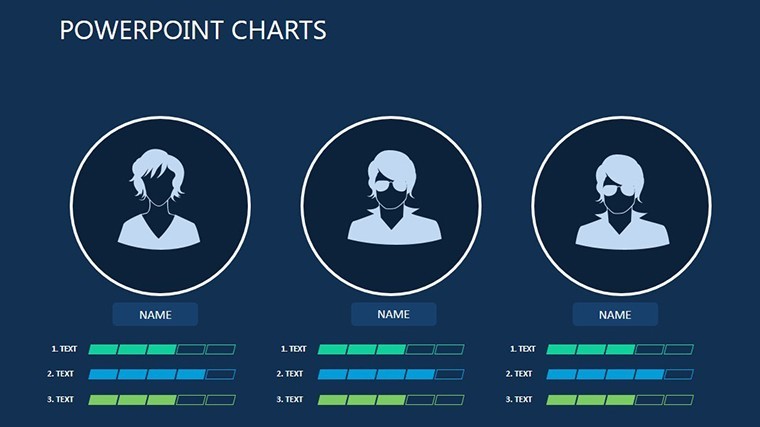
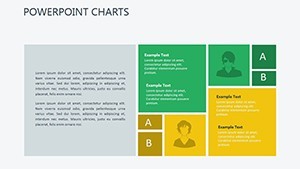
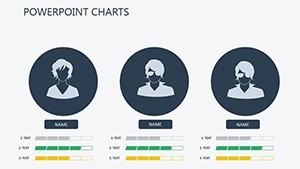
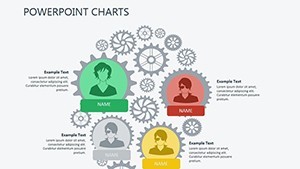
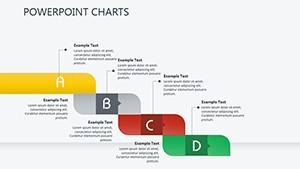
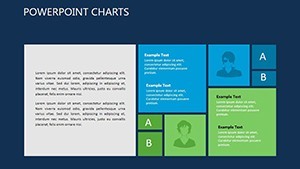
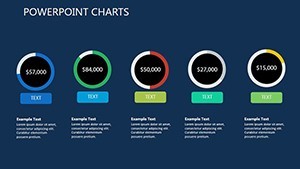
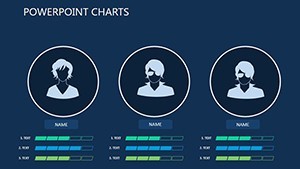
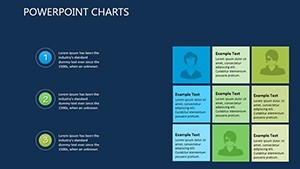
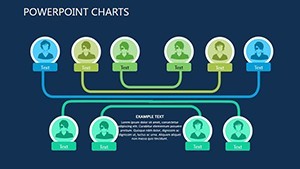
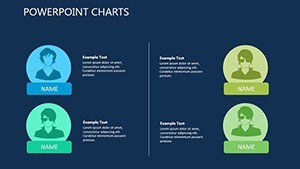
20 editable slides include timelines plus flow charts and radial diagrams.
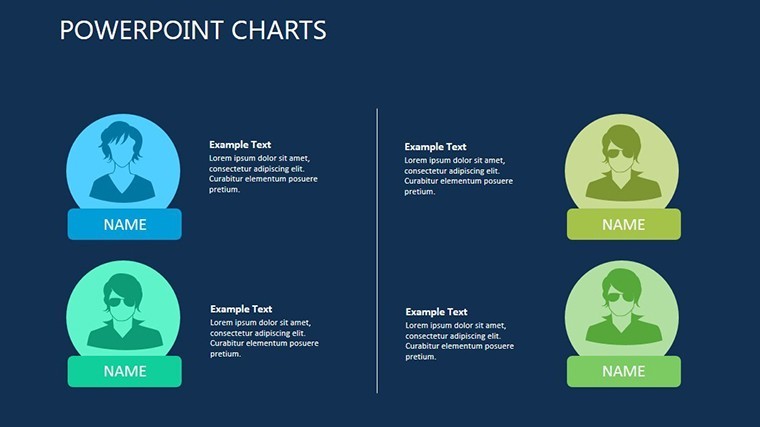
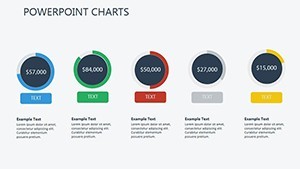
Blue-green WCAG presets form the color schemes.
The .key file is included.
Format and Compatibility Details
| Feature | Details |
|---|---|
| Slides included | 20 with diagram categories for training |
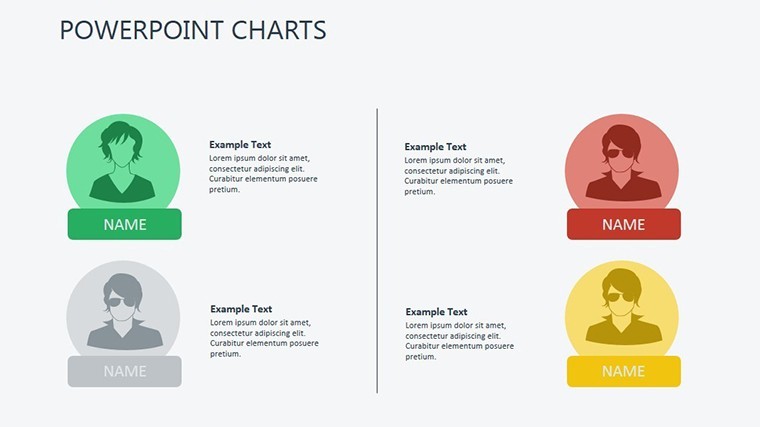
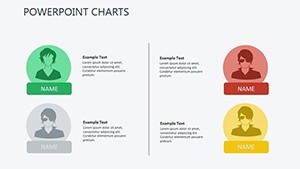
| Editable elements | shapes resize and text placeholders update |
| Aspect ratio | standard 16:9 |
| PowerPoint compatibility | export only native Keynote |
| Color themes | WCAG presets adjust via palette |
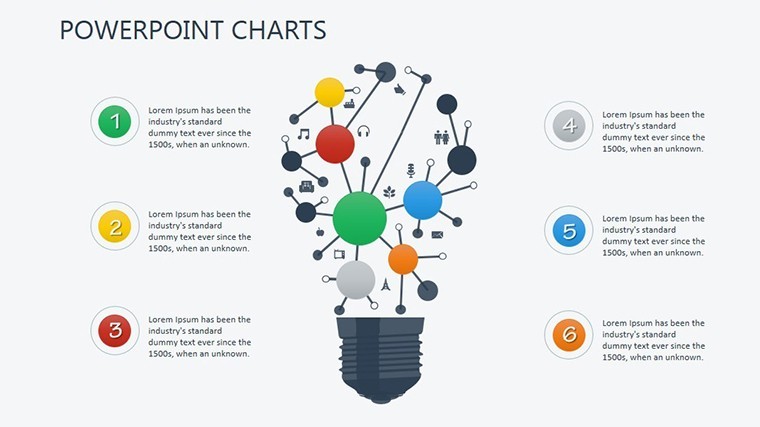
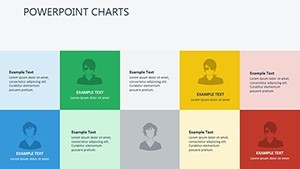
| Icon layers | 100+ replaceable |
Short sentence.
Medium length with information spacing.
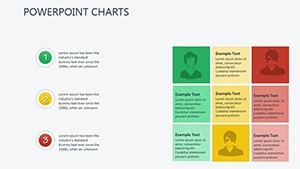
Longer sentence shows how layout composition in diagram structure supports visual hierarchy across corporate training or performance reviews.
Adapting the Template to Your Brand
- Open the .key file in Keynote (1 minute)
- Swap icons from the 100+ set (3 minutes)
- Apply brand colors to presets (2 minutes)
- Edit flow labels (4 minutes)
- Export PDF (1 minute)
Moderate difficulty.
Short.
Who Reaches for This Template
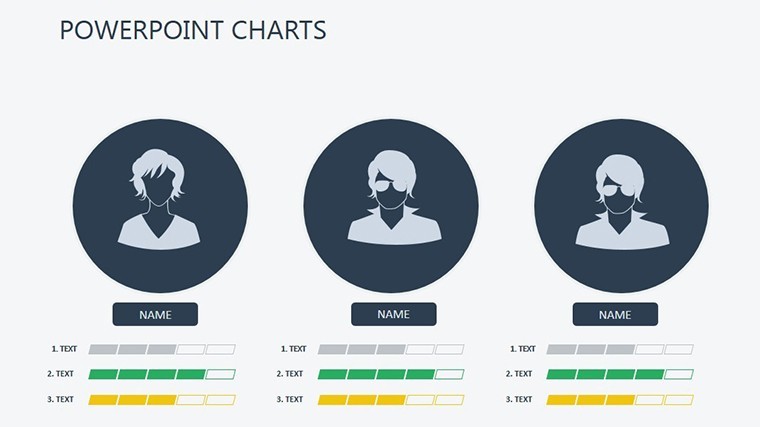
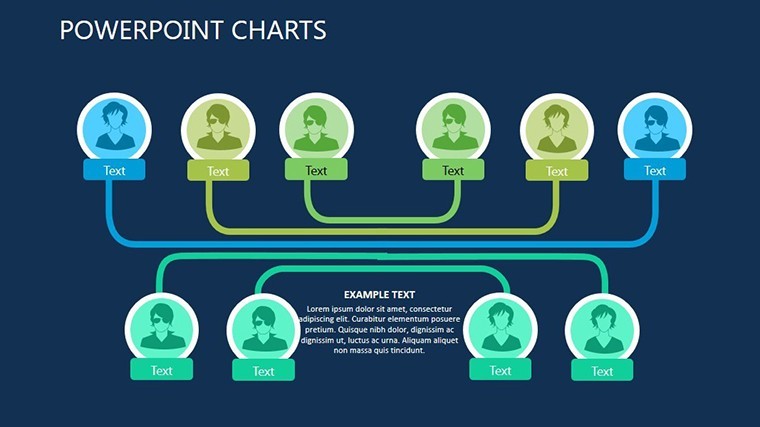
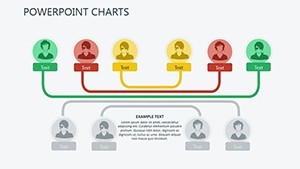
An HR specialist in corporate training mapped development paths with radial diagrams and reused the file across quarterly briefings.
A trainer in education cut session prep from 2 hours to 35 minutes using the timelines.
Download the Training Infographic Keynote Charts Template now.
The Cost of Not Using a Template
Manual radial diagrams often misalign on projection.
This keeps connectors fixed so changes stay consistent.
Timelines with flow charts set this apart from the 3D Business Puzzle Charts for Keynote and other related options.
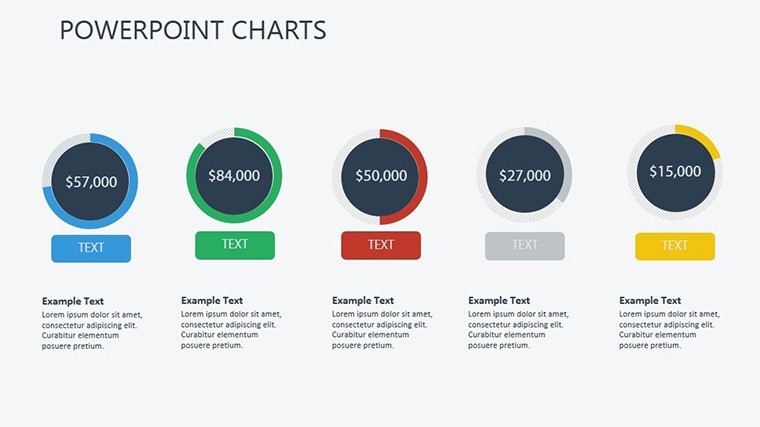
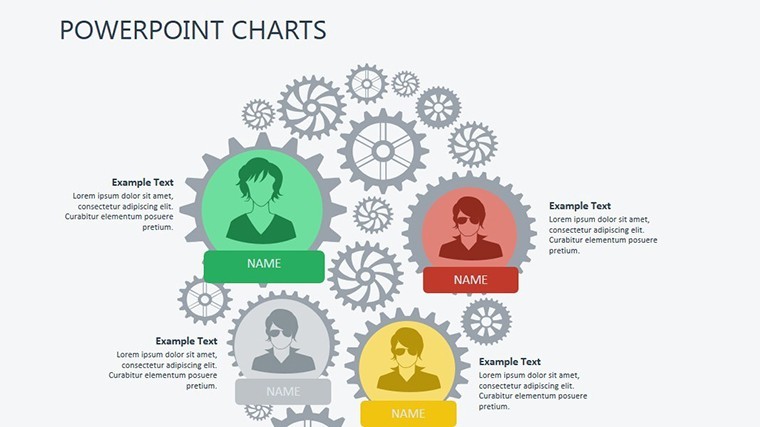
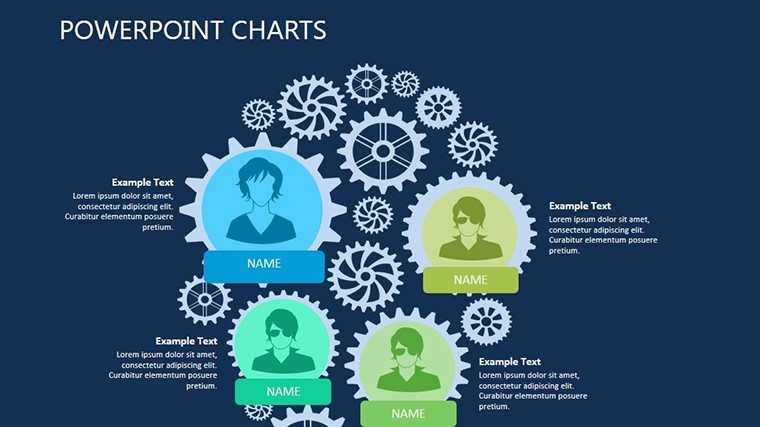
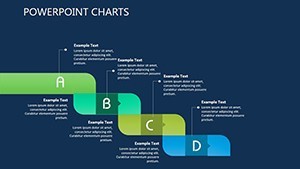
Radial diagrams with icons stand out as the specific visual characteristic.
Employee development tracking works best here because step reveals simplify training sessions unlike neighbors.
The paid version includes the full 20 slides and icons since no free version appears on the page.
Project managers combine this with the Decision Support System Keynote Charts Template in strategy workshops.
Regional sales directors reference the Business Startup Keynote Charts Template as a complementary option for growth metrics.
Get the template and present today.
Which Keynote versions open this file?
Keynote 12 and newer versions open the .key file without conversion. Older versions may require export to an earlier format first. Test on your device before the deadline to confirm compatibility. The file uses native elements so no third-party plugins are needed.
How do you change the color scheme?
Select the slide master in Keynote. Click the color palette icon. Choose blue-green WCAG presets already built in. Apply to all slides at once through the theme settings. Recolor individual shapes manually if needed in 30 seconds.
What does the license allow for client work?
You may use the template in paid client presentations and consulting decks. Resale or sublicensing of the original file is not permitted. Modify and deliver the final deck to clients freely. Keep the source file for your own reuse only.
What happens if the file does not work?
Contact support within 30 days of purchase for a full refund if the .key file fails to open in your Keynote version. Provide the exact error message. Refunds process within 48 hours once verified. No questions asked beyond the compatibility issue.
Are animations supported and how to apply them?
Fades revealing steps are built in for flow charts. Select the object and open the Animate tab. Choose the preset or build a custom sequence. Apply to multiple slides at once via copy-paste. Export to PDF disables animations automatically.