Control Staff Keynote Charts: Org Structures That Command


Type: Keynote Charts template
Category: Organizational
Sources Available: .key
Product ID: KC00340
Template incl.: 10 editable slides
Building a high-performing team is like erecting a skyscraper: Every role must align, communications flow seamlessly, and hierarchies support without stifling. The Control Staff Keynote Charts template delivers exactly that with 10 editable slides focused on organizational mapping. Aimed at HR directors, execs, and change managers crafting associations from departments to workshops, this is your framework for formal lines that foster unity and drive.
Compatible with Keynote's .key format, it extends to PowerPoint and Google Slides for inclusive editing. Category: Organizational pure and simple - think org charts that delineate reporting chains, much as floor plans define spatial relations in building designs. With widescreen optimization, your structures scale from small teams to enterprise sprawls.
Commanding Clarity in Organizational Design
These charts establish management systems that group people effectively, setting communication protocols that reduce silos - echoing best practices from SHRM guidelines, where visualized orgs cut confusion by 30%. Editable nodes let you plug in names, roles, and metrics, animating connections to highlight interdependencies.
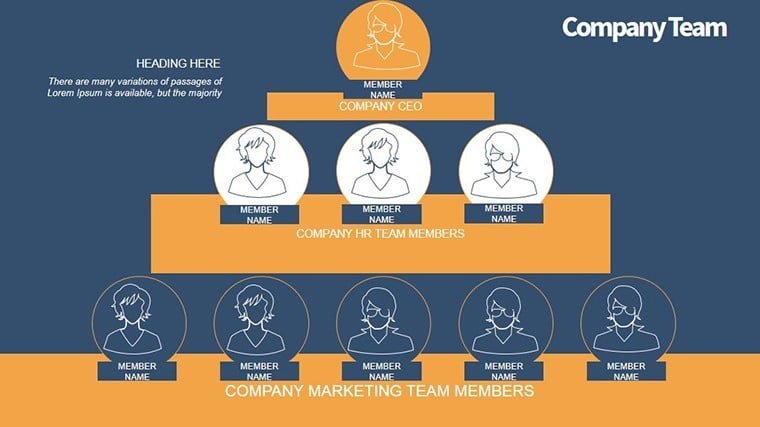
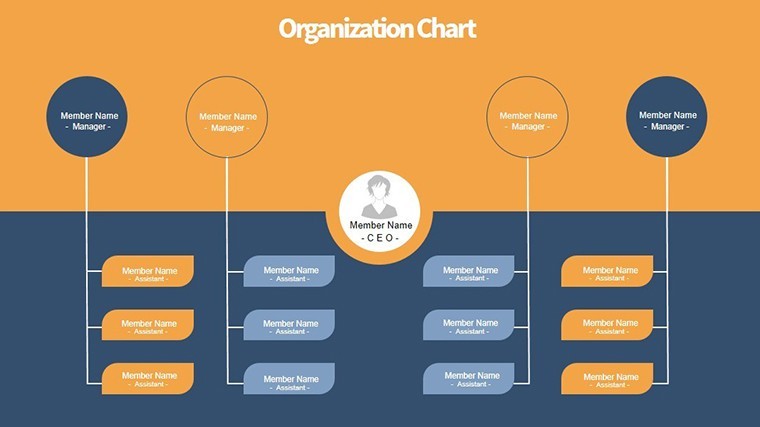
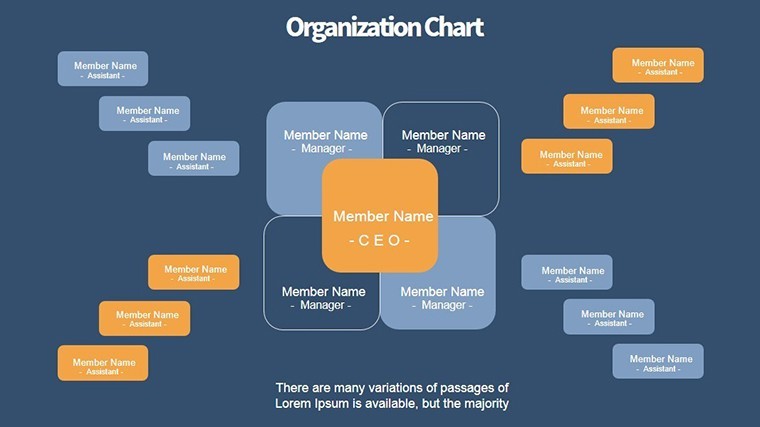
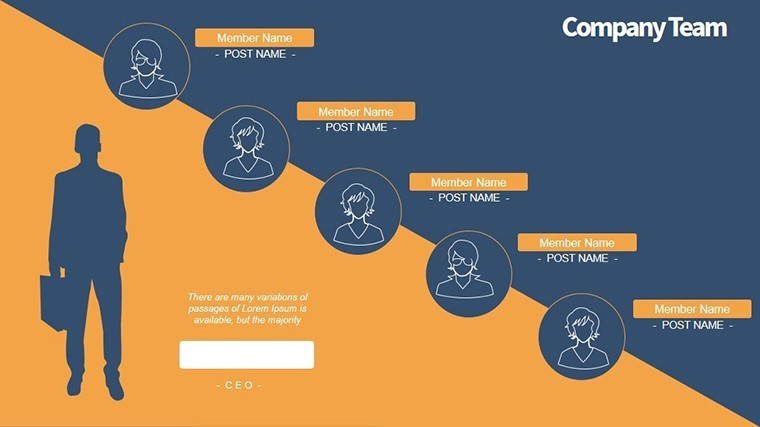
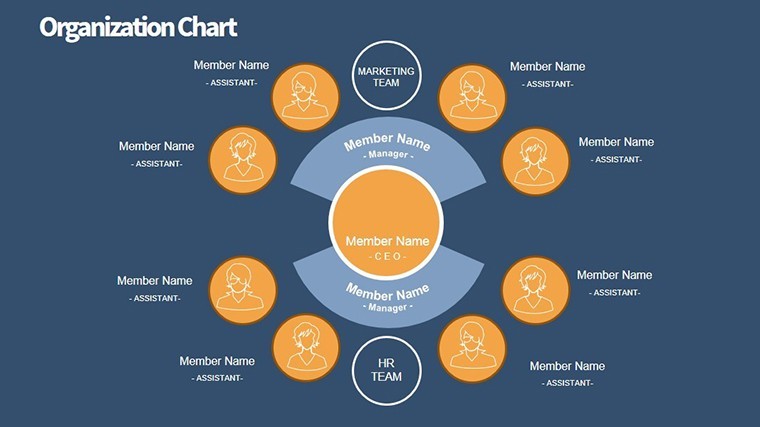
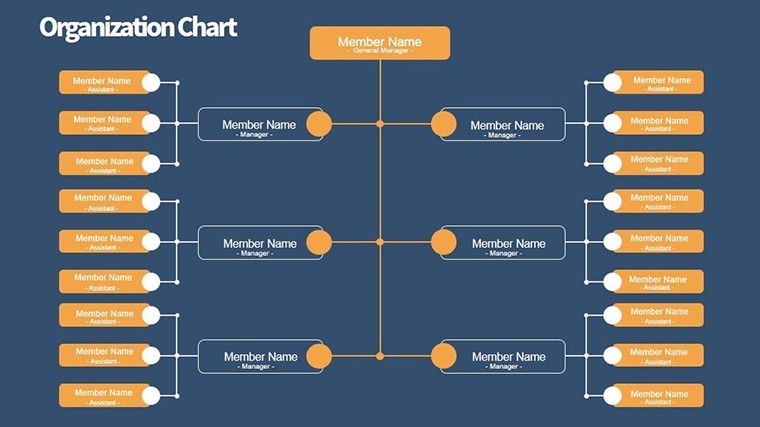
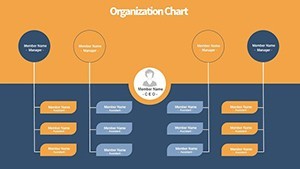
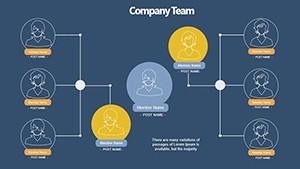
- Hierarchical Trees: Branching diagrams from CEO to entry-level, with collapsible branches for drill-downs.
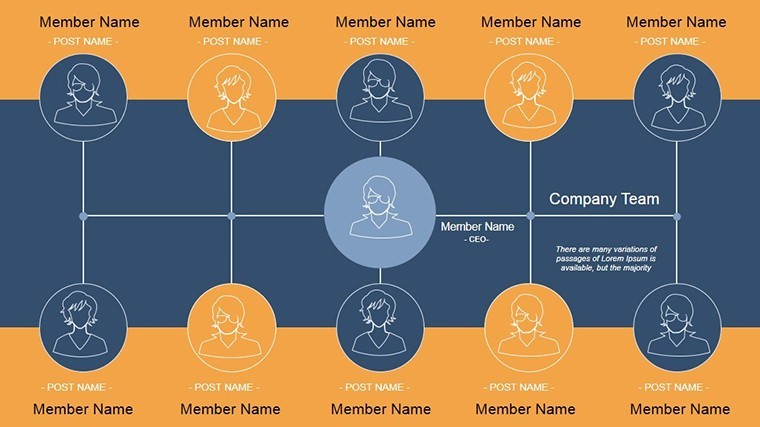
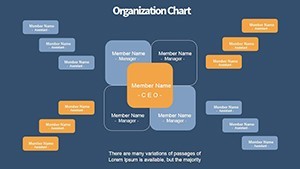
- Role Relationship Maps: Dotted lines for informal ties, solid for direct reports - customize line styles for nuance.
- Neutral Tones: Professional grays and blues for trust, swappable to energizing accents for growth-focused orgs.
- Subtle Animations: Fade-ins that build the structure layer by layer, mirroring org evolution.
A nonprofit in Boston redesigned its board using these, clarifying volunteer integrations and boosting engagement 18% - proof that structured visuals build stronger foundations.
The 10 Slides: Foundations to Frameworks
Concise yet comprehensive, each slide targets a facet of control. Slide 1: A top-down tree for executive overviews, editable branches for quick role adds.
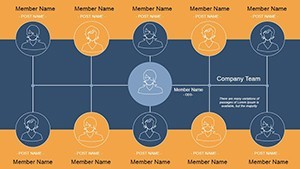
- Core Hierarchies (Slides 1-4): Basic trees evolving to multi-level matrices - import from HRIS for auto-population.
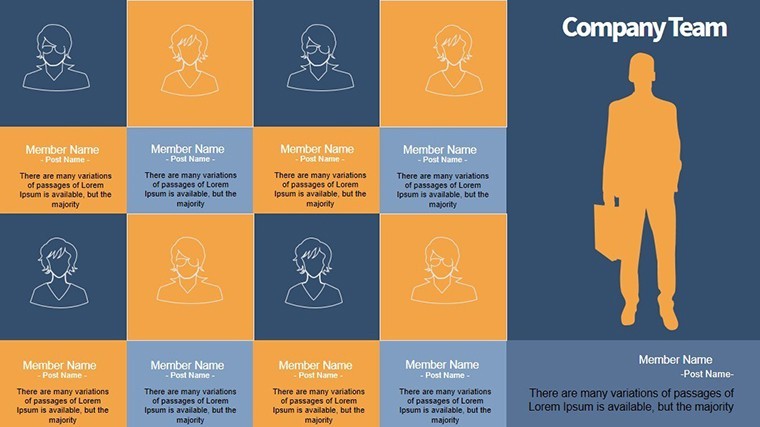
- Departmental Details (Slides 5-7): Horizontal orgs for workshop views, with capacity bubbles for staffing insights.
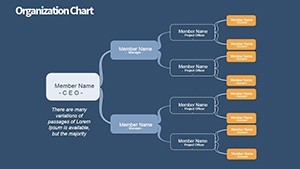
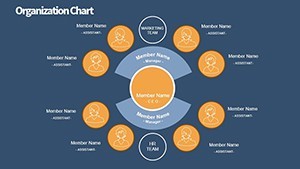
- Communication Closers (Slides 8-10): Network graphs linking formal/informal paths, annotated for policy notes.
Edit efficiently: Keynote's shape library for node swaps, connector tools for rerouting. For org 'architects' in mergers, this emulates integration models, aligning cultures like syncing building codes in renovations.
From Theory to Team Triumphs
Apply in onboarding decks: Trace new hires through the structure, easing acclimation. Or for restructures, animate shifts to sell changes - as a retail chain did, streamlining districts to lift productivity 12%.
Tech tie-ins: Link to BambooHR exports for live updates, or Slack bots for interactive views. Demonstrate authority with nods to McKinsey's org design principles, weaving trust into every line.
Structuring Success: Quick Wins
Pro tip: Color-code by function - purples for creative, greens for ops - to spot imbalances. Use grouping for modular edits, and export PNGs for reports. These make your org not just charted, but championed.
Assemble your ideal structure? Acquire Control Staff Keynote Charts straightaway and lead with lines that last. Affordable access, scalable impact - organize onward.
Frequently Asked Questions
How flexible are the org chart connections?
Drag to reconnect, style lines variably - full control over relational visuals.
Support for large organizations?
Scales to 500+ nodes with zoomable views and filtered layers.
Cross-platform use?
Keynote primary, but robust exports to PowerPoint/Google Slides.
Include role icons?
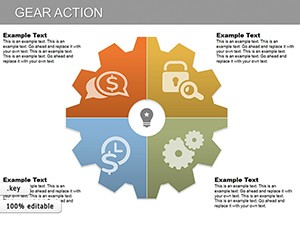
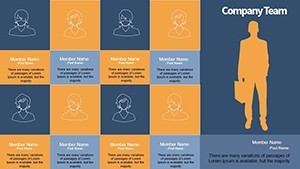
Yes - 20+ placeholders, from manager hats to team gears.
File delivery details?
Instant .key ZIP download, with editable source and guide.