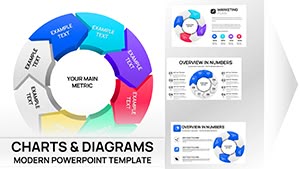
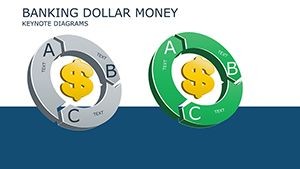
Money Keynote Charts: 16 Slides for Financial Mastery


Type: Keynote Charts template
Category: Cycle
Sources Available: .key
Slide size: widescreen (16:9)
Product ID: KC00307
Template incl.: 16 editable slides
Money makes the world go round, but presenting it? That's where many spin out. From swirling cash flows to towering trade turnovers, financial data demands visuals that mesmerize without misleading. Our Money Keynote Charts template delivers exactly that: 16 editable slides that turn fiscal fog into fortune-telling clarity.
Crafted for economists, financial planners, and business strategists who juggle budgets like circus pros, this .key gem spotlights the lifecycle of currency - cash to coin, digital to deal. Envision timelines tracing investment horizons, comparison layouts pitting ROI scenarios, and handmade infographics likening liquidity to golden streams. It's more than charts; it's a ledger of persuasion.
Rooted in economic visualization techniques from the CFA Institute and World Bank reports, this template ensures accuracy meets allure. With 16 slides, it's nimble for executive summaries or expansive for investor deep dives. Forbes notes that 70% of financial decisions hinge on clear visuals - equip yourself to tip the scales.
Curious how this can coin your next win? Let's ledger the details.
Financial Firepower: Signature Features Unveiled
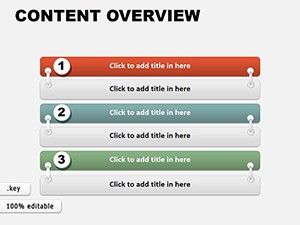
- 16 Tailored Slides: Covering cycles like cash flow wheels, numeric lists for balance sheets, and maps for global trade routes.
- Vector-Rich Assets: Stretchable symbols - coins, arrows, ledgers - maintaining sharpness at any zoom.
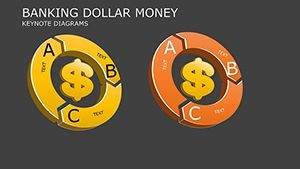
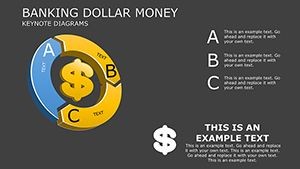
- Custom Color Dynamics: Schemes evoking trust (greens for growth, reds for risks) with one-click swaps.
- Smart Animations: Cascade effects simulating fund transfers, building tension then release.
- Widescreen Precision: 16:9 format, with table and smart art optimized for data-heavy reveals.
Handcrafted elements draw from Bloomberg terminal aesthetics, blending sophistication with accessibility.
In the Trenches: Applications That Pay Dividends
A venture capitalist at Sequoia uses slide 4's project timeline to forecast burn rates, layering equity milestones. The visual? Secured a Series A round, akin to pitches dissected in VentureBeat analyses.
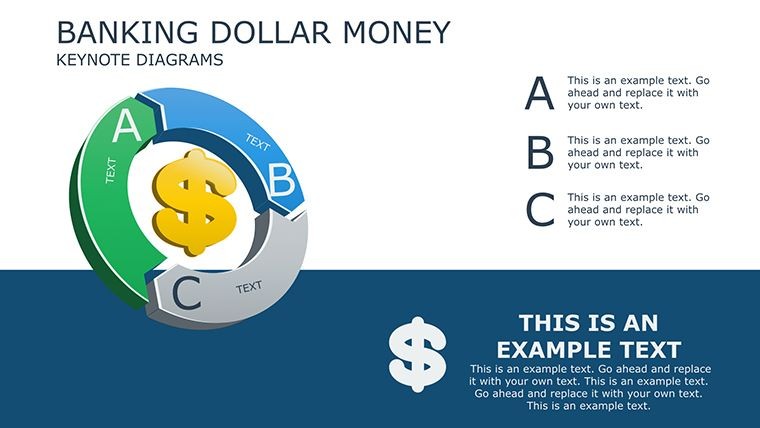
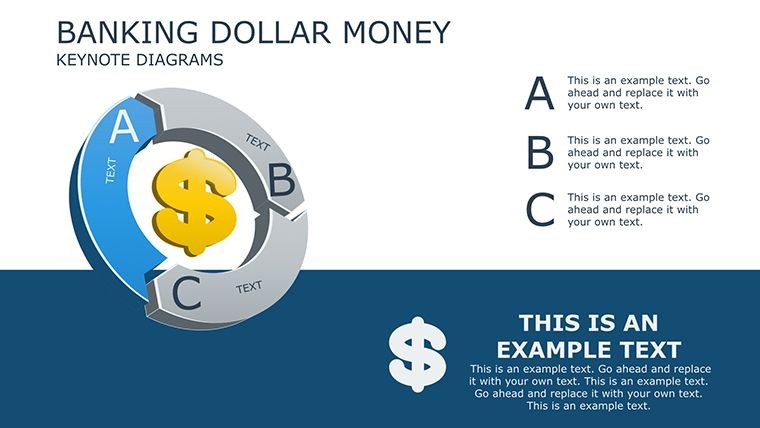
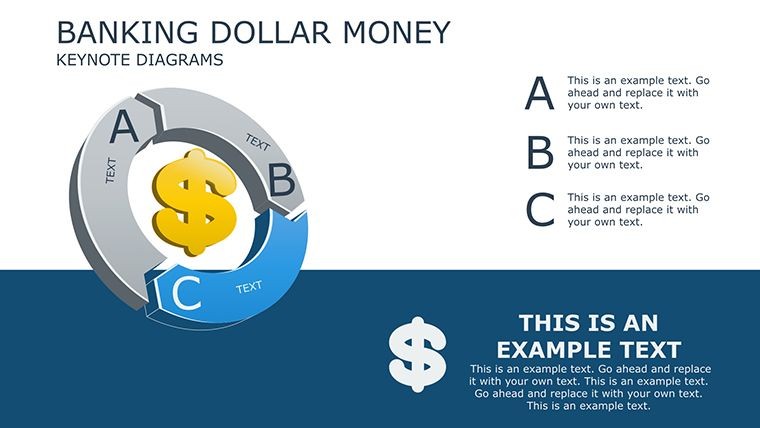
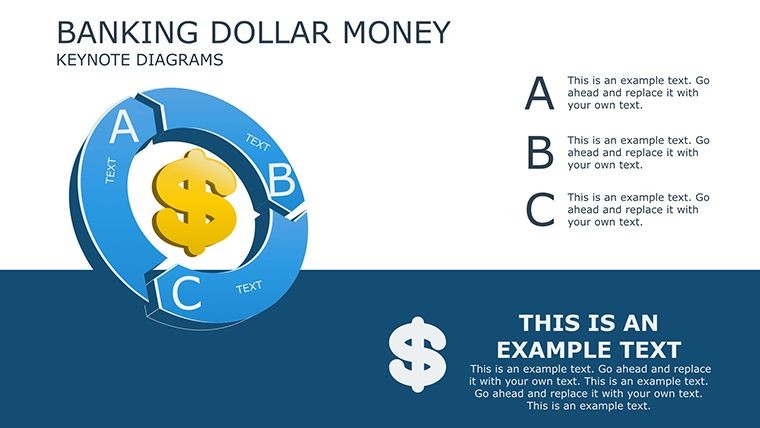
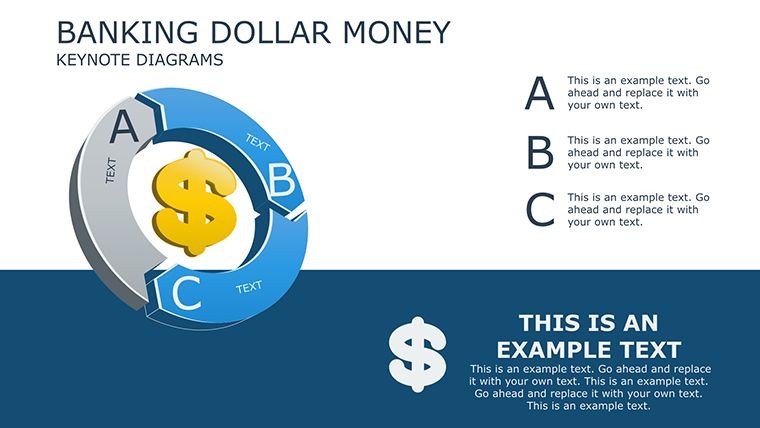
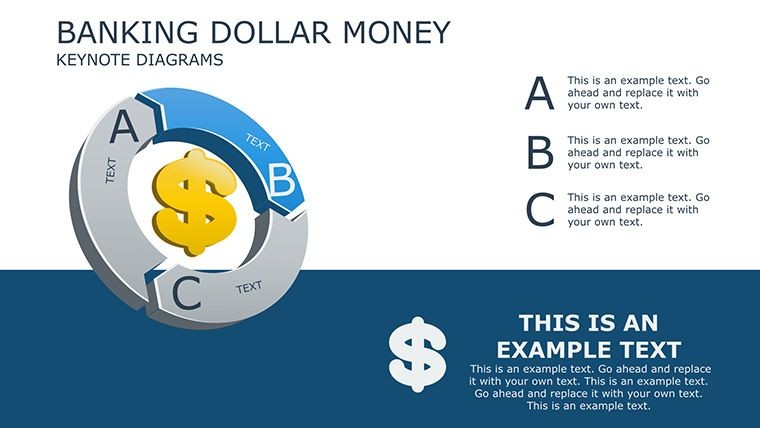
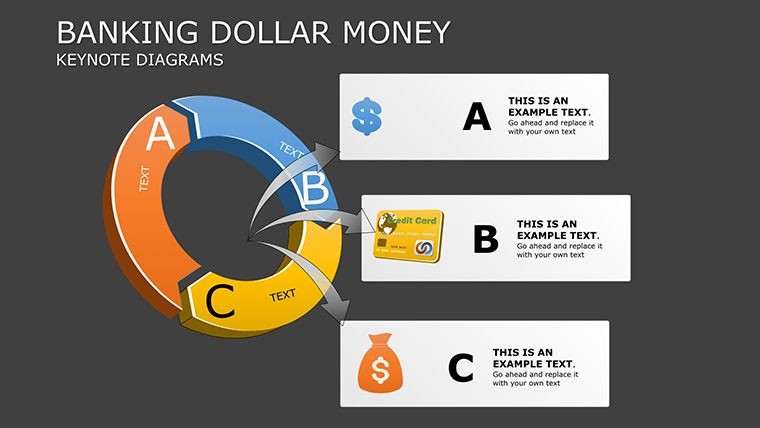
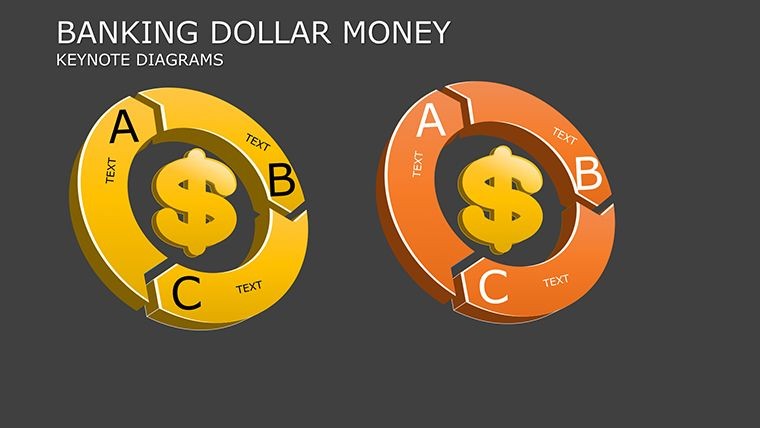
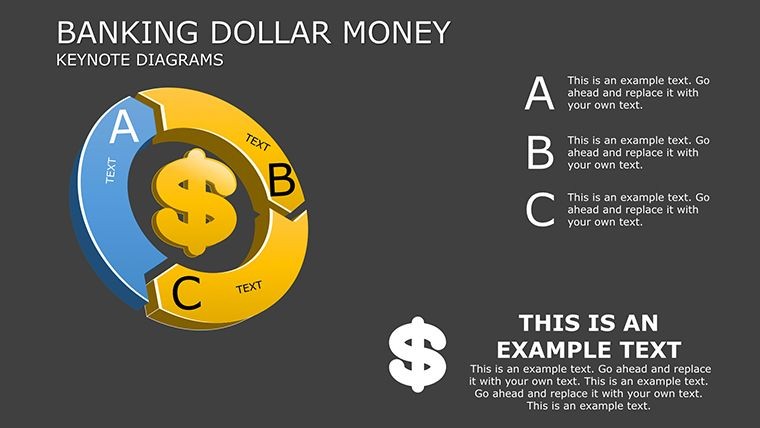
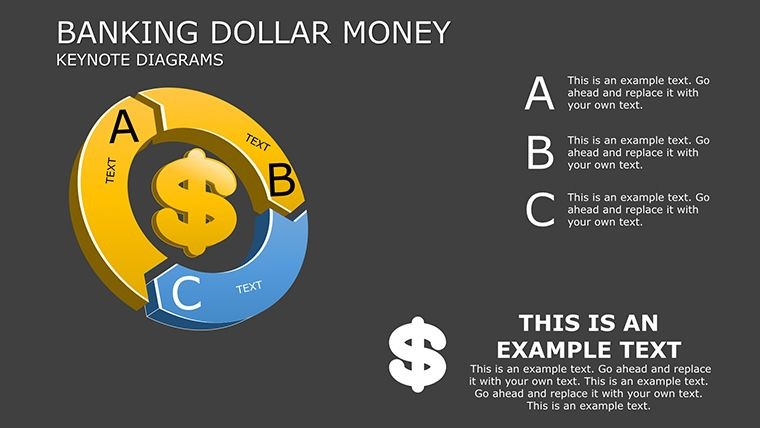
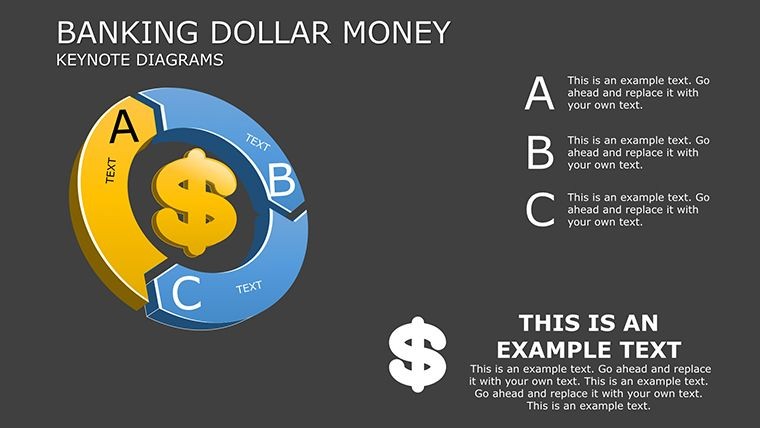
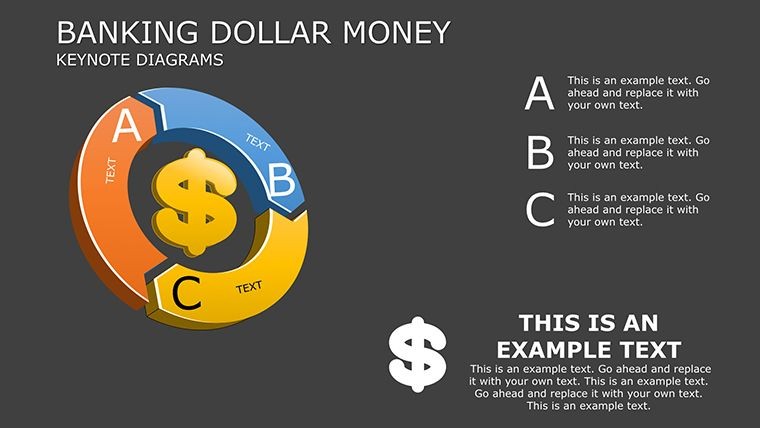
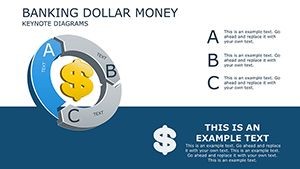
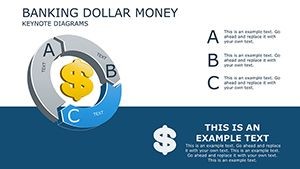
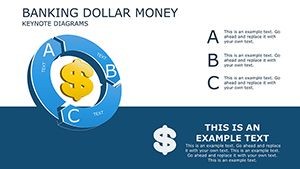
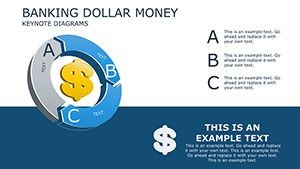
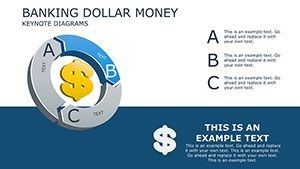
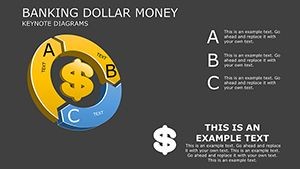
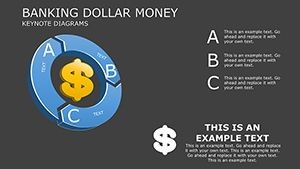
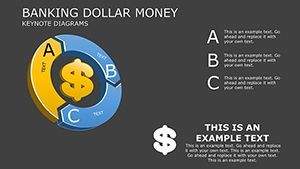
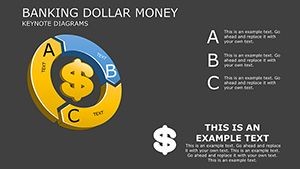
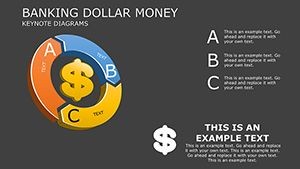
Cash Flow Cycles Demystified
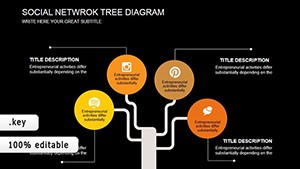
Slide 6's circular diagram loops inflows to outflows. Planners input quarterly figures, animate rotations to show seasonal ebbs - essential for SMB forecasting per QuickBooks benchmarks.
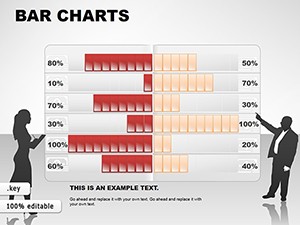
Trade and Turnover Comparisons
Slide 10's side-by-side bars contrast volumes. Economists illustrate GDP impacts, with icons scaling to values, mirroring IMF report styles for policy briefs.
Investment Timelines and Maps
Geospatial slide 13 pins portfolio assets worldwide. Animate paths for diversification stories, aiding advisors in client wealth mappings.
Urban developers track funding pipelines; traders chart volatility - universal utility in monetary mazes.
Monetizing Edits: Pro Tips for Peak Performance
- Data Infusion: Paste from Excel, auto-formatting tables for instant currency symbols.
- Icon Augmentation: Layer financial metaphors, like upward arrows for appreciation.
- Risk Highlighting: Use conditional formatting for thresholds, flagging variances visually.
- Projection Plays: Extend timelines with placeholder nodes for scenario planning.
Wall Street vets recommend pairing with Mint for live feeds, creating decks that update like stock tickers.
Versus the Vault: Template Triumphs Over Tropes
Default Keynote lacks fiscal flair - no bespoke infographics or cycle natives. This template's handmade touch rivals Canva premiums but integrates natively, slashing export glitches. CNBC pros laud such readiness for on-the-fly board meets.
Invest in your visuals. Acquire the Money Keynote Charts template at once and bank on breakthroughs.
Frequently Asked Questions
Are the financial icons editable?
Completely - recolor, resize, or replace with your custom SVGs.
Does it include currency converters?
Not built-in, but charts accommodate multi-currency via text fields.
Compatible with iOS Keynote?
Yes, fully responsive on iPad for mobile financial reviews.
Can I animate tables?
Absolutely - row-by-row builds for dramatic ledger unfolds.
What's the focus on security?
Data placeholders ensure sensitive info stays local until presented.