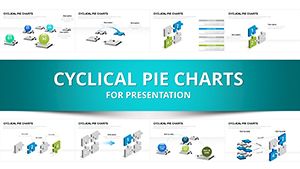
PEST Analysis Charts Keynote Template: Strategic Insights Made Visual


Type: Keynote Charts template
Category: Relationship
Sources Available: .key
Product ID: KC00305
Template incl.: 29 editable slides
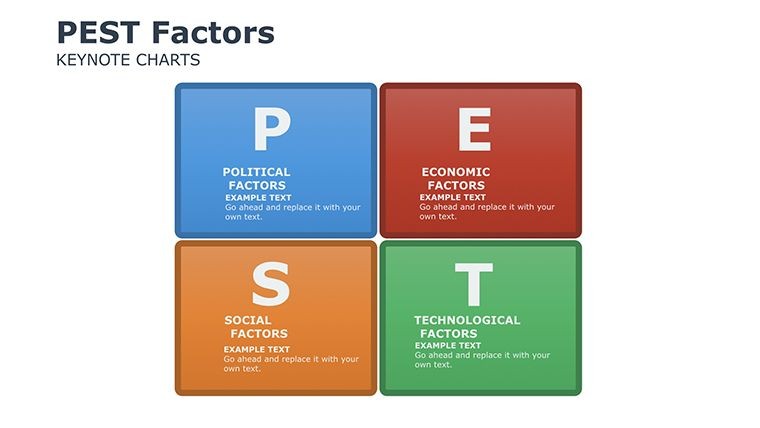
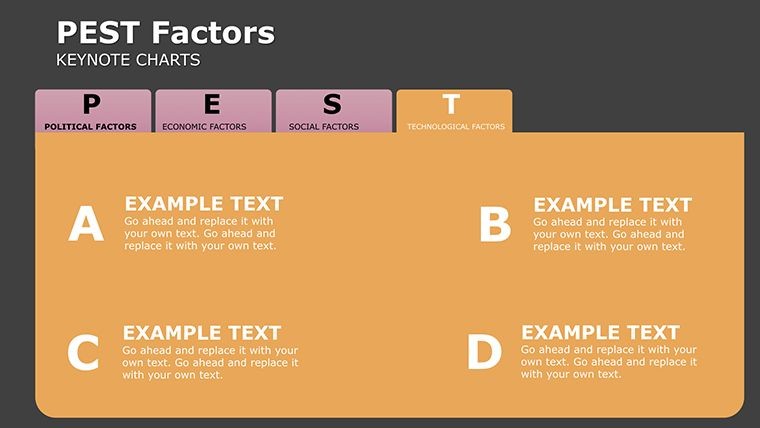
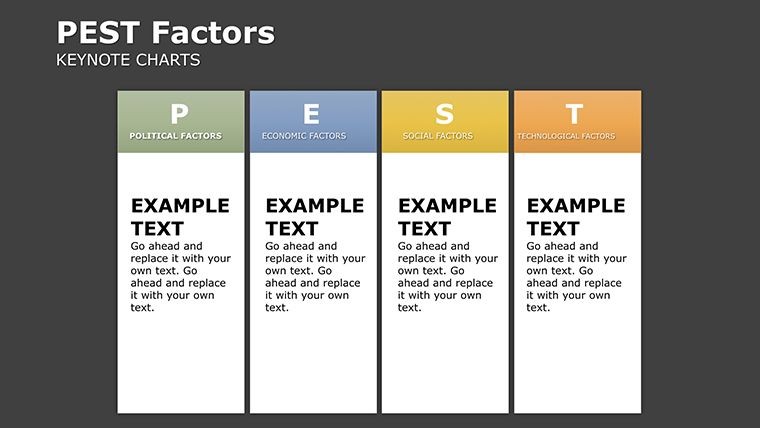
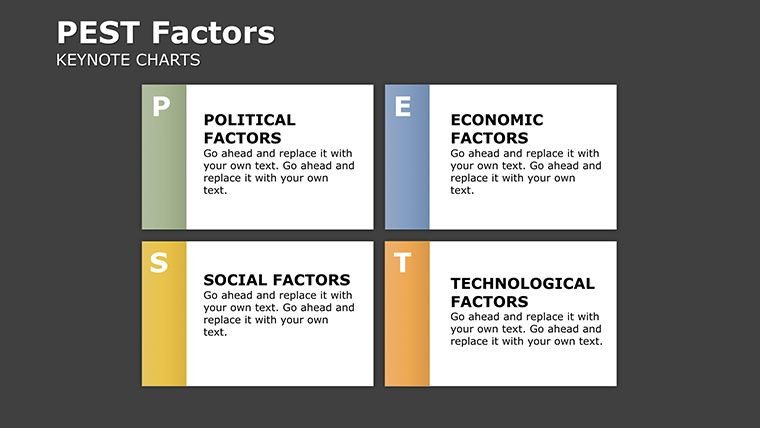
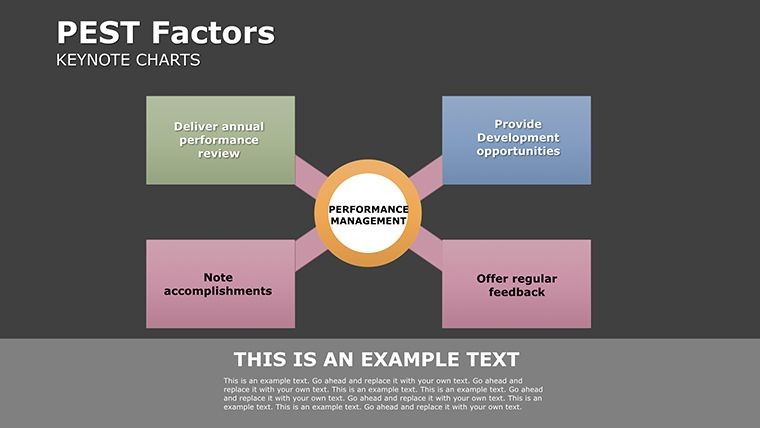
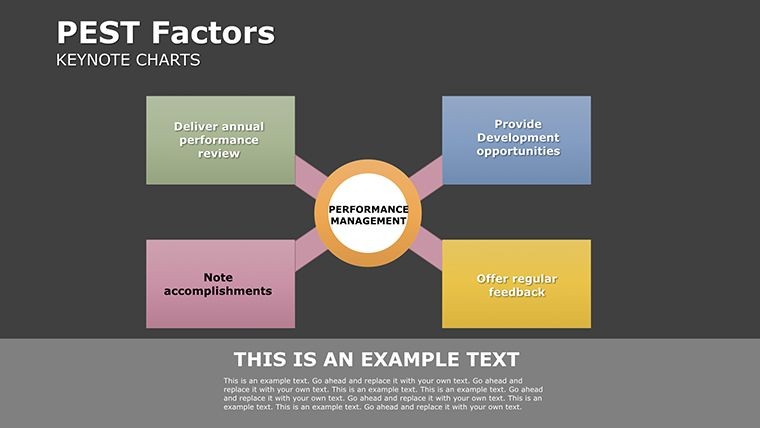
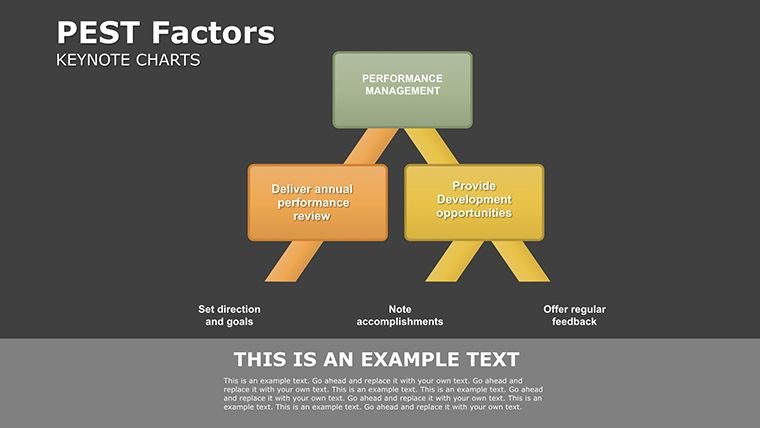
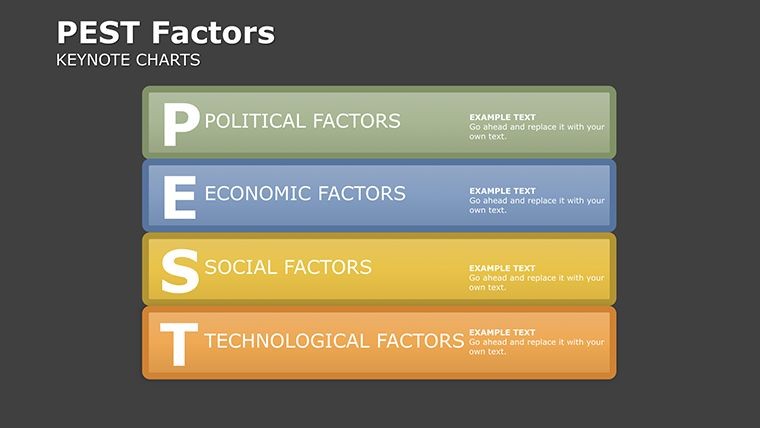
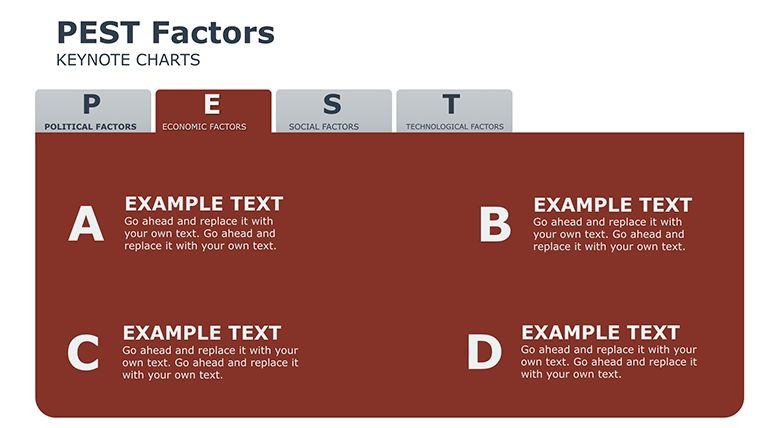
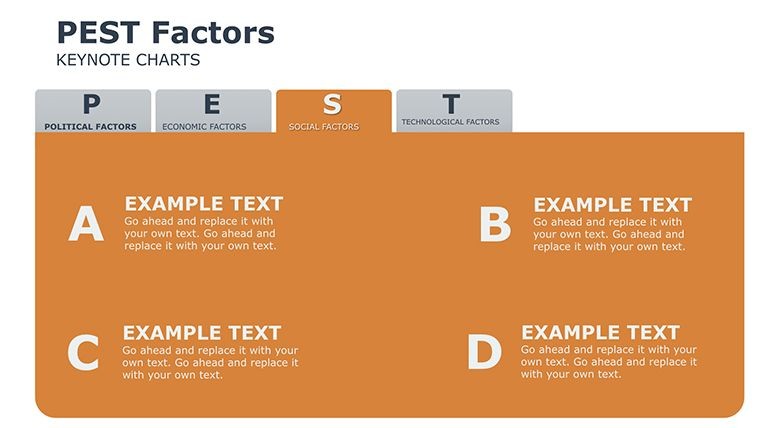
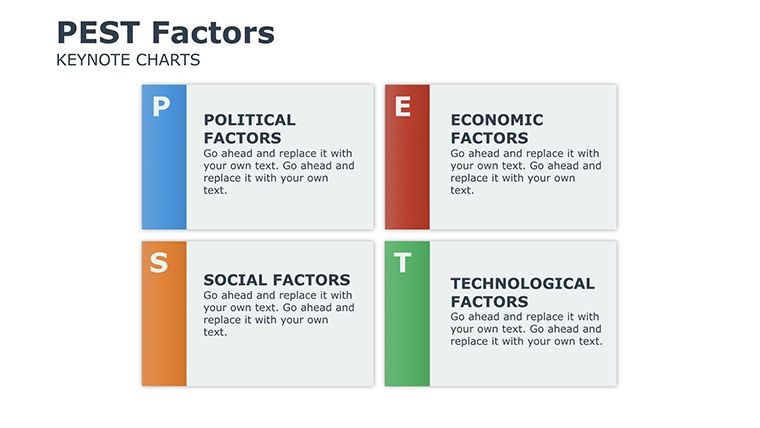
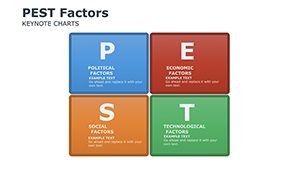
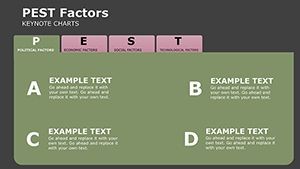
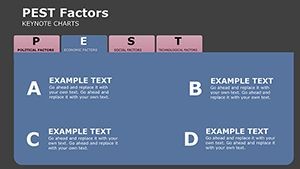
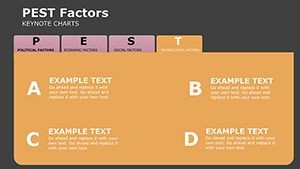
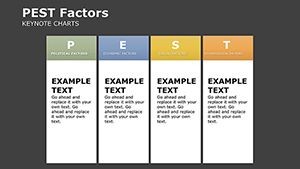
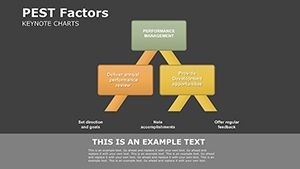
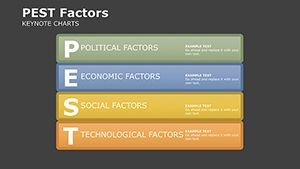
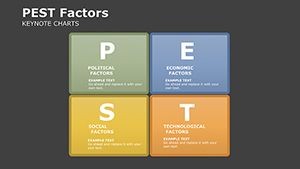
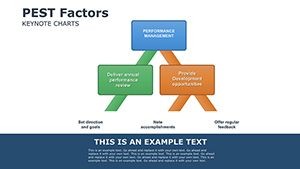
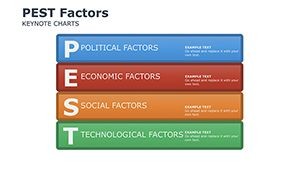
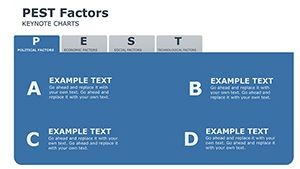
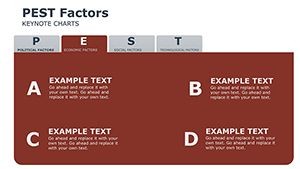
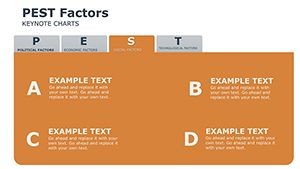
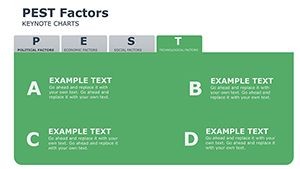
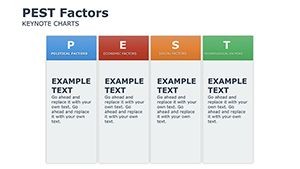
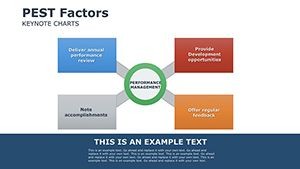
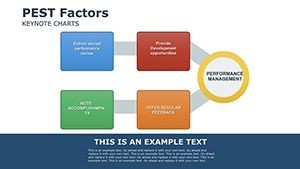
Navigating the external factors that influence your business or project requires more than just data - it demands clear, persuasive visuals that bring Political, Economic, Social, and Technological (PEST) elements to life. Our PEST Analysis Charts Keynote Template delivers exactly that, with 29 editable slides crafted by seasoned graphic designers to help you dissect macro-environmental forces effectively. Whether you're a business strategist preparing for market entry, an educator teaching strategic management, or a student compiling a thesis, this template simplifies complex analyses into engaging presentations. Forget bland slides; here, you'll find a blend of SWOT integrations, timelines, and comparison charts that adapt to your narrative, ensuring your audience grasps the big picture swiftly. Its user-friendly design means you can customize in minutes, focusing on insights rather than layout struggles. Backed by professional expertise, this tool aligns with frameworks from sources like Harvard Business Review, empowering you to present with confidence and authority in any setting.
Delving into PEST Visualization Excellence
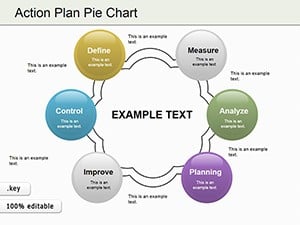
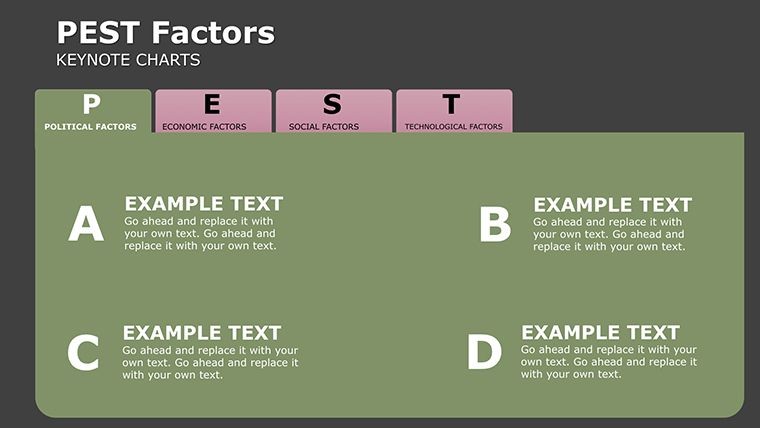
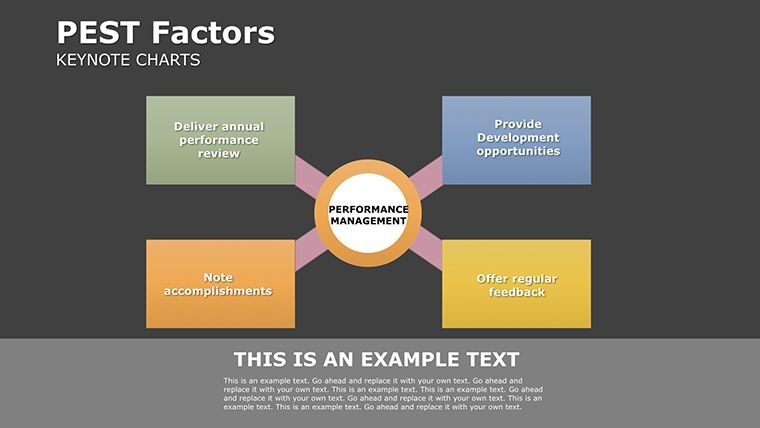
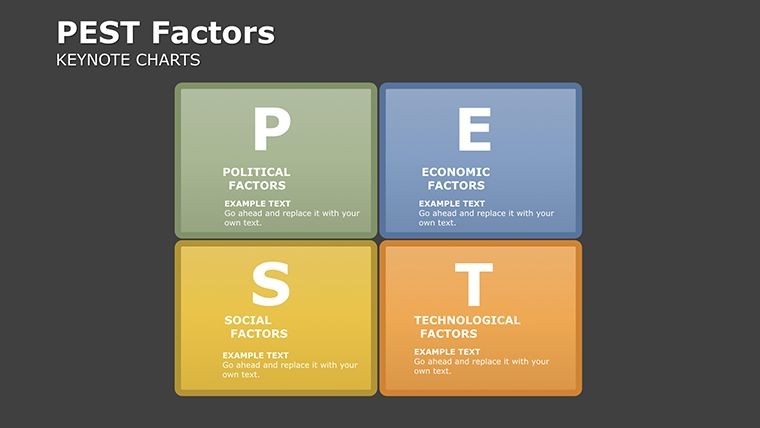
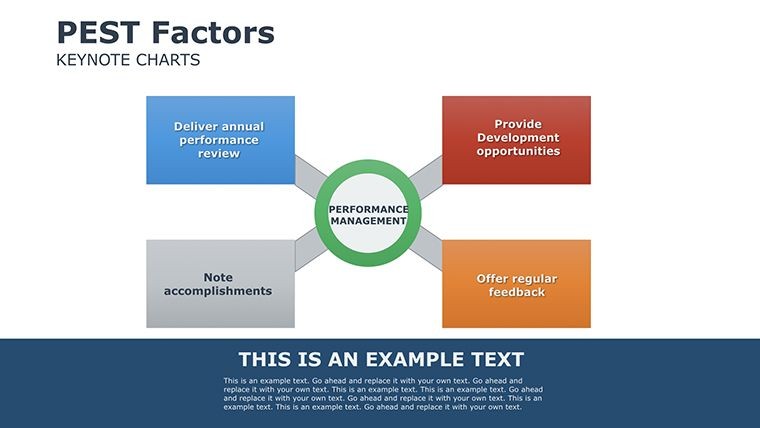
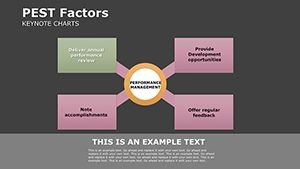
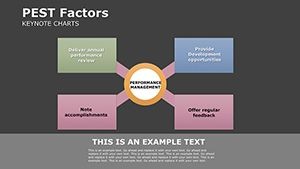
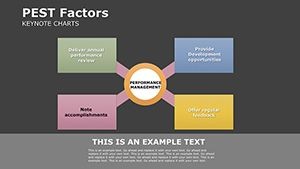
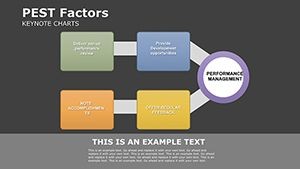
The template's strength lies in its comprehensive chart variety, each optimized for PEST components. Slide 4, for instance, offers a quadrant matrix where you can plot political risks against economic opportunities, using color gradients to denote severity - red for high impact, green for low. This visual hierarchy draws from cognitive psychology principles, making information absorption intuitive. Extend this to social trends on slide 9's bubble chart, sizing bubbles by demographic influence, perfect for illustrating shifts like aging populations or digital adoption rates.
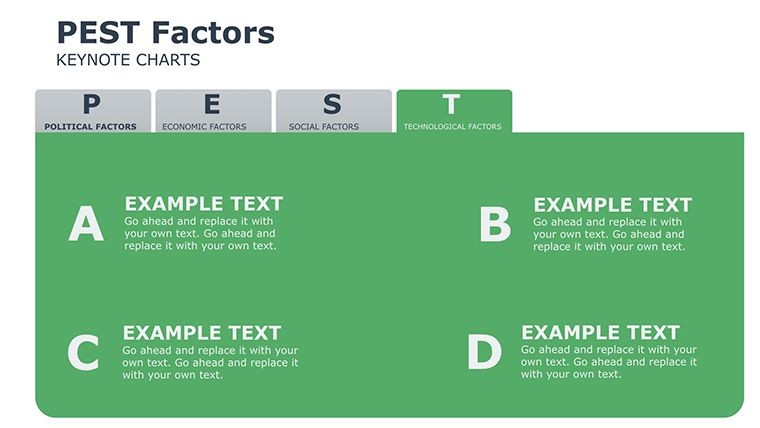
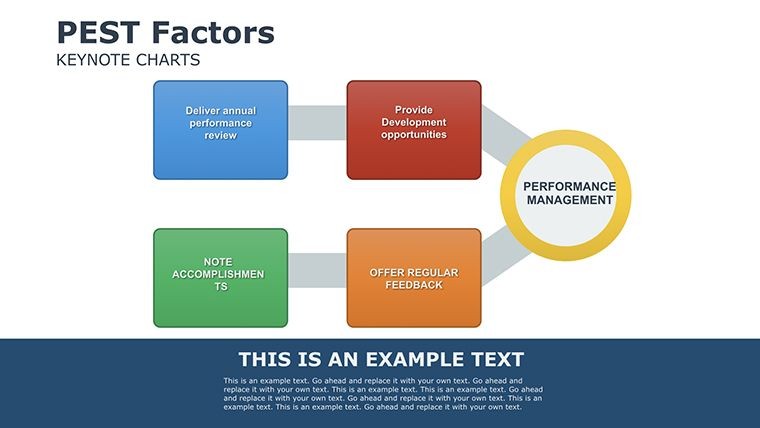
Technological factors get their due on timeline slides like 15, where you can chronology innovations and their business implications, perhaps referencing Moore's Law for tech evolution pacing. A real-world example: Consultants at a renewable energy firm used analogous PEST charts to evaluate market entry into emerging economies, identifying social acceptance barriers that adjusted their strategy, yielding a 40% better alignment with local regulations per McKinsey insights on global expansion.
Standout Features for Strategic Depth
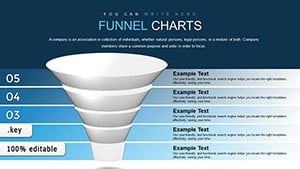
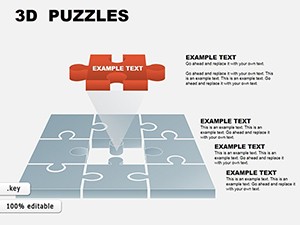
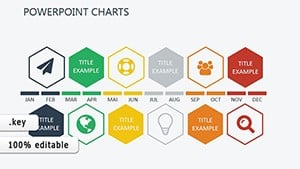
- 29 Editable Slides: A rich selection including matrices, timelines, SWOTS, and comparisons for thorough PEST coverage.
- Full Customization: Adjust colors, texts, and layouts to fit your branding or data specifics effortlessly.
- Intuitive Interface: Designed for all skill levels, with drag-and-drop edits that speed up preparation.
- Professional Aesthetics: High-end designs from experts, ensuring polished, audience-captivating visuals.
- Integrated Tools: Blend with relationship diagrams for multifaceted analyses.
Versus generic Keynote options, this template provides pre-built logic flows, reducing errors and enhancing analytical rigor.
Step-by-Step Strategies and Applications
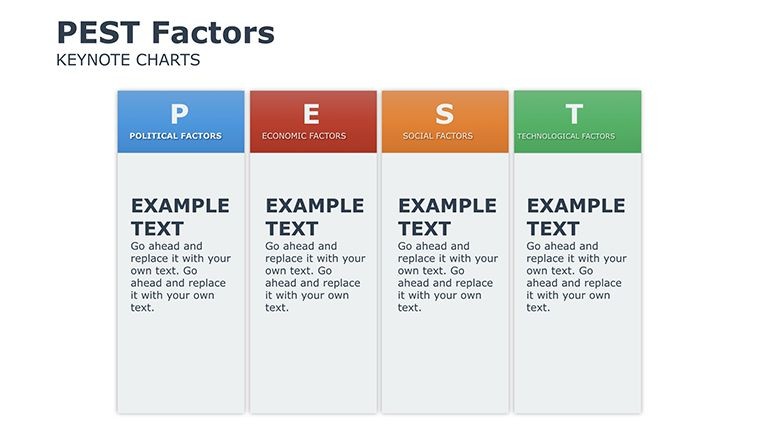
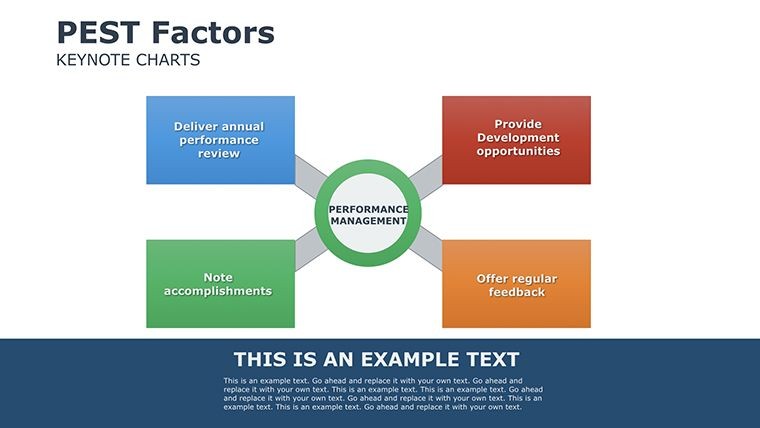
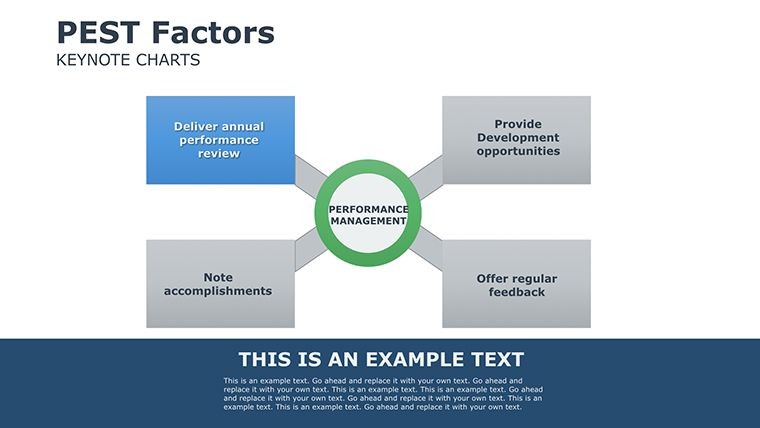
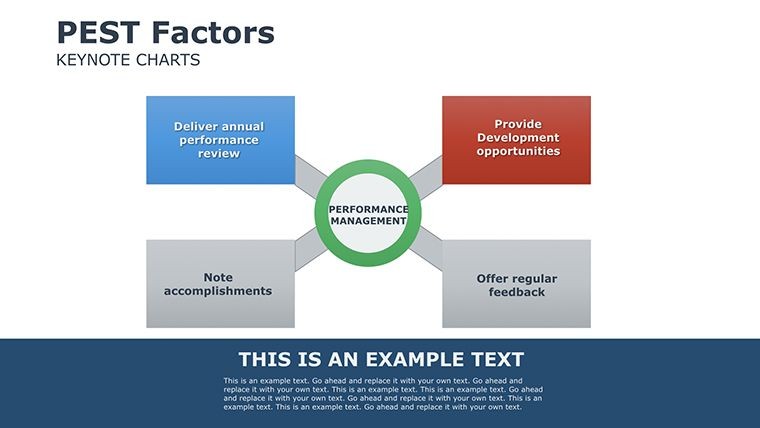
Put it to work with guided scenarios. For a market analysis pitch, start on slide 2's overview PEST wheel: Input key factors per segment, then drill down into economic bar charts on slide 7 to compare GDP impacts across regions. Customize with your data from sources like World Bank reports, adding icons for visual punch. In education, professors can use comparison slides (e.g., 20) to contrast PEST influences on industries like healthcare vs. tech, sparking classroom debates grounded in real data.
A workflow might include: 1) Research PEST elements via reliable databases; 2) Populate template placeholders; 3) Refine visuals for clarity; 4) Add narratives or annotations; 5) Rehearse for impact. This streamlines from concept to delivery. For students, it's invaluable for capstone projects, visualizing how social media trends (social factor) intersect with AI advancements (technological), backed by Pew Research stats.
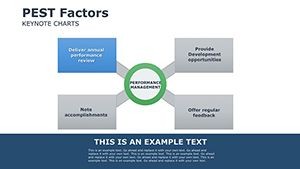
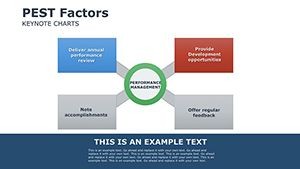
In corporate strategy, envision using the template for annual reviews. Slide 25's integrated SWOT-PEST hybrid could reveal opportunities like economic recoveries post-pandemic, informing budget allocations. Tips: Balance text with visuals, use animations for sequential reveals, and always validate data for trustworthiness.
Workflow Integration for Maximum Impact
Incorporate seamlessly: Download, edit in Keynote, and export as needed. Link to external docs for depth, or embed videos for tech demos. Emphasize by citing authoritative sources, positioning your presentation as expert-led.
Transform Your Strategic Presentations Now
This template elevates PEST analyses from routine to remarkable, with users noting increased stakeholder engagement. One educator shared, "It made abstract concepts tangible, boosting student comprehension dramatically." Seize the advantage - customize and conquer your next strategy session.
Frequently Asked Questions
Are the slides fully editable?
Yes, every element can be customized to suit your needs.
What software does this template require?
Exclusively Apple Keynote for best results.
Is it suitable for beginners?
Absolutely, with intuitive designs for easy use.
How many chart types are included?
A variety including matrices, timelines, and SWOTS across 29 slides.
Can I use this for educational purposes?
Yes, perfect for teaching and student projects.
Does it include PEST-specific examples?
Placeholders are provided, ready for your data input.