Cone Keynote Charts: Pyramid Power for Financial Clarity


Type: Keynote Charts template
Category: Pyramids
Sources Available: .key
Slide size: widescreen (16:9)
Product ID: KC00286
Template incl.: 16 editable slides
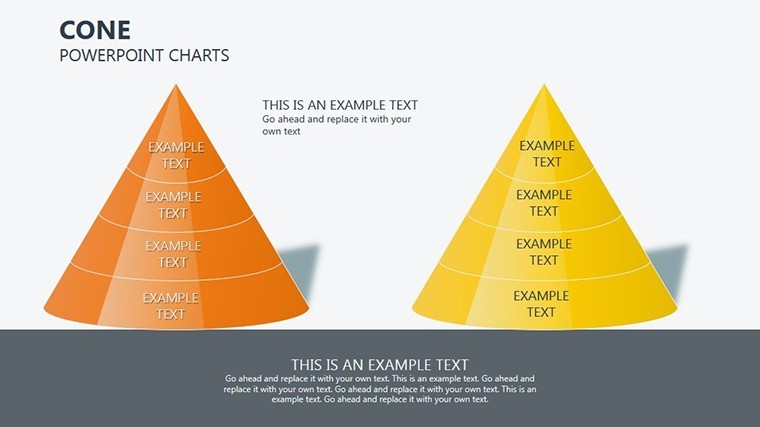
Navigating financial complexities requires tools that simplify without sacrificing depth. Enter our Cone Keynote Charts Template, featuring 16 editable slides centered on pyramid and cone structures for hierarchical data representation. Ideal for finance professionals assessing capital costs, cash flows, or investment strategies, this template turns abstract figures into structured visuals. Whether you're a CFO preparing board reports or an analyst modeling resource allocations, these slides provide the framework to convey value hierarchies effectively.
Designed for Keynote, it boasts widescreen compatibility and vector elements for flawless scaling. Customize cones to represent layered costs or pyramid bases for foundational cash flows, all while adhering to financial visualization best practices from bodies like the CFA Institute.
Key Features Shaping Your Financial Narratives
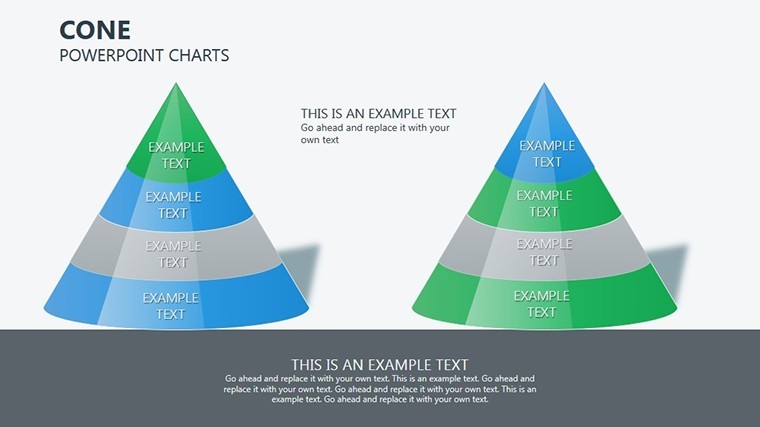
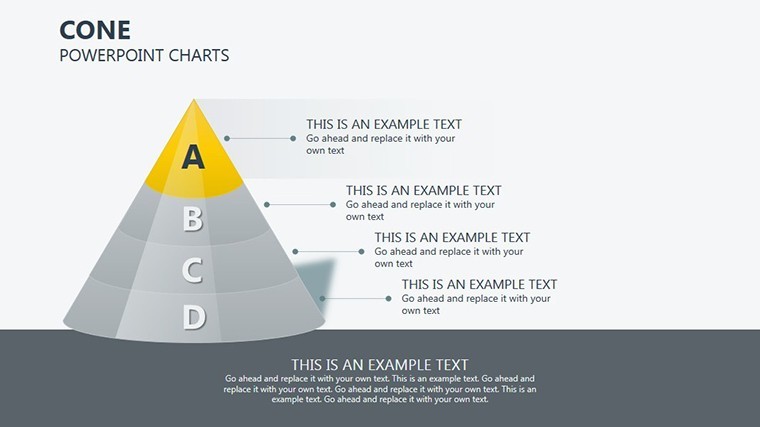
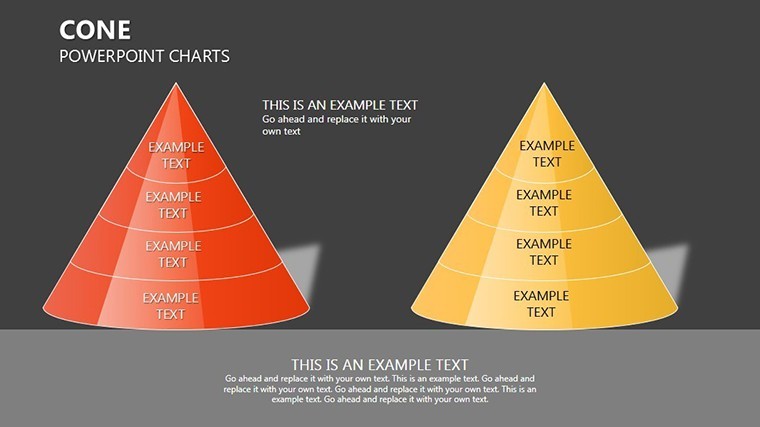
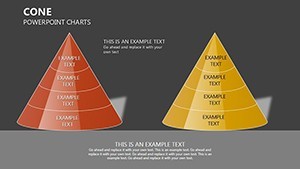
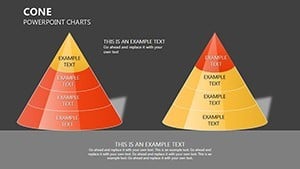
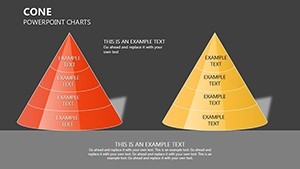
This template leverages pyramid designs, a staple in financial modeling for depicting proportions and priorities. With 16 slides, it offers variations from simple cones to multi-level pyramids, each editable for precise data fitting.
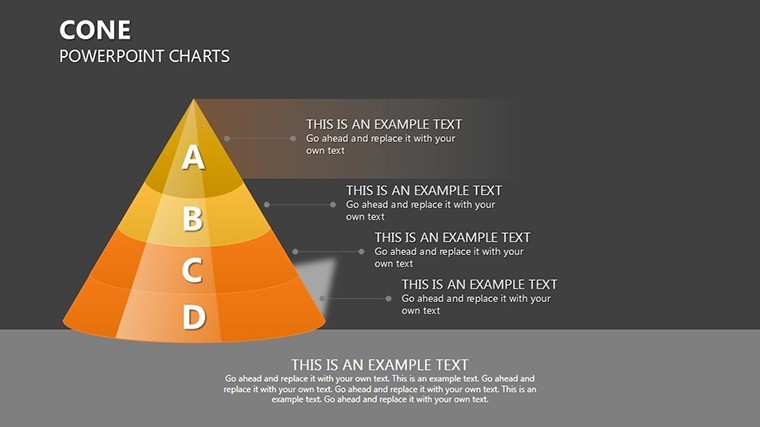
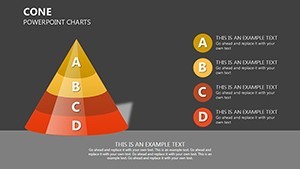
Features include layered segments that you can color-code for emphasis, ensuring quick comprehension of cost breakdowns or flow hierarchies.
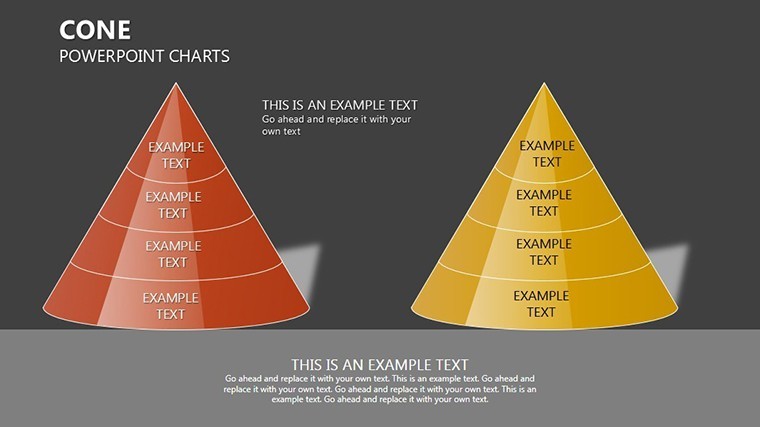
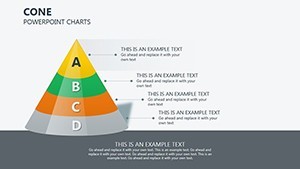
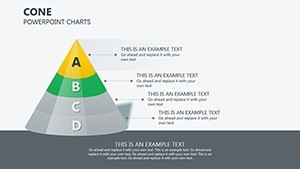
- Pyramid Customization: Adjust levels and labels to match your financial metrics.
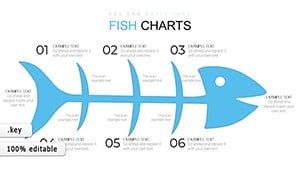
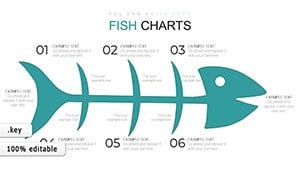
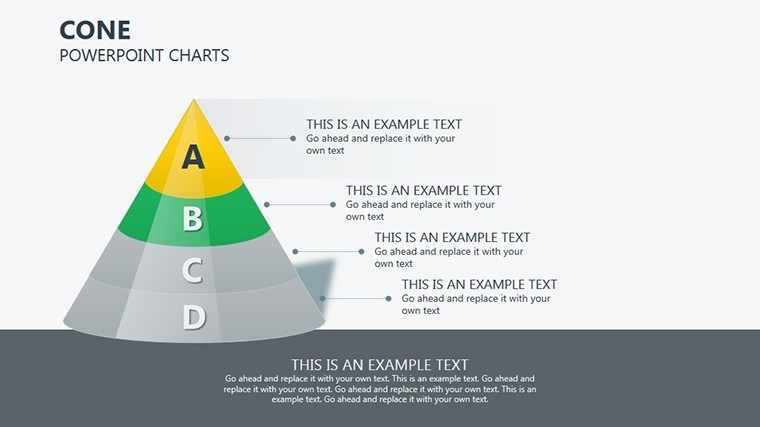
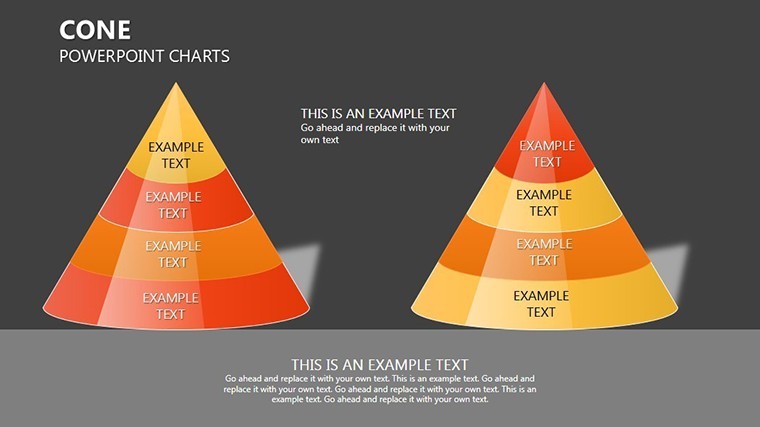
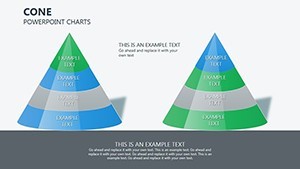
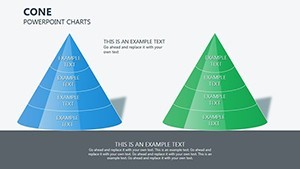
- Cone Dynamics: Use tapering shapes for convergence visuals, like narrowing investment options.
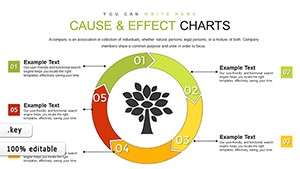
- Hierarchy Tools: Built-in connectors for linking related concepts.
- Scalable Vectors: Maintain quality in any presentation size.
Benefits shine in efficiency: Cut down on custom design work, as evidenced by finance teams who streamlined their reporting cycles. A hedge fund used pyramid charts to illustrate risk tiers, clarifying strategies for stakeholders.
Targeted Use Cases in Finance and Beyond
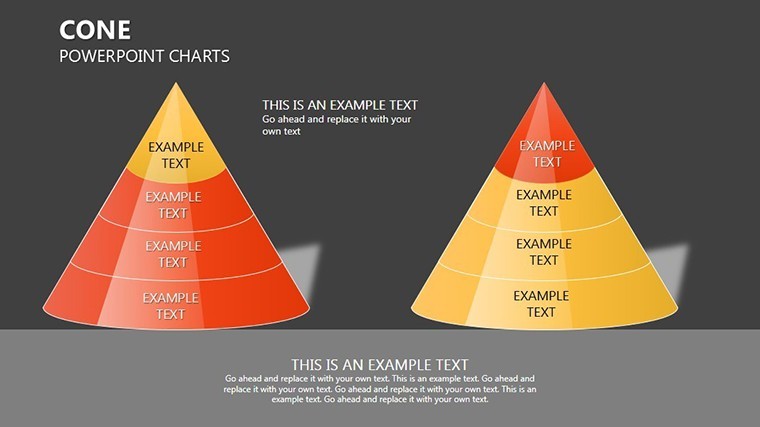
Apply to core financial tasks: Model cost of capital with pyramid bases representing debt and equity. Visualize cash flows in cones, tapering to net outcomes.
Beyond finance, adapt for strategic planning, showing organizational hierarchies or product funnels.
- Select a slide based on your data structure – pyramids for static hierarchies, cones for flows.
- Input figures, customizing segments proportionally.
- Add annotations for context, like formulas or assumptions.
- Present with transitions to build suspense in reveals.
Integration with Keynote's ecosystem allows for secure sharing and updates.
Building Trust: Authoritative Financial Visuals
Aligned with GAAP principles for accurate representations, this template fosters trustworthiness. High-fidelity exports ensure compliance in audits or reviews.
Inject inspiration: A cone slide could playfully show "Funneling Profits," easing tension in budget discussions.
Advanced users can overlay data tables, creating comprehensive dashboards, as in a case where an investment bank mapped portfolio allocations.
Step-by-Step Pyramid Building
Start with base layers for foundational data. Build upward, editing text and colors. Test proportions mathematically within Keynote. Finalize with exports for distribution.
LSI weaves in: Your ideal for Keynote pyramid templates, cone chart designs, or financial hierarchy visuals. It's precision in presentation form.
Insights from Finance Experts
Limit pyramid levels to five for readability. Use contrasting colors for segments, per visual perception studies. Draw from Bloomberg terminals' styles for professional appeal.
A real example: A startup visualized funding rounds in cones, attracting venture capital by demonstrating growth trajectories.
This template empowers financial storytelling at its finest.
Harness Pyramid Power – Download Your Template
Ready to structure your financial insights? This Cone Keynote Charts Template delivers the tools for compelling, clear presentations. Begin customizing and elevate your analytical edge today.
FAQ
What are cone charts best for in finance?
They excel at showing converging flows, like cash inflows to net profits.
Can pyramids handle multi-level data?
Yes, with editable layers for complex hierarchies.
Is it widescreen only?
Optimized for 16:9, but adjustable for other ratios.
How to add data to segments?
Directly edit text fields; proportions scale automatically.
Supports financial formulas?
Integrate via embedded tables or links.