Pyramid Ribbon Charts Keynote Template: Hierarchies Redefined


Type: Keynote Charts template
Category: Pyramids
Sources Available: .key
Slide size: widescreen (16:9) , standart (4:3) , widescreen (16:10)
Product ID: KC00278
Template incl.: 24 editable slides
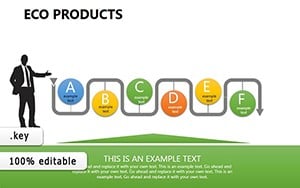
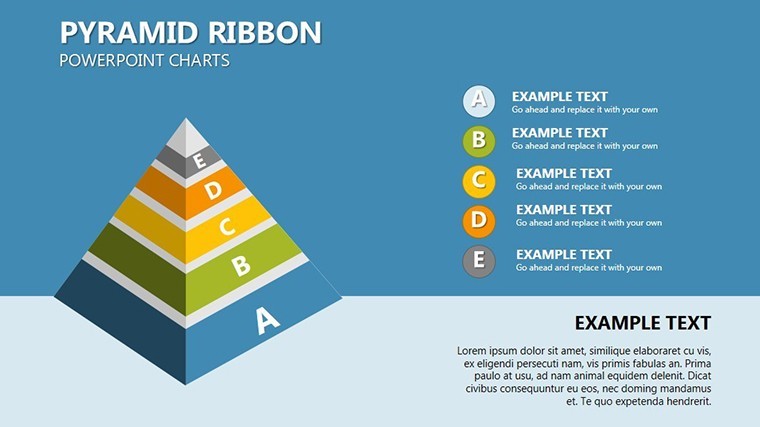
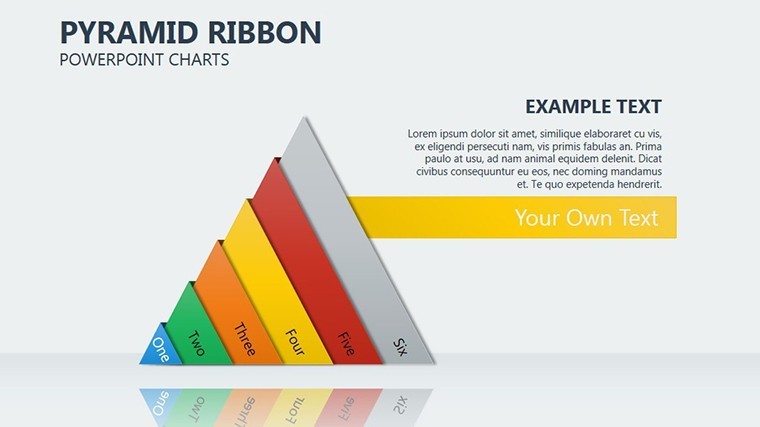
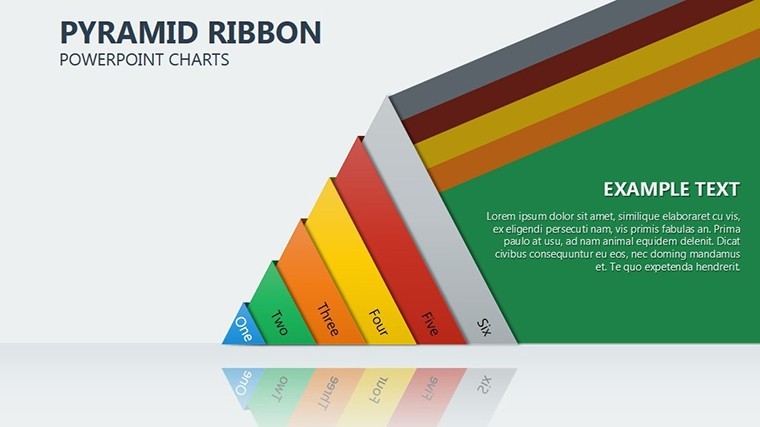
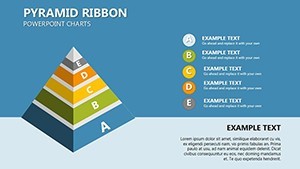
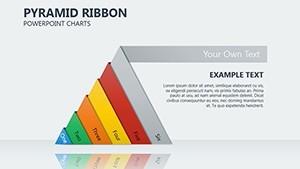
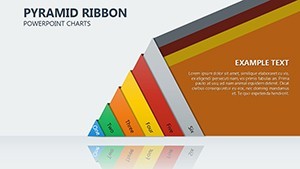
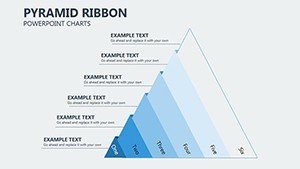
Picture distilling the essence of an economic model's most critical elements into a visually stunning hierarchy that captivates your audience. The Pyramid Ribbon Charts Keynote template does exactly that, offering 24 editable slides designed for Keynote enthusiasts who need to abstract from secondary factors and spotlight what truly matters. Tailored for economists, consultants, and strategic planners, this template transforms abstract concepts into tangible visuals, making it easier to communicate patterns in economic functioning.
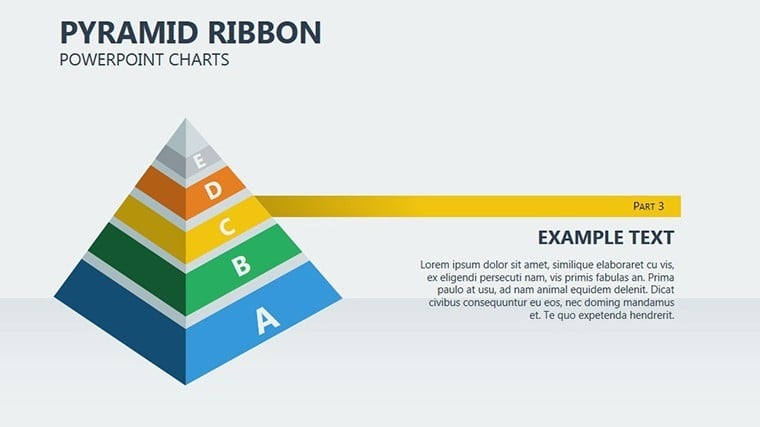
Drawing from classic pyramid models used in frameworks like Maslow's hierarchy adapted for business, it emphasizes layered importance - ideal for scenarios like cost-benefit analyses or organizational structures. Users benefit from its ability to simplify complexity, as seen in case studies from Deloitte reports where similar visuals clarified market dynamics for stakeholders.
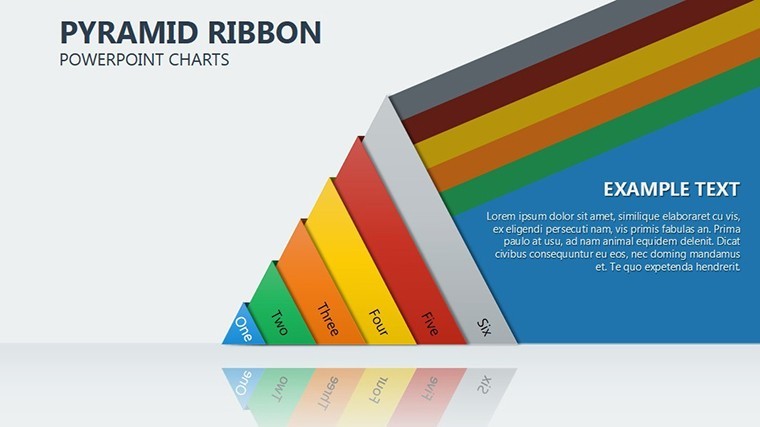
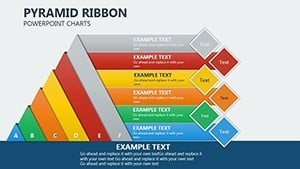
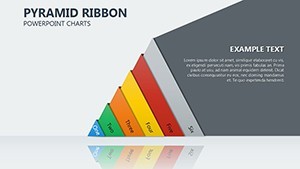
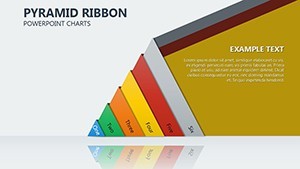
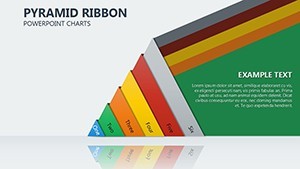
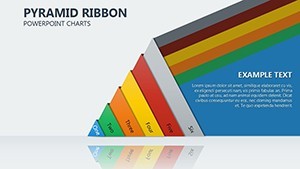
The ribbon design adds a fluid, modern twist, with gradients in earth tones and accents for depth, ensuring your presentations stand out in boardrooms or conferences. It's more than charts; it's a narrative tool that fosters understanding and decision-making.
Essential Features for Hierarchical Mastery
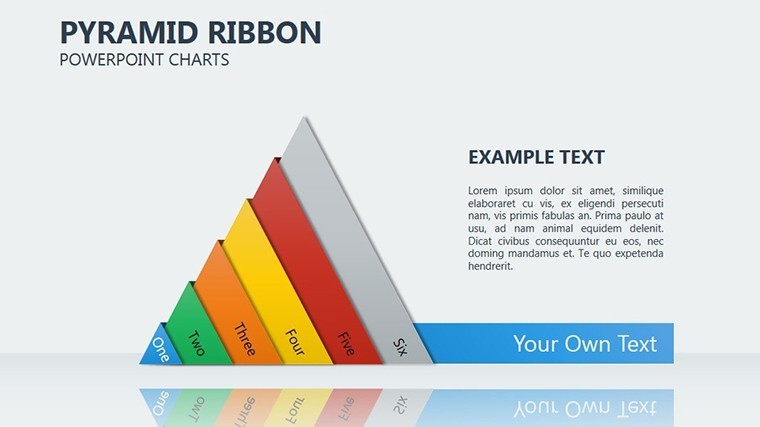
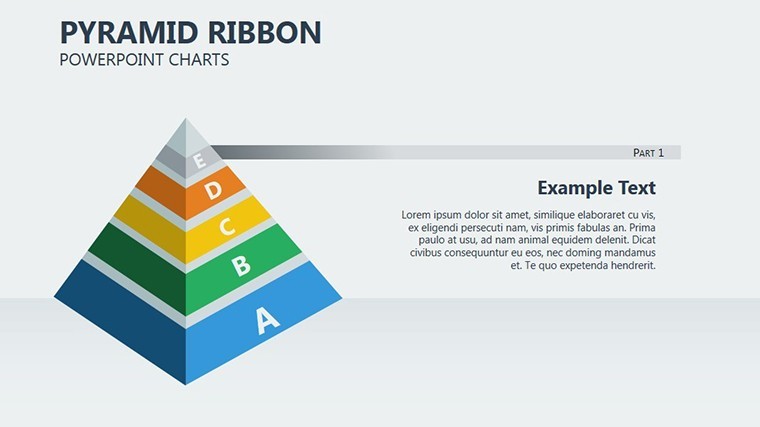
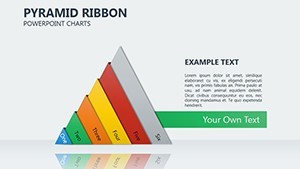
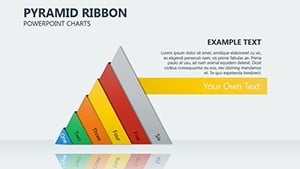
This template's strength lies in its versatile pyramid structures, enhanced by ribbon elements for smooth transitions between levels.
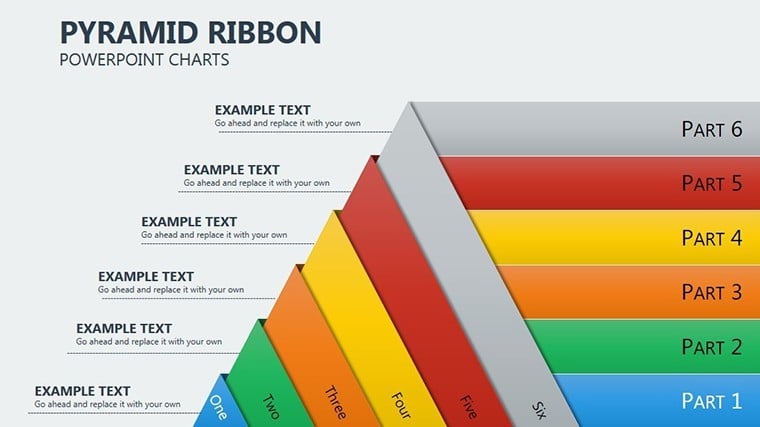
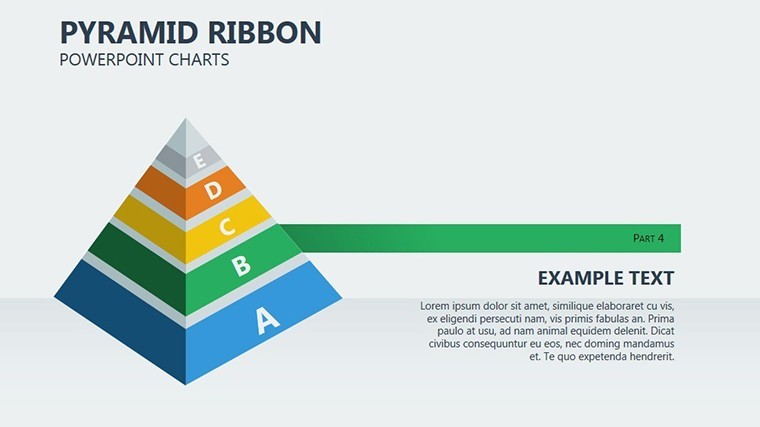
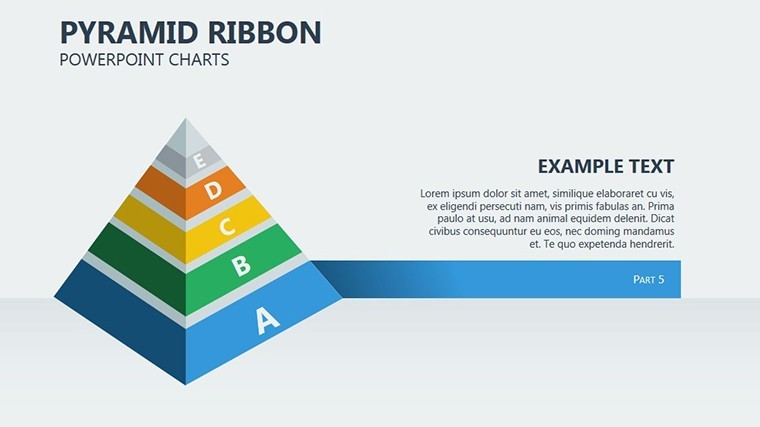
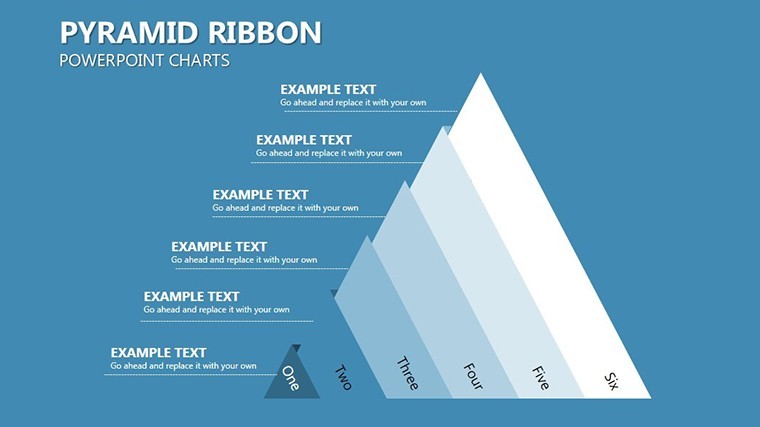
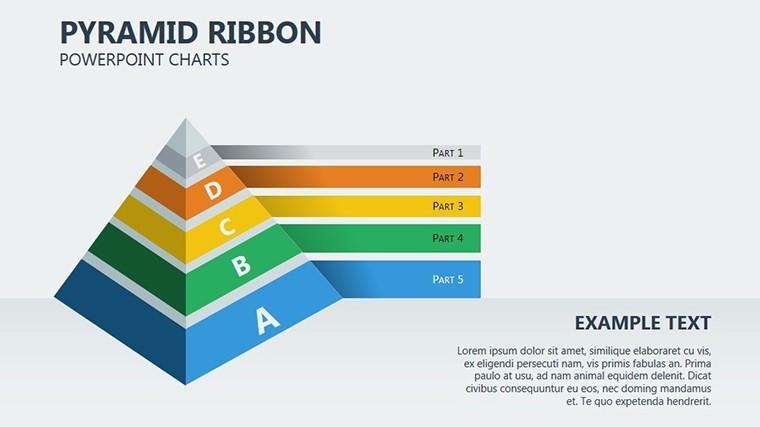
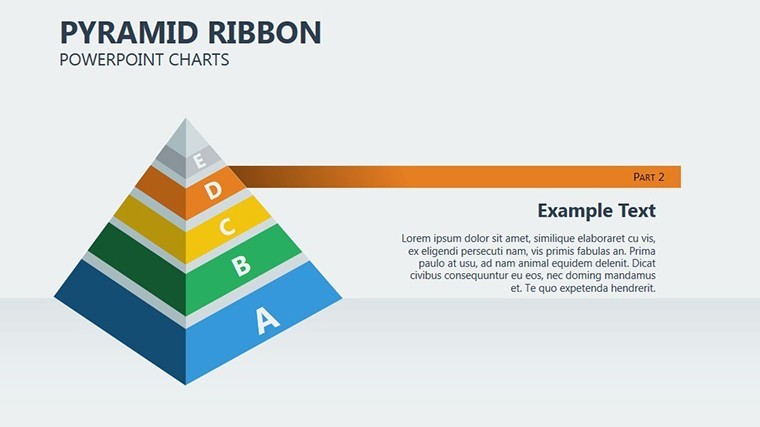
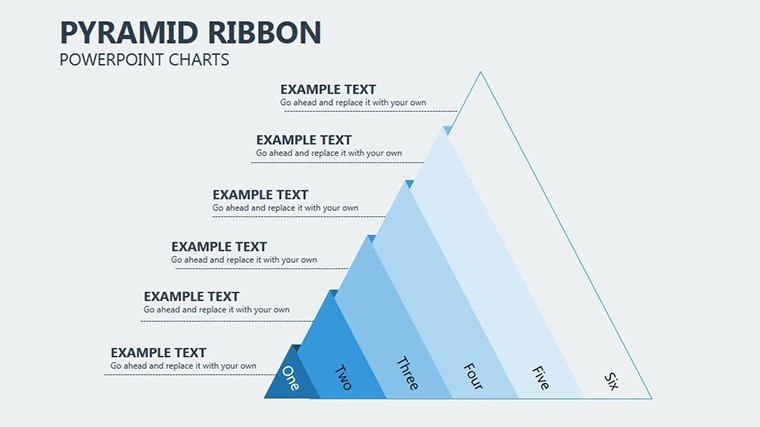
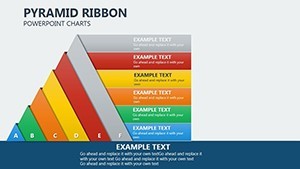
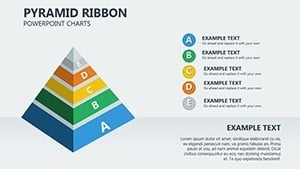
- Layered Pyramid Designs: Build from 3 to 7 tiers, customizable for specific factor prioritization in economic models.
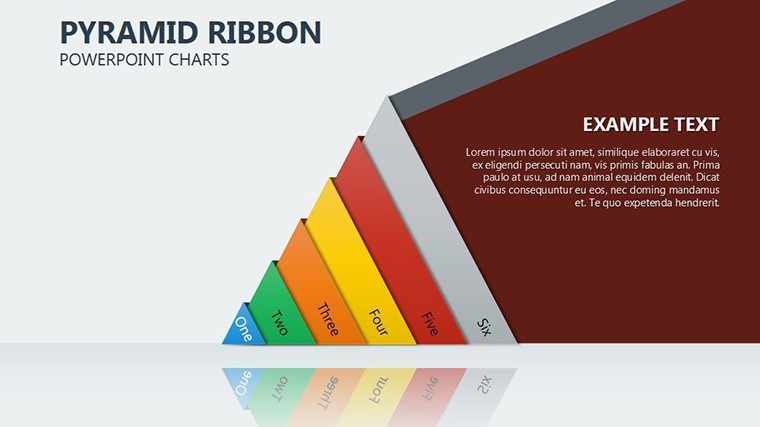
- Ribbon Connectors: Visual links that illustrate flow, perfect for showing progression in value chains.
- Data Integration: Embed metrics directly, with support for Keynote's charting tools to update dynamically.
- Custom Graphics: Includes thematic icons like ladders for ascent or bases for foundations, boosting engagement.
- Multiple Formats: Available in 16:9, 4:3, and 16:10 ratios for various display needs.
These align with authoritative design standards from the International Institute of Business Analysis (IIBA), ensuring professional-grade outputs.
In-Depth Slide Exploration
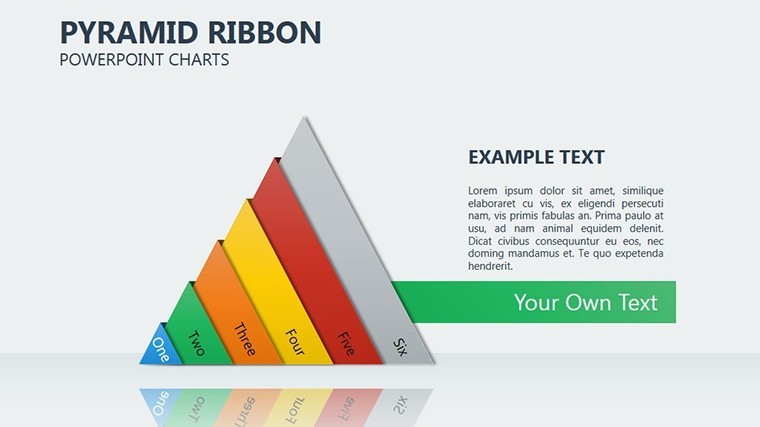
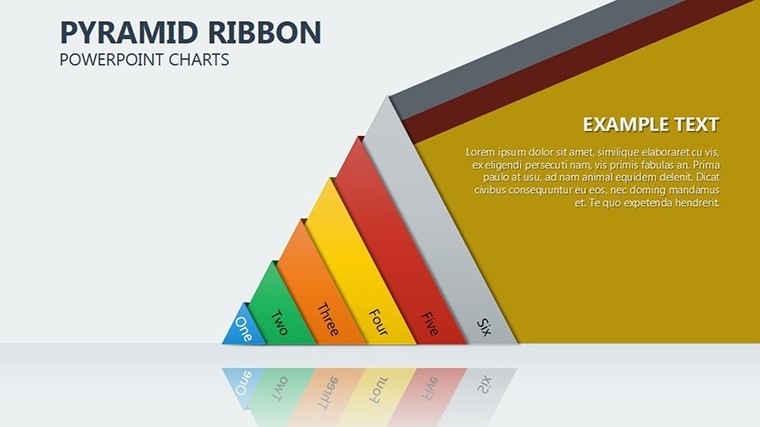
Among the 24 slides, early ones (1-4) introduce basic pyramids for quick overviews, such as outlining economic drivers in a startup pitch. Slides 5-12 expand to ribbon-enhanced versions, where you can detail factors like regulatory impacts on market patterns - think visualizing Porter's Five Forces with a hierarchical spin.
Advanced slides (13-20) incorporate multi-pyramid comparisons, useful for contrasting economic scenarios, e.g., pre- and post-policy changes. Slide 18 stands out with interactive ribbons that animate level-by-level, revealing insights progressively.
Concluding slides (21-24) offer summary and call-to-action templates, complete with placeholders for key takeaways, inspired by successful TED Talks on economic visualization.
Practical Use Cases in Economic Contexts
Apply this template to real challenges, like an economist at the World Bank using it to abstract global trade factors, focusing on tariffs and supply disruptions for policy recommendations.
In corporate settings, it shines for SWOT analyses, layering strengths atop opportunities in a pyramid to guide strategy. For educators, teach economic theories by building pyramids of supply-demand interactions, making lessons interactive.
- Identify Core Factors: List primary vs. secondary elements in your model.
- Structure the Pyramid: Assign levels based on importance, using ribbons for connectivity.
- Visualize and Refine: Add data, colors, and test for clarity.
- Deliver Insights: Present with confidence, abstracting noise for focused discussions.
This workflow addresses common issues like information overload, streamlining paths to enlightenment.
Pro Tips for Pyramid Perfection
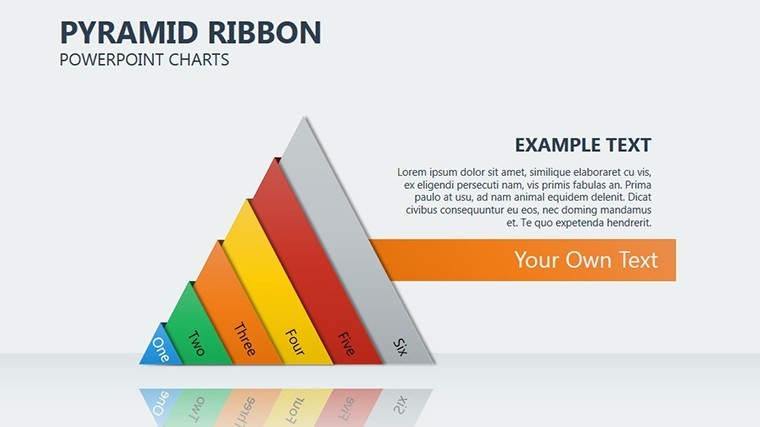
Balance levels for symmetry - too many tiers dilute impact. Use color psychology: warmer tones for base stability, cooler for aspirational peaks. Integrate with Keynote's morph transitions for seamless ribbon flows, enhancing storytelling.
Compared to standard Keynote pyramids, the ribbon addition provides narrative flow, turning static charts into dynamic tales - essential for engaging modern audiences.
Embrace Hierarchical Clarity Today
With its blend of form and function, this template upholds trustworthiness through editable precision and authoritativeness via proven models. Ready to abstract and accentuate? Secure your Pyramid Ribbon Charts now and redefine your economic narratives.
FAQ
How customizable are the pyramid levels?
Fully adjustable in Keynote, from tier count to ribbon styles, for precise model representation.
Is it suitable for non-economic uses?
Yes, adaptable for hierarchies in HR, project management, or education.
Can I add more ribbons?
Easily duplicate and modify elements to expand connectivity.
Does it support older Keynote versions?
Compatible with Keynote 6 and above, with full features in recent updates.
What data formats work best?
Excel imports or manual entry for metrics, ensuring accuracy.