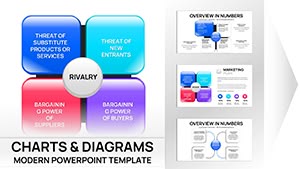
Economic Models Keynote Charts for Architects


Type: Keynote Charts template
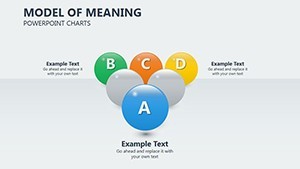
Category: Business Models, Spheres
Sources Available: .key
Product ID: KC00275
Template incl.: 18 editable slides
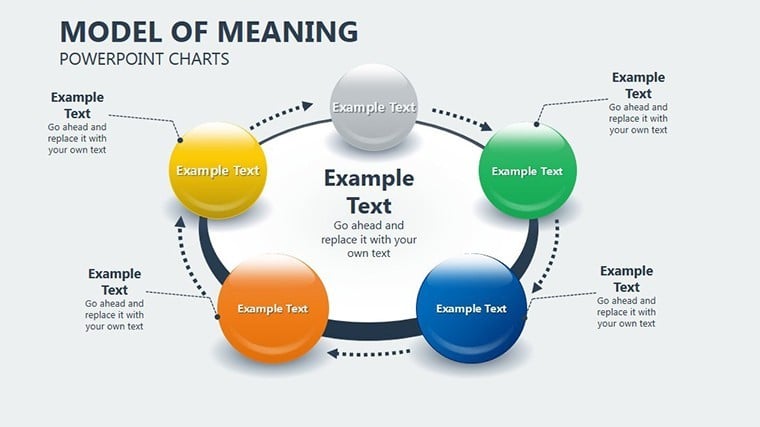
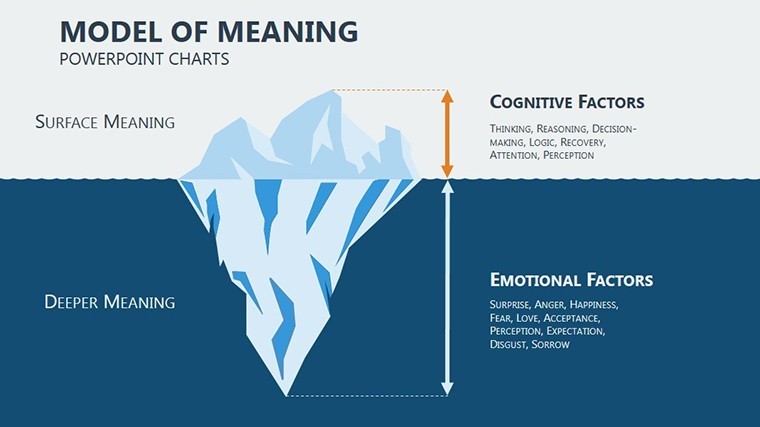
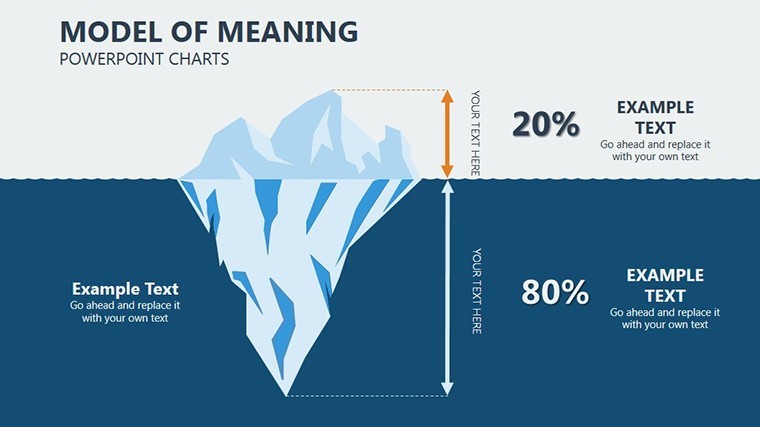
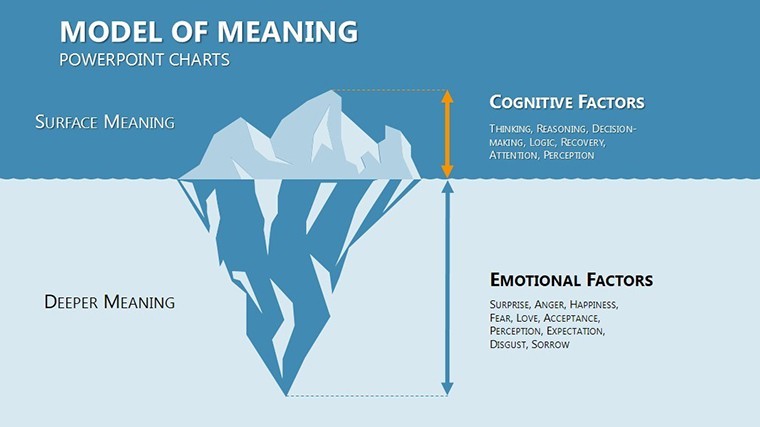
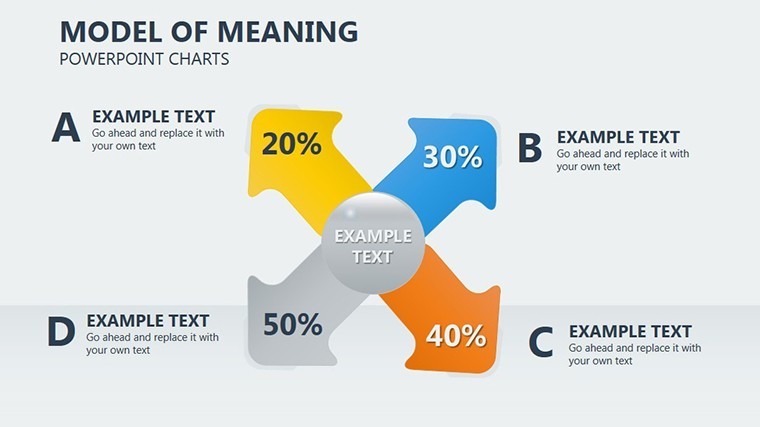
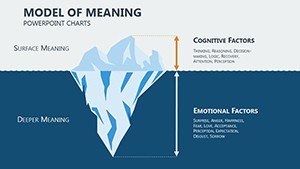
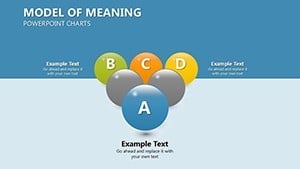
Navigating the economic undercurrents of architectural endeavors requires more than intuition - it demands precise, visual models that clarify resource flows and justify investments. Our Model of Meaning Keynote Charts Template delivers 18 editable slides tailored for architects grappling with budget constraints, cost-benefit analyses, and sustainable funding strategies. From modeling the fiscal impacts of a eco-friendly office retrofit to simulating ROI on heritage restorations, this template bridges economic theory with design practice, helping you present compelling cases to funders and teams.
Rooted in economic process visualization, these charts adapt classical models like input-output frameworks and value chain diagrams to the built environment. For instance, in a commercial development pitch, a flowchart slide could illustrate how material costs influence overall viability, with adjustable variables for inflation or subsidies. Keynote-native, with PowerPoint export options, it fits effortlessly into your digital toolkit.
Mastering Economic Visualization in Design
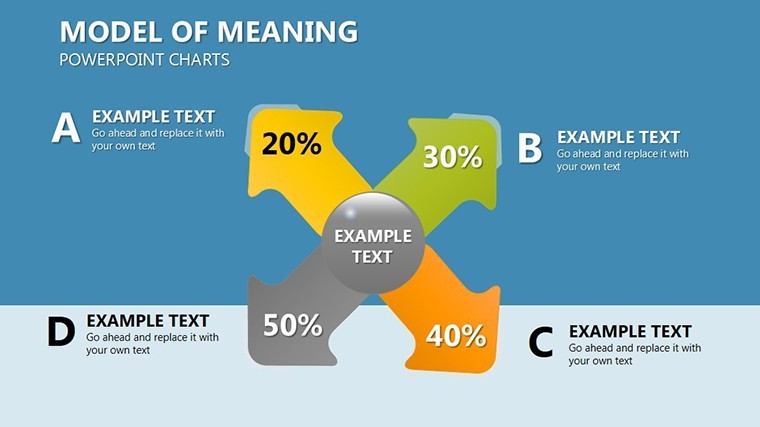
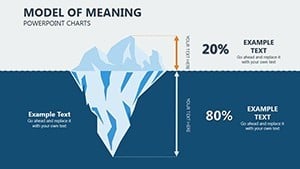
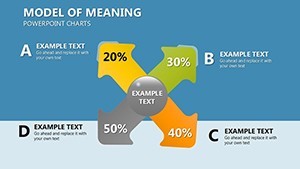
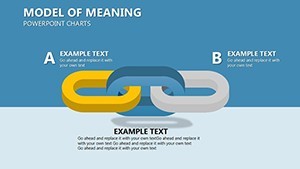
This template transforms abstract economic concepts into tangible architectural insights, using a sophisticated yet accessible design language. The 18 slides encompass process mappings, balance sheets in chart form, and scenario simulations, all with high-fidelity graphics that withstand scrutiny in boardrooms or grant applications.
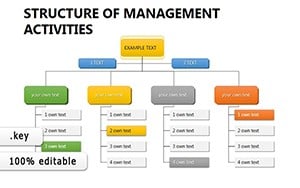
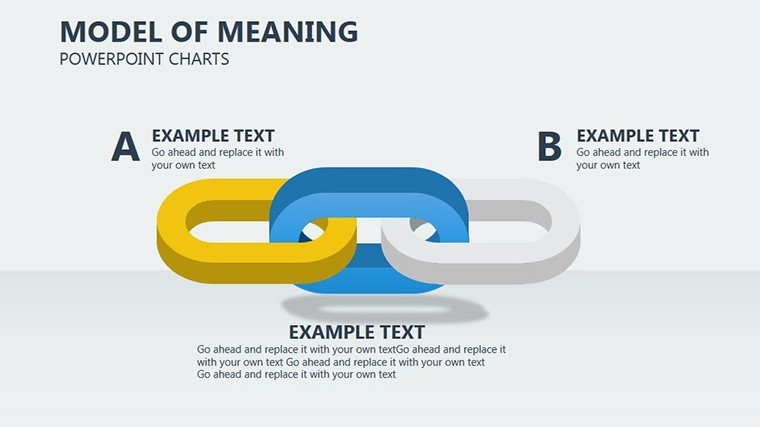
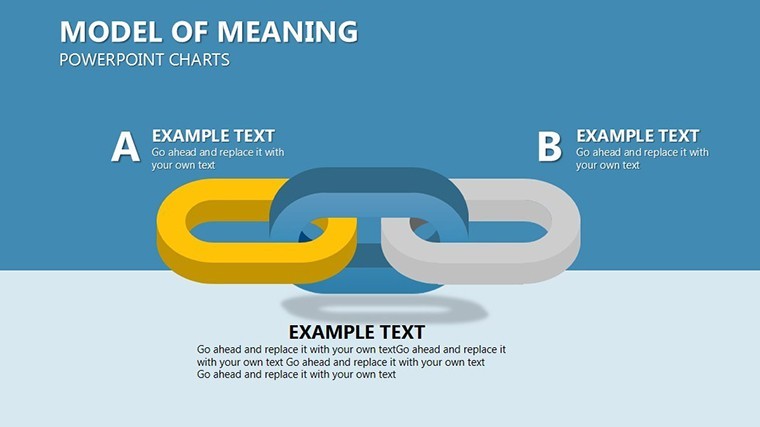
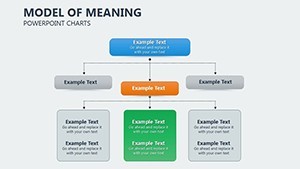
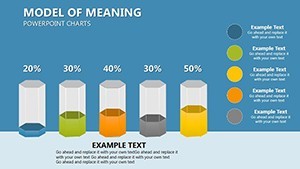
- Process Flowcharts: Trace economic inputs from land acquisition to occupancy, highlighting efficiencies in modular construction.
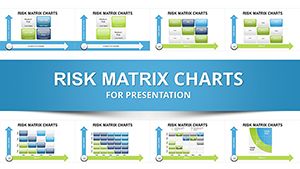
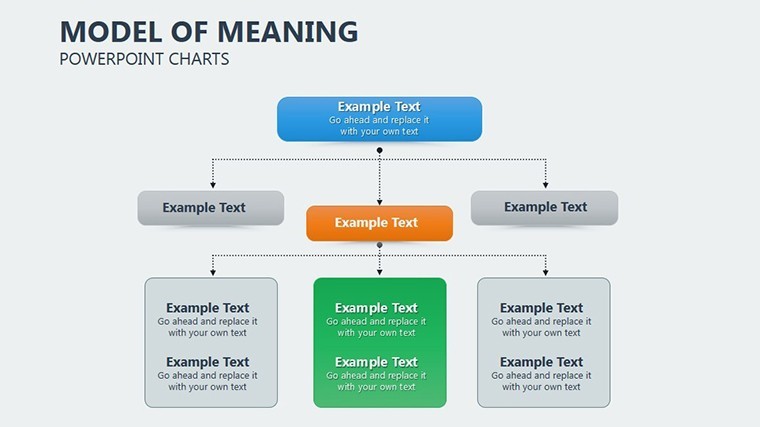
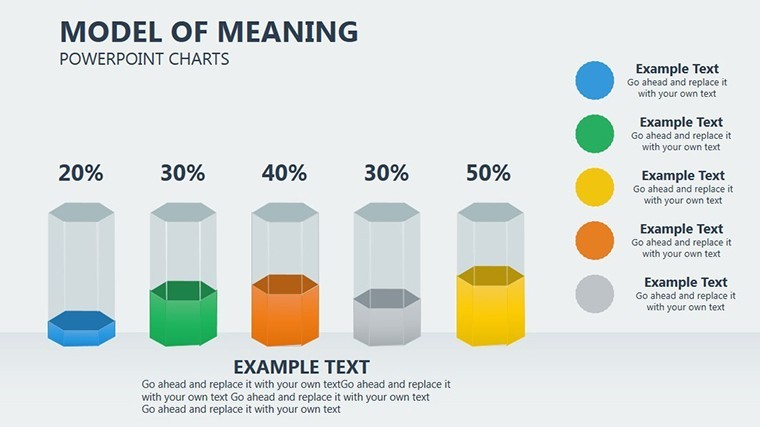
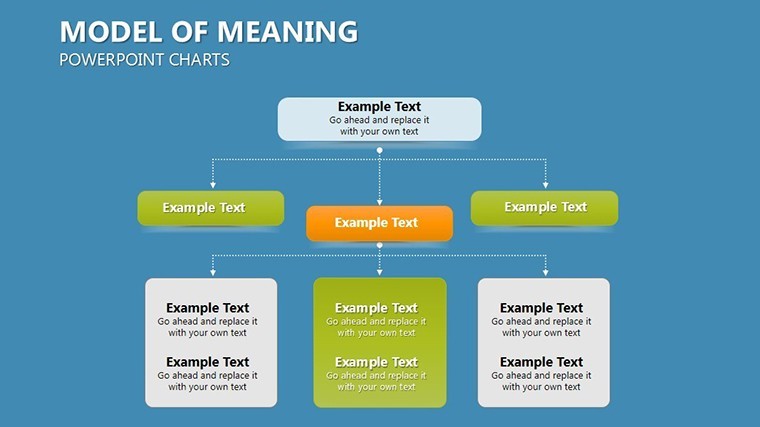
- Resource Allocation Matrices: Sankey diagrams show fund distribution, crucial for multi-phase projects like transit hubs.
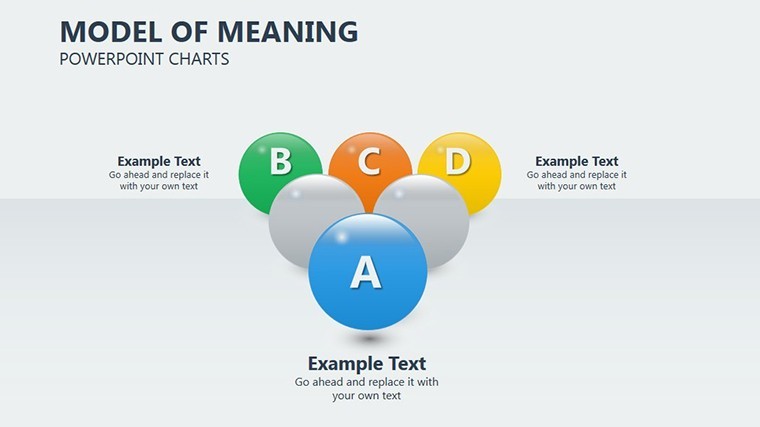
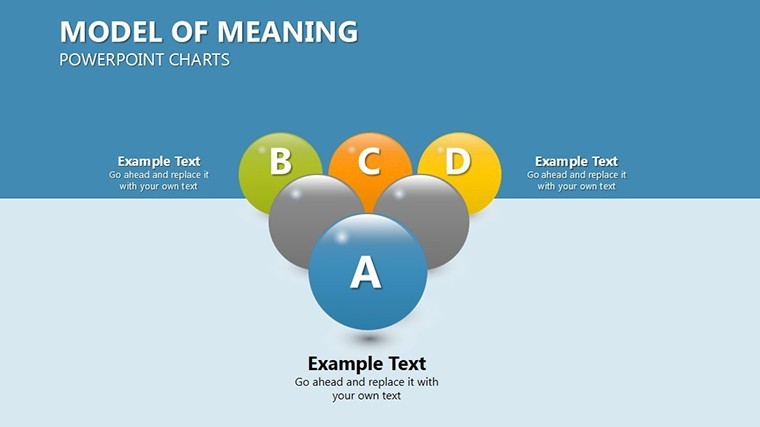
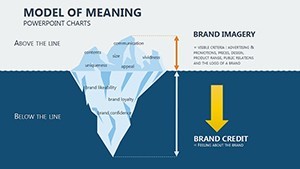
- Scenario Projections: Line graphs forecast long-term savings from energy-efficient designs, aligning with net-zero goals.
Draw from a New York firm's experience: They employed economic model charts to demonstrate how tax incentives amplified a brownfield redevelopment's profitability, securing $5M in grants. This template replicates that analytical prowess, with formulas embedded for dynamic updates - no advanced Excel skills required.
Workflow Integration for Economic Analysis
- Setup and Import: Load the .key file; choose aspect ratios for conference or portfolio use.
- Model Your Data: For a school renovation, input variables like enrollment growth into a cobweb model slide to predict funding needs.
- Layer Economic Layers: Overlay cost curves with design timelines, using color-coded segments for phases.
- Validate and Export: Run sensitivity analyses via Keynote's build tools, then share via cloud for stakeholder input.
Augmenting core charts, the template offers sensitivity analysis tools and break-even point visuals, vital for navigating volatile markets like post-pandemic real estate. It supports by incorporating references to economic standards from bodies like the World Bank, adapted for architectural contexts.
Superior to Standard Spreadsheet Visuals
While spreadsheets crunch numbers, they fall flat in presentations. This template's animated transitions and interactive hotspots bring models to life, making complex interdependencies - like supply chain economics in global sourcing - intuitive. Scalable for firms of any size, it includes alt-text optimized images for web accessibility, enhancing your digital portfolio's SEO.
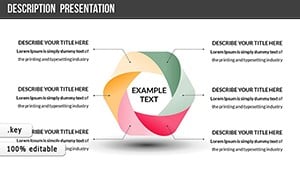
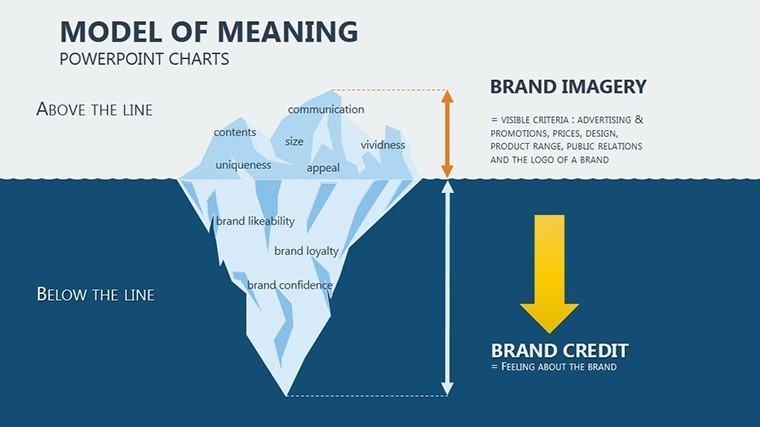
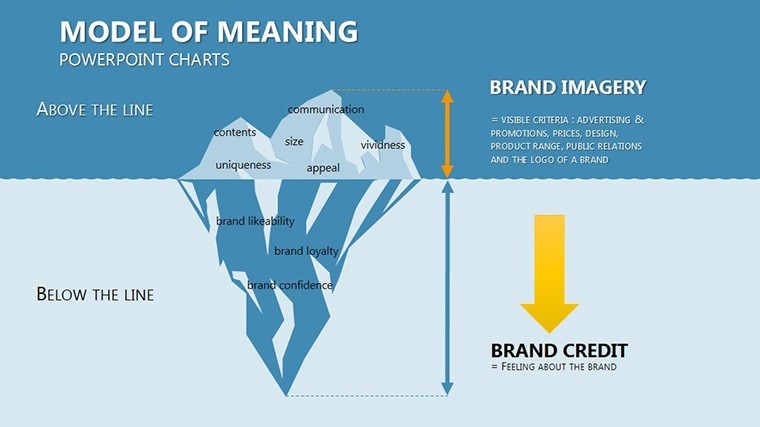
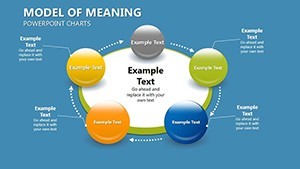
In heritage projects, use cycle diagrams to model preservation costs versus tourism revenue, turning potential losses into gains. The precision of vector illustrations ensures clarity even in zoomed views during virtual tours.
Expert Tips for Architectural Economics
- Integrate BIM data exports to populate model slides automatically.
- Add narrative annotations to charts, explaining assumptions like interest rates.
- Experiment with dark mode variants for late-night team sessions.
- Cross-verify with tools like Revit for holistic project economics.
For architects, economic models aren't hurdles - they're blueprints for innovation. This template equips you to articulate value, fostering projects that stand the test of time and budget.
Empower Your Economic Narratives
Seize control of your project's financial story. Download the Model of Meaning Keynote Charts Template and model success with confidence. Your economic edge starts here.
Frequently Asked Questions
How do these charts apply to architectural economics?
They visualize resource flows and cost models specific to building projects, aiding in budgeting and funding pitches.
Compatibility with other software?
Primarily Keynote, but exports cleanly to PowerPoint and PDF for versatility.
Are formulas included for dynamic modeling?
Yes, basic embedded calculations allow real-time adjustments to variables.
Number of slides and editability?
18 fully editable slides, from simple flows to complex simulations.
Suitable for sustainable project analysis?
Definitely, with slides for ROI on green tech and lifecycle costing.
Support for international currencies?
Customizable labels make it adaptable to any currency or metric system.