Process Cycle Charts Keynote - Fully Editable | ImagineLayout


Type: Keynote Charts template
Category: Cycle
Sources Available: .key
Product ID: KC00262
Template incl.: 18 editable slides
18 Process Charts: Files Included
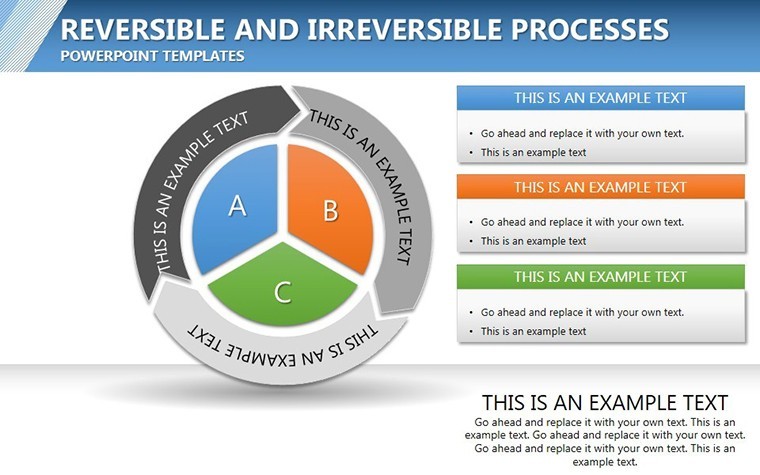
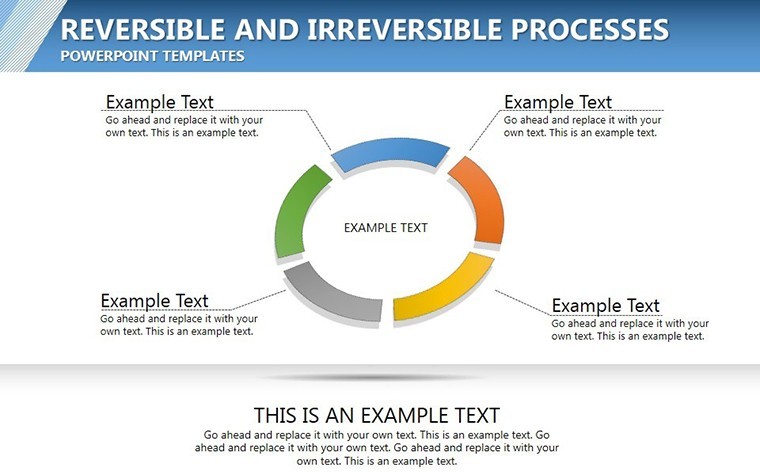
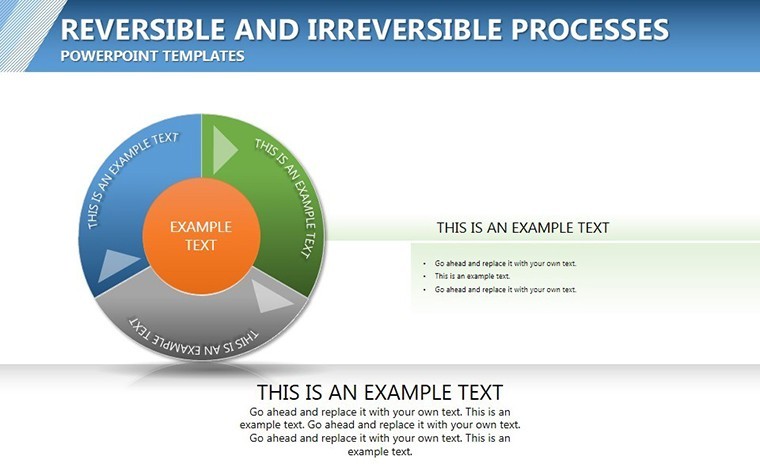
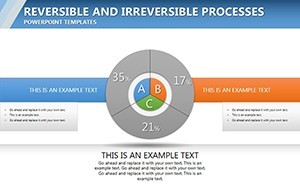
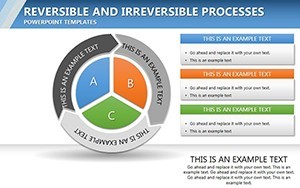
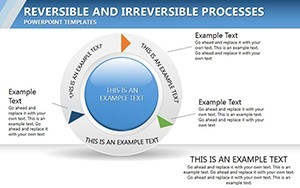
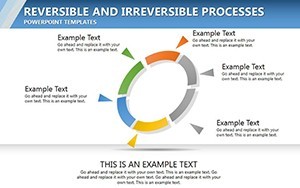
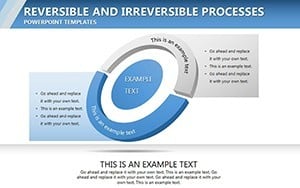
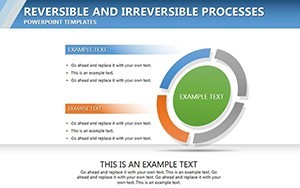
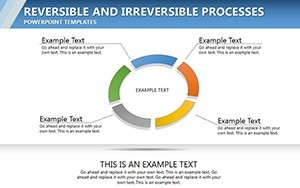
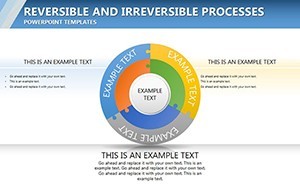
18 cycle diagrams come in one .key file with over 50 icons included.
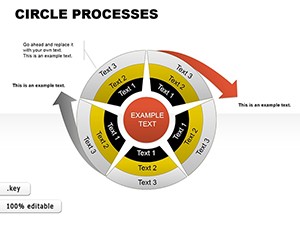
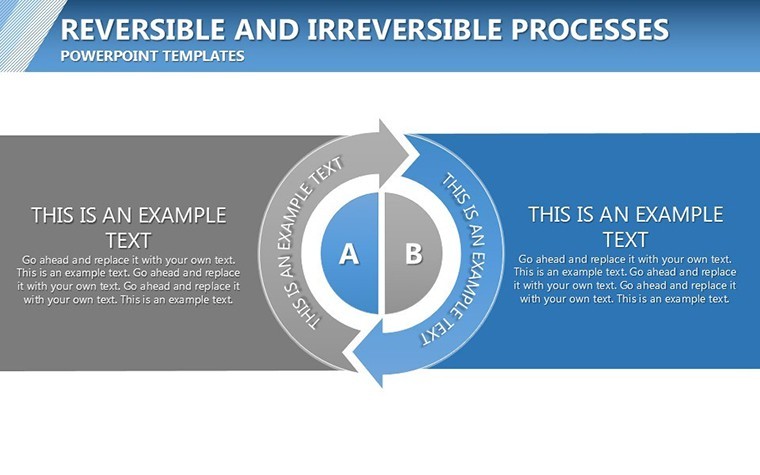
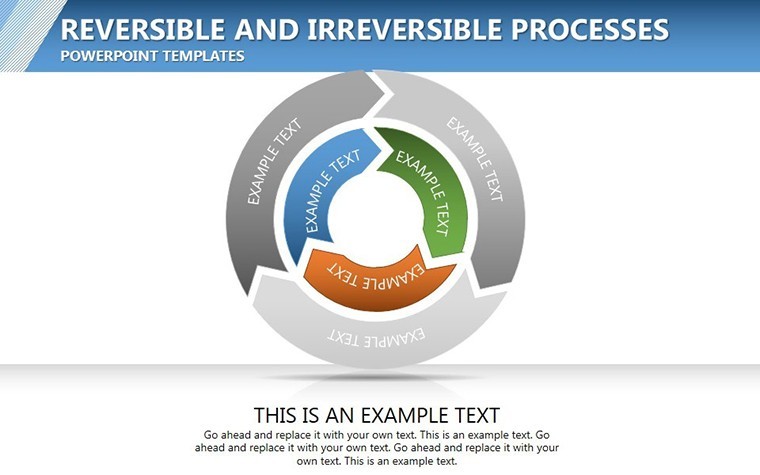
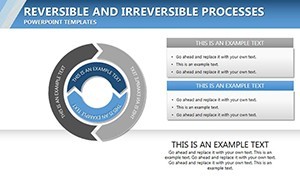
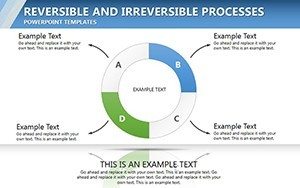
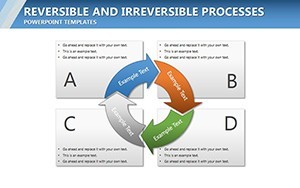
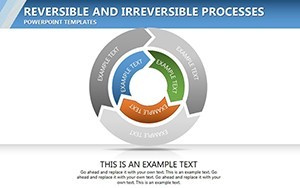
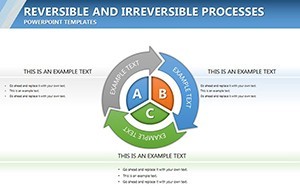
Color-coded pathways mark reversible steps in blue and irreversible in red.
- 18 editable cycles
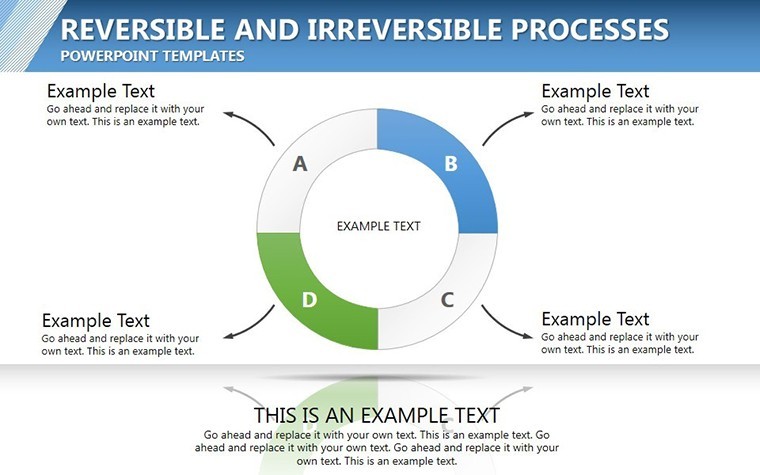
- Arrow direction controls
- Animated step transitions
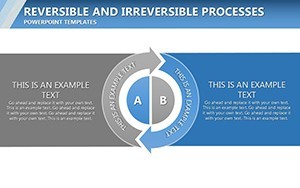
This set differs from the related Circle Processes Keynote Charts because it separates reversible from irreversible flows on the same slide. One specific visual characteristic is the contrast zones that divide phases without extra shapes. It works best for engineers who present thermodynamic cycles since the arrow flow direction instantly signals process type.
The paid version includes the full set of 18 charts with animation while sample files omit the themed icons.
Format and Compatibility Details
| Feature | Details |
|---|---|
| Slides included | 18 covering reversible and irreversible variants |
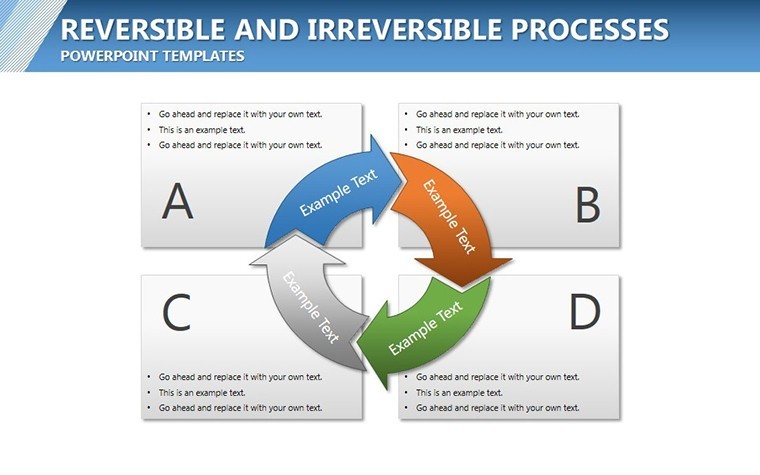
| Diagram categories | Cycle arrows and process icons |
| Editable elements | Path colors, arrow weights and icon fills |
| PowerPoint compatibility | None - Keynote only |
| Color themes | Slide master palette updates all cycles |
| Animation support | Step-by-step triggers remain live |
How to Make It Yours in Under 20 Minutes
Open the file. Moderate skill level.
- Update process labels - 3 minutes
- Recolor pathways for your data - 2 minutes
- Swap icons from the set - 4 minutes
- Export for the lecture - 1 minute
Who Reaches for This Template
Engineers in energy firms prepare the board briefing and finish in 35 minutes.
Educators reuse the file across semesters by changing only the arrow labels.
Download now to visualize your next process flow.
The Cost of Not Using a Template
Manual cycle diagrams drift out of alignment after the first text edit.
This version uses flow direction to keep every arrow meaningful on large screens.
Trainers combine these cycle charts with Business Process Management Keynote Charts for full strategy sessions.
Financial analysts reach for the template in quarterly reviews because the color zones match their reporting style.
Download the template now and start editing in minutes.
Which Keynote versions does this open in?
The .key file works in Keynote 12 and all newer releases on Mac and iPad. Earlier versions may lose animation triggers. Open the file once and the slide master loads automatically so no manual import is required. Test the rotation on your device before the meeting to confirm every cog moves on click. If any issue appears simply contact support within the first week.
How do I change the color scheme?
Select any gear on the slide. Open the Format panel on the right. Click the color picker and choose your brand hex code. The change applies to the entire cluster because the elements share the slide master theme. Repeat for one cog only if you need contrast zones. The thin connectors update automatically so layout stays intact.
Can I use this in paid client work?
Yes the license covers unlimited client projects. You may deliver the final exported PDF or Keynote file to the client. Resale of the original .key template itself is not permitted. Sublicensing to another designer is also prohibited. Keep the source file for your own firm only.
What does the paid version include that the free version does not?
The paid version unlocks all 28 diagrams with working animations and branching connectors. Sample previews available elsewhere contain only static images without editable layers. Full icon set and color theme adjustments are exclusive to the purchased file. You receive the complete .key package instantly after payment.
What software is required to open the file?
Keynote is the only application that opens the .key format. PowerPoint cannot import it directly. Install the latest Keynote from the App Store if you do not have it. The file size is small enough to email or store on any device. No additional fonts or plugins are needed.
What is the refund policy?
Refunds are available within 14 days if the file fails to open in your version of Keynote. Provide the receipt and a short description of the issue. The team issues the refund within 48 hours once verified. No refund is possible after the file has been edited or exported.