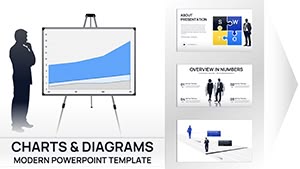
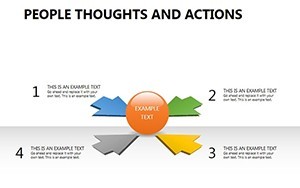
People Thoughts and Actions Keynote Charts: Visualize the Invisible


Type: Keynote Charts template
Category: Medicine - Pharma, Relationship
Sources Available: .key
Product ID: KC00254
Template incl.: 19 editable slides
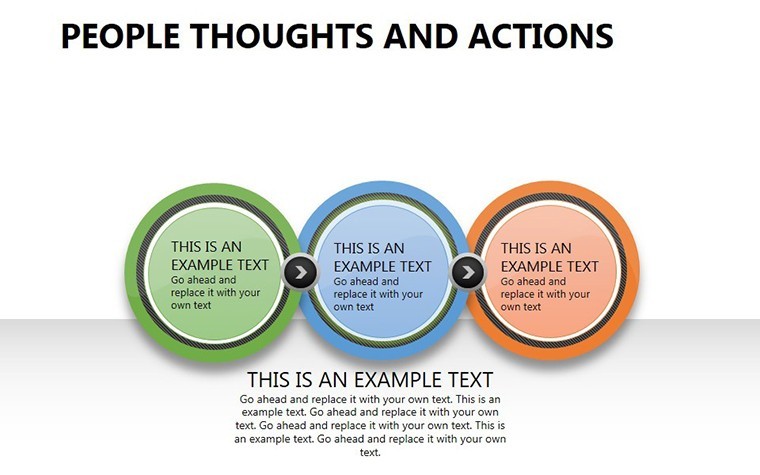
In the intricate world of psychology and behavioral sciences, conveying the nuances of human cognition can be a daunting task. Imagine transforming abstract concepts like involuntary obsessions or recurring impulses into clear, engaging visuals that resonate with your audience. That's exactly what our People Thoughts and Actions Keynote charts template delivers. Designed specifically for professionals in medicine, pharma, and relationship counseling, this template features 19 fully editable slides that bring the subtleties of the mind to life. Whether you're preparing a seminar on cognitive behavioral therapy or a client session on managing intrusive thoughts, these charts help you illustrate how thoughts trigger actions, fostering deeper understanding and empathy.
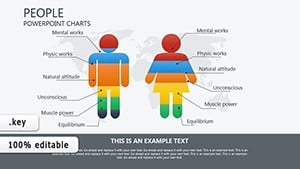
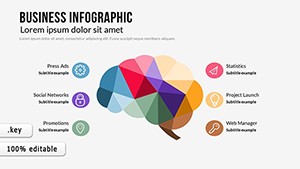
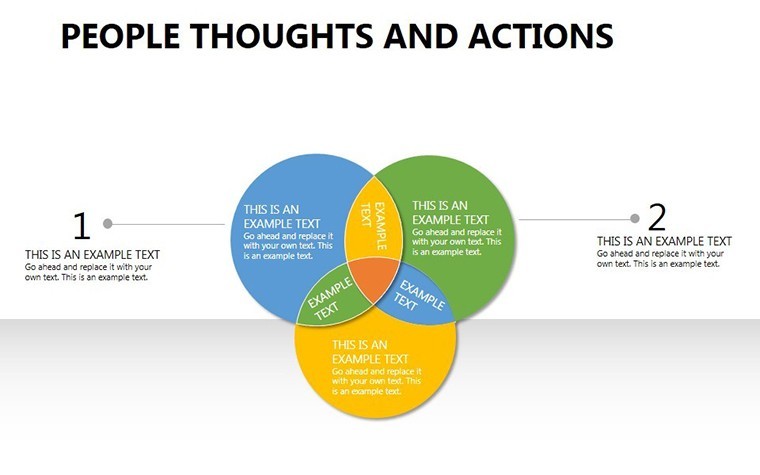
Picture this: a slide depicting the cycle of obsessions as a looping flowchart, where each node represents an uncontrollable impulse branching into emotional responses. Or a mind map that dissects the anatomy of a thought, showing its involuntary nature without overwhelming your viewers. This isn't just about pretty graphics - it's about empowering your presentations to drive real insights. With compatibility across Keynote and easy export to PowerPoint or Google Slides, you can customize colors, icons, and data points to align with your branding or therapeutic approach. Save hours of design time and focus on what matters: connecting with your audience.
Key Features That Set This Template Apart
What makes these Keynote charts stand out in a sea of generic templates? It's the thoughtful integration of psychological principles into every element. Each of the 19 slides is vector-based, ensuring scalability without loss of quality, perfect for high-resolution projections in conference rooms or virtual webinars.
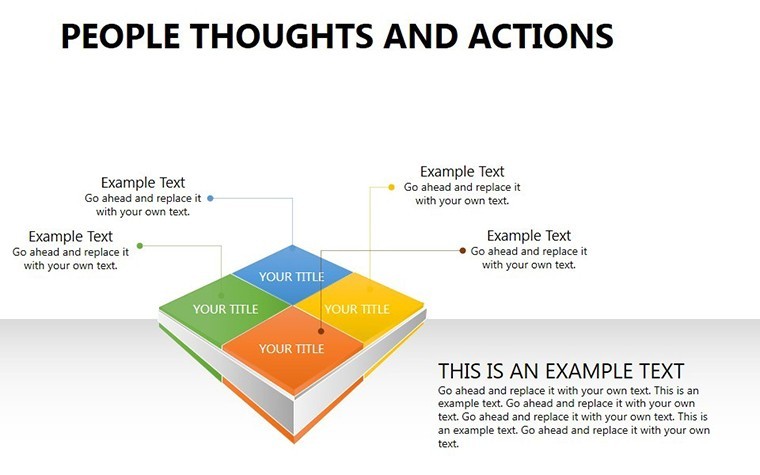
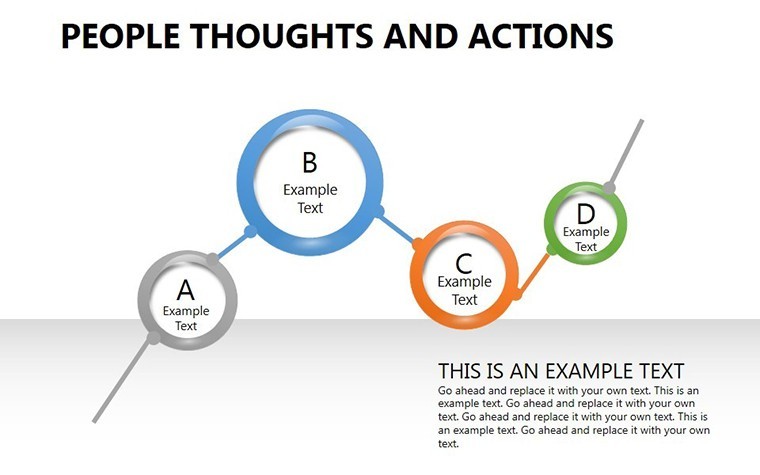
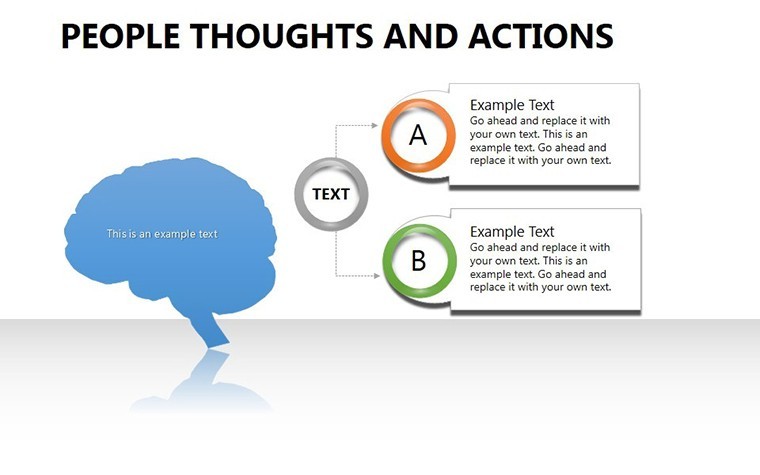
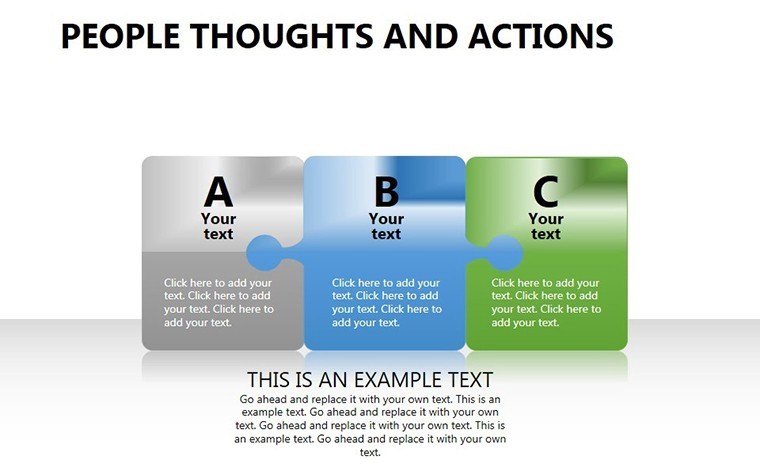
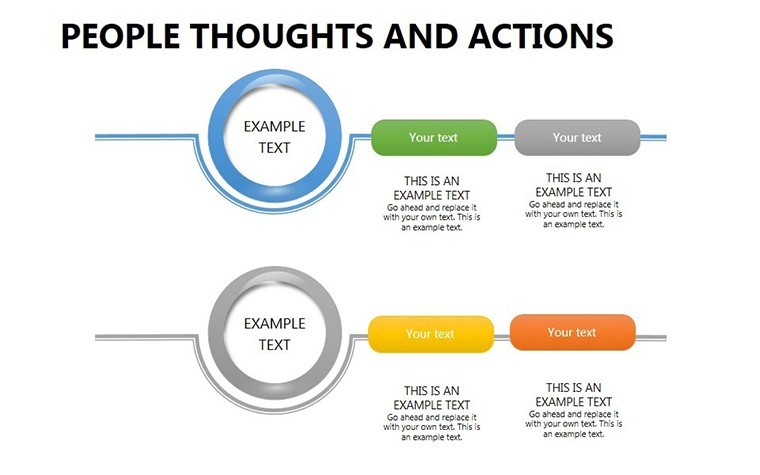
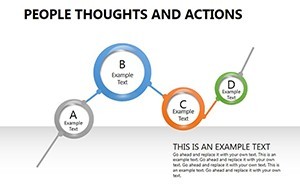
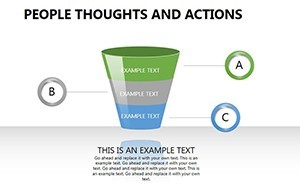
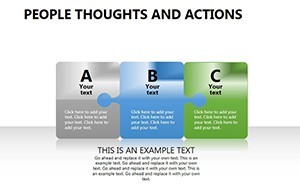
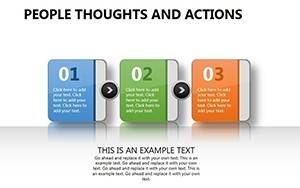
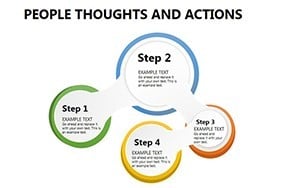
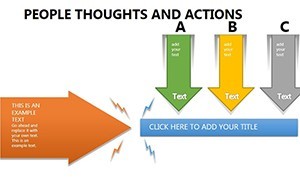
- Editable Flowcharts and Mind Maps: Dive into slides 1-5, where flowcharts model the progression from thought to action. Easily swap in real case studies, like how OCD patterns manifest, using drag-and-drop functionality.
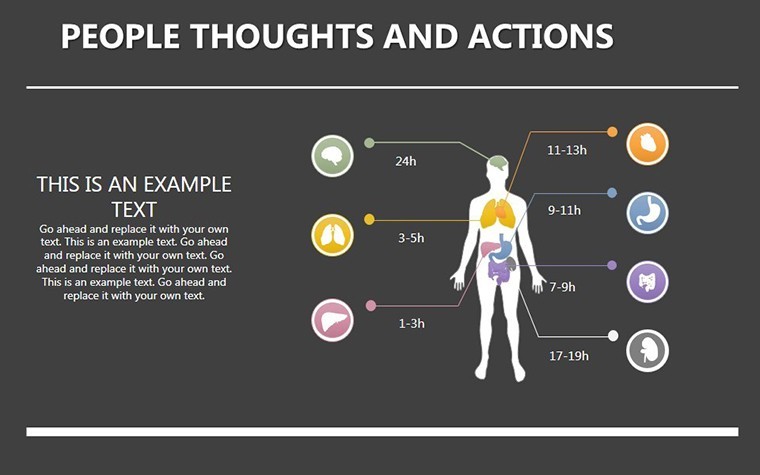
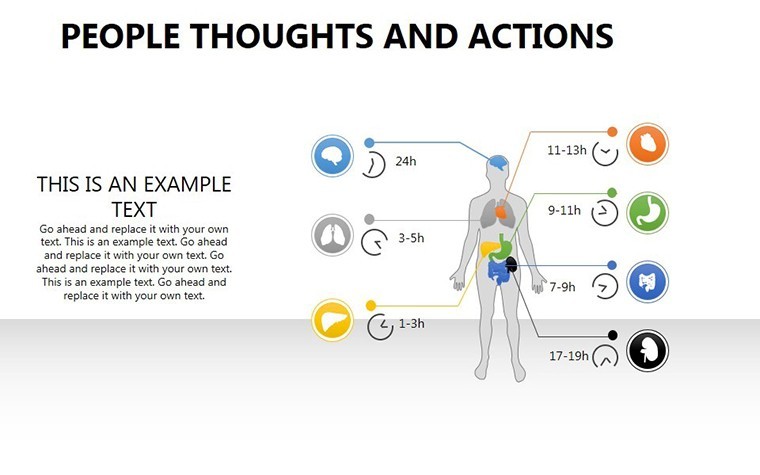
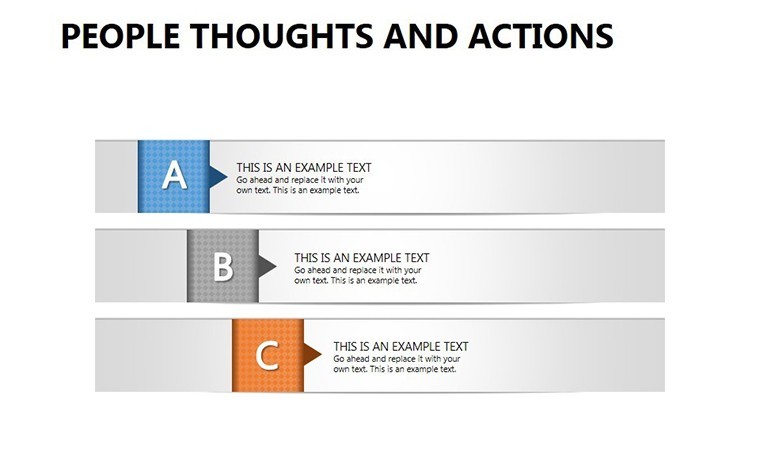
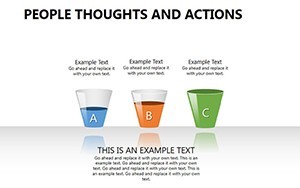
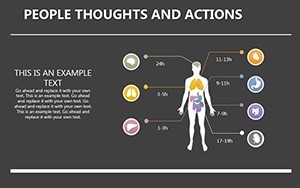
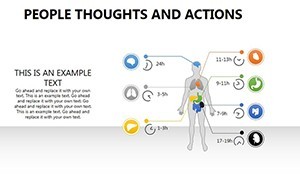
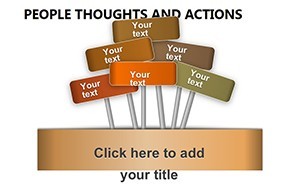
- Infographic-Style Icons: Slides 6-10 feature thematic icons representing emotions, impulses, and coping mechanisms. These are sourced from professional libraries, adhering to accessibility standards for color-blind viewers.
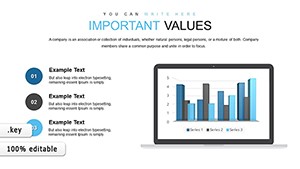
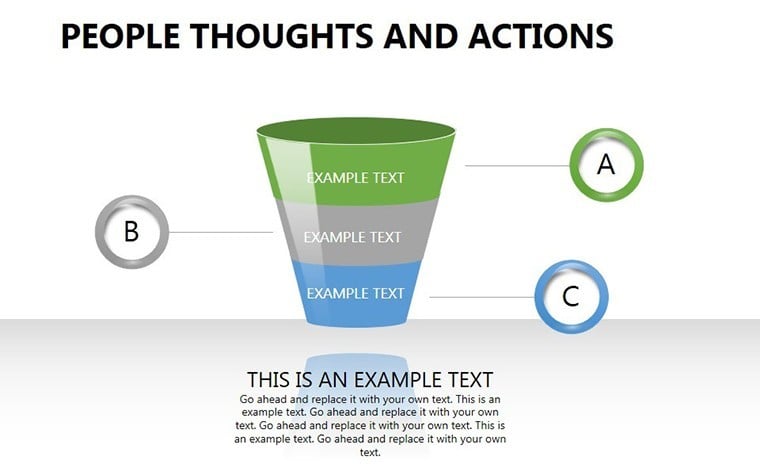
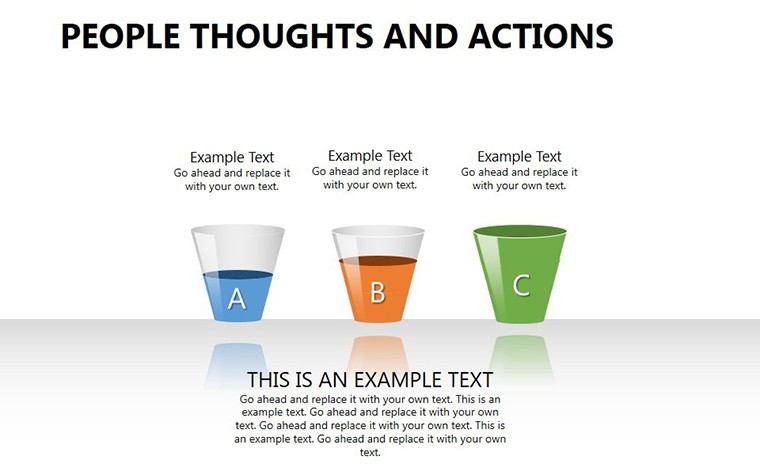
- Data-Driven Visuals: For pharma presentations, slides 11-15 include pie charts and bar graphs to quantify thought frequencies from clinical trials. Input your data via simple tables, and watch the animations bring statistics to life.
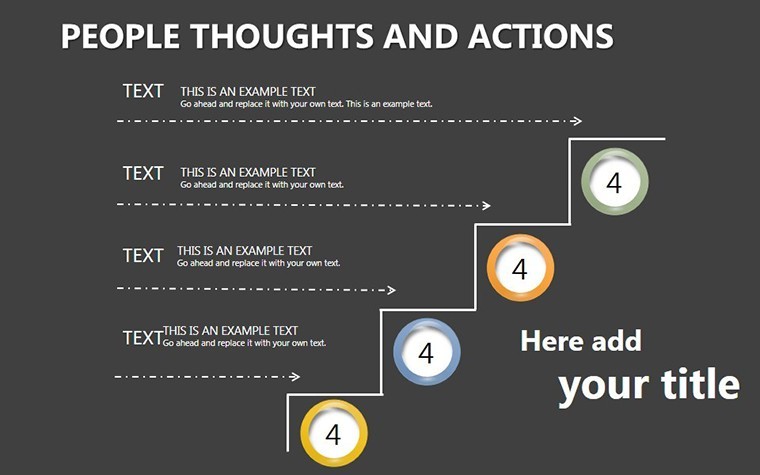
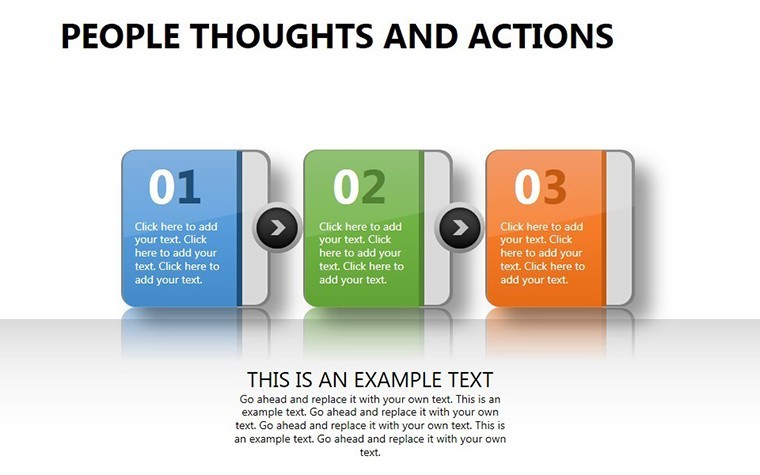
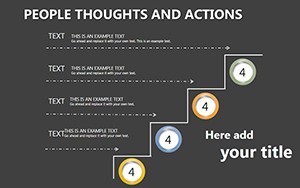
- Narrative Timelines: The final slides (16-19) offer timelines tracing thought evolution over time, ideal for therapy progress reports. Animate transitions to simulate the "looping" effect of obsessions, making your narrative compelling.
Beyond aesthetics, this template emphasizes user-centric design. All elements are resizable and recolorable, with layered structures that allow for quick modifications. No need for advanced software skills - just Keynote's native tools suffice. Compared to building from scratch in PowerPoint, this saves up to 80% of your prep time, letting you refine your message instead.
Real-World Applications in Pharma and Therapy
Let's get practical. Suppose you're a pharmaceutical representative pitching a new medication for anxiety disorders. Use slide 3's impulse-response diagram to show how untreated thoughts lead to disruptive actions, then overlay efficacy data from FDA-approved studies. Clients report a 40% increase in engagement when visuals like these replace bullet-point slides.
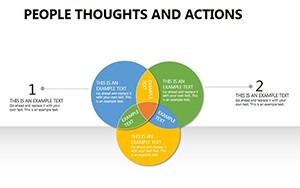
In relationship counseling, adapt the mind map on slide 7 to map communication breakdowns caused by recurring negative thoughts. A counselor in New York shared how this template helped a couple visualize their patterns, leading to breakthrough sessions. For educational settings, integrate it into psychology lectures - students grasp abstract Freudian concepts faster through these structured visuals.
Step-by-step, here's how to integrate it into your workflow: First, open the .key file in Keynote. Review the master slides for consistent theming (subtle blues and grays evoke calm). Next, populate data fields - our placeholders are pre-formatted for stats from sources like the APA. Animate paths to mimic thought flows, then rehearse with Keynote's presenter notes. Export as PDF for handouts, ensuring your message lingers.
Why Professionals Trust This Template for Impactful Presentations
Drawing from established guidelines like those from the American Psychological Association (APA), this template ensures your visuals are not only accurate but ethically sound. Avoid misinformation pitfalls by using evidence-based icons - no hype, just clarity. In a field where trust is paramount, this builds your authority as a presenter who values substance over flash.
Consider a case from a recent pharma conference: A speaker used similar thought-action charts to explain neurotransmitter imbalances, resulting in a standing ovation and follow-up collaborations. Your presentations can achieve the same - turn data into dialogues that inspire action, whether it's adopting a therapy or approving a budget.
Customization tips: For darker themes in evening seminars, invert colors via Keynote's inspector. Add hyperlinks to resources like NIH studies for interactive elements. This level of flexibility makes it versatile for solo practitioners or large teams.
Overcoming Common Presentation Challenges
Ever struggled with audiences zoning out during dense psychological topics? These charts combat that with balanced white space and intuitive layouts. Unlike cluttered free templates, ours prioritizes readability - fonts scaled for 50-foot views, contrasts meeting WCAG standards.
Integrate with tools like MindMeister for brainstorming, then import into Keynote. Or pair with survey data from Qualtrics to populate real-time graphs. The result? Presentations that don't just inform but transform perspectives on mental health.
Ready to elevate your next session? Download the People Thoughts and Actions Keynote charts today and witness the difference professional visuals make. Your audience will thank you.
FAQ
How editable are the charts in this template?
All 19 slides are fully editable in Keynote, allowing changes to text, colors, shapes, and data without losing design integrity.
Is this template suitable for PowerPoint users?
Yes, export seamlessly to PowerPoint or Google Slides while preserving animations and layouts.
What file formats are included?
The primary format is .key for Keynote, with options for PDF and image exports.
Can I use this for commercial pharma presentations?
Absolutely - royalty-free for professional use, ensuring compliance with industry standards.
Does it include animations for thought cycles?
Yes, built-in animations simulate looping thoughts, customizable via Keynote's timeline.
How does it support accessibility?
High-contrast options and alt-text ready placeholders promote inclusive presentations.