8-Stage Volume Cyclic Keynote Charts Template


Type: Keynote Charts template
Category: Cycle
Sources Available: .key
Product ID: KC00230
Template incl.: 26 editable slides
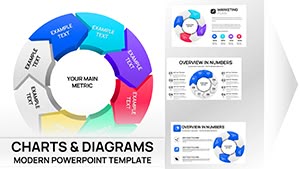
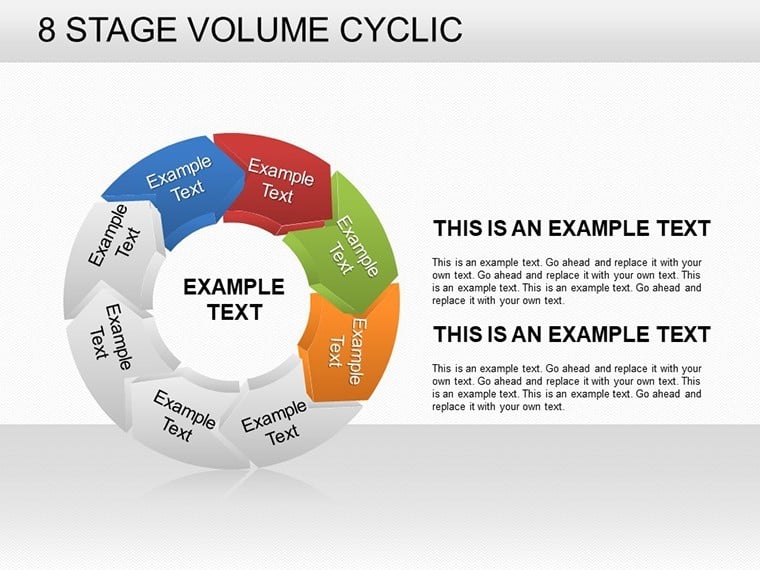
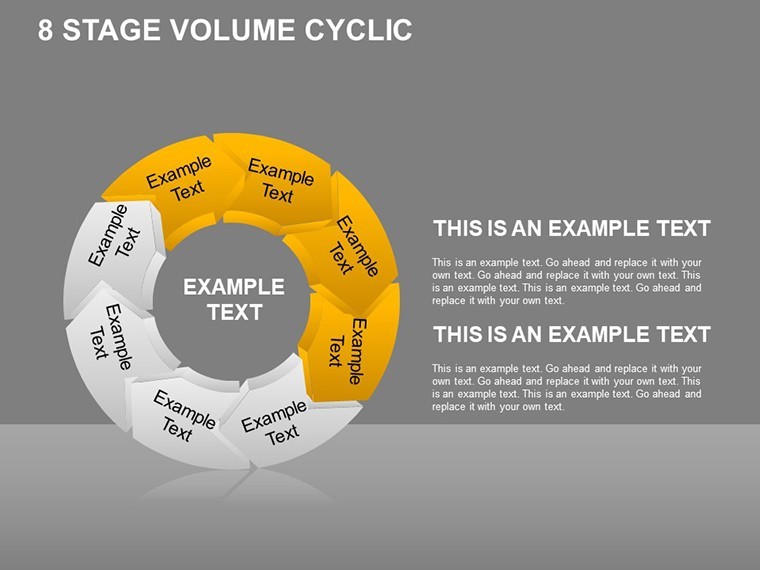
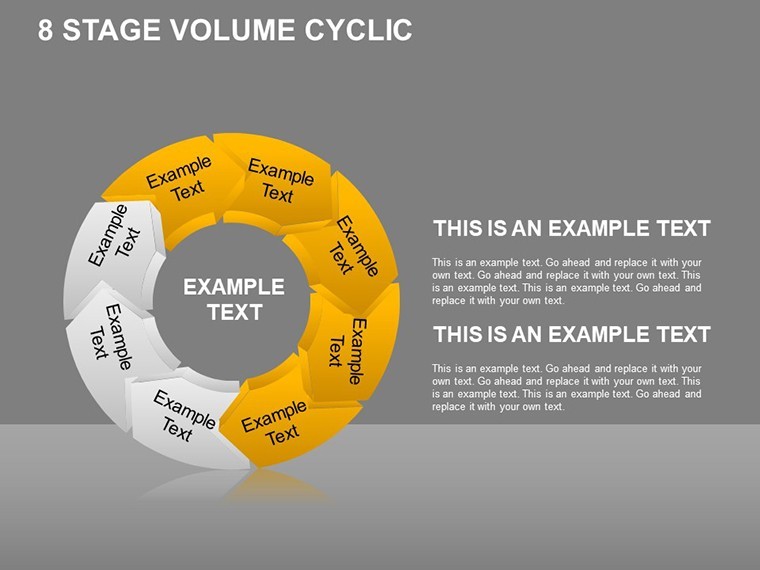
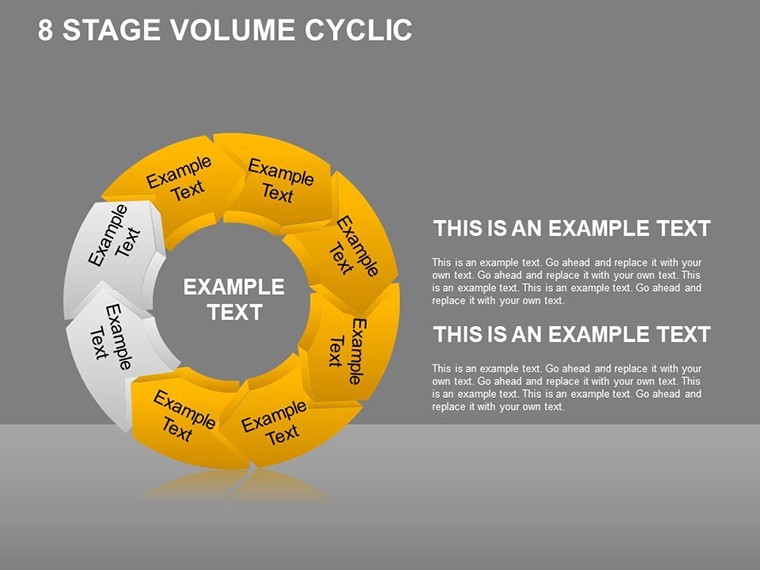
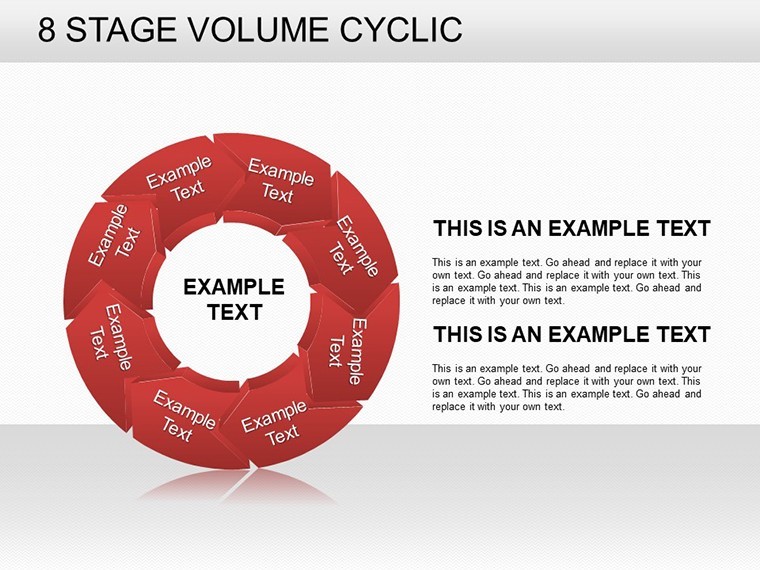
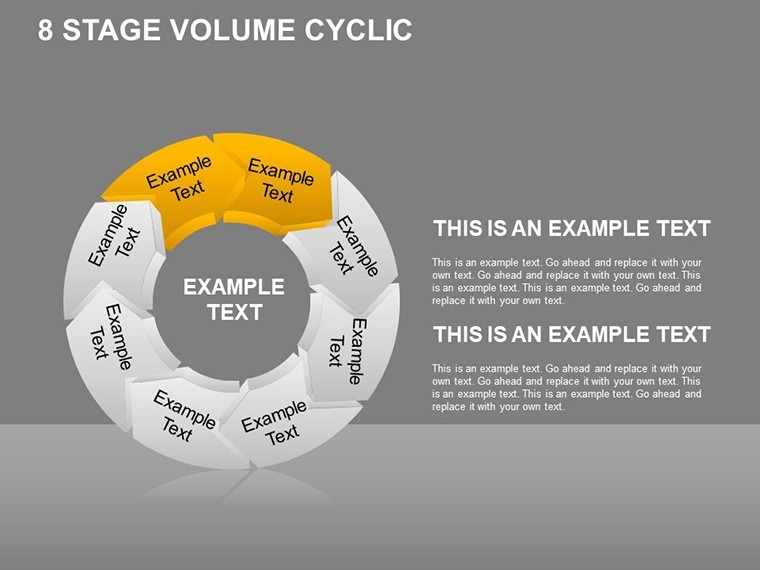
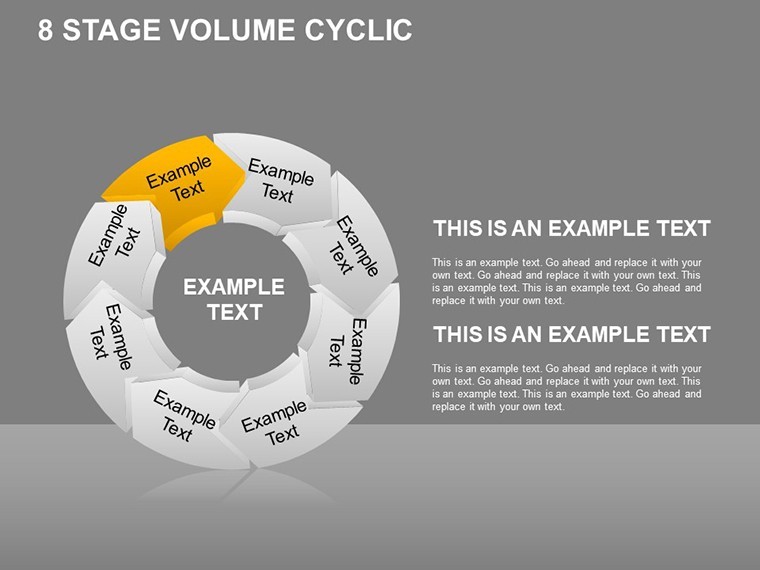
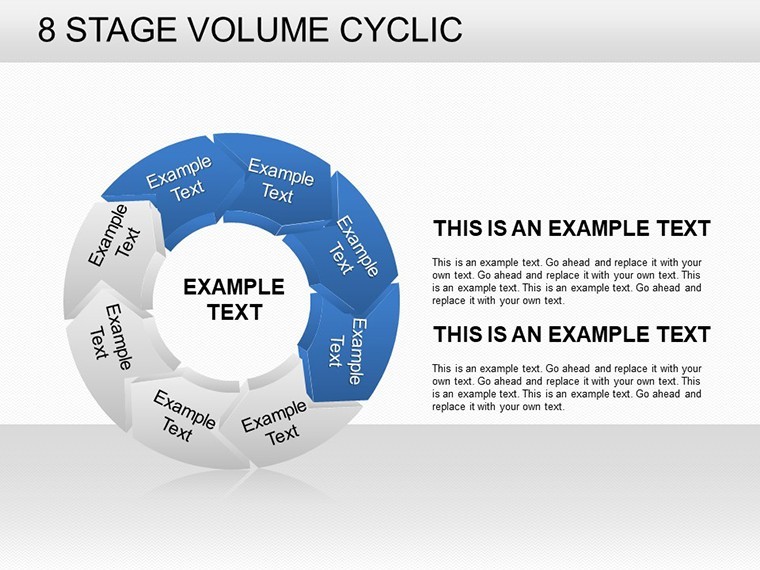
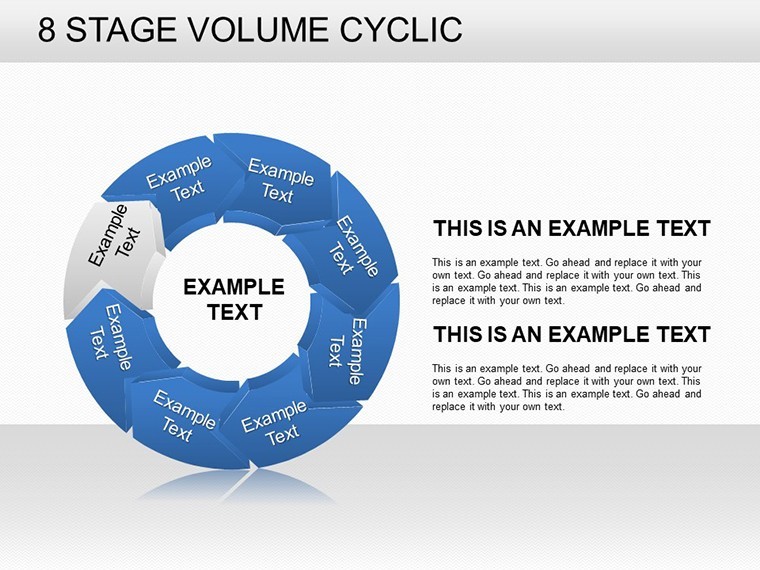
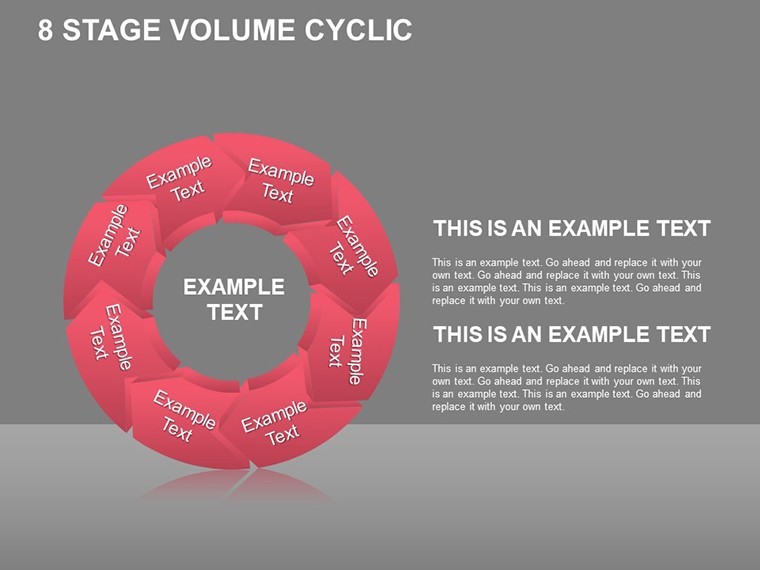
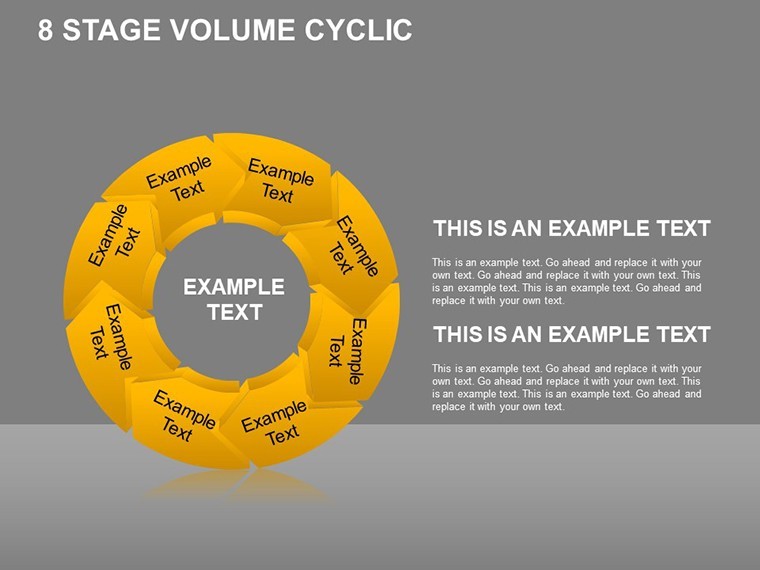
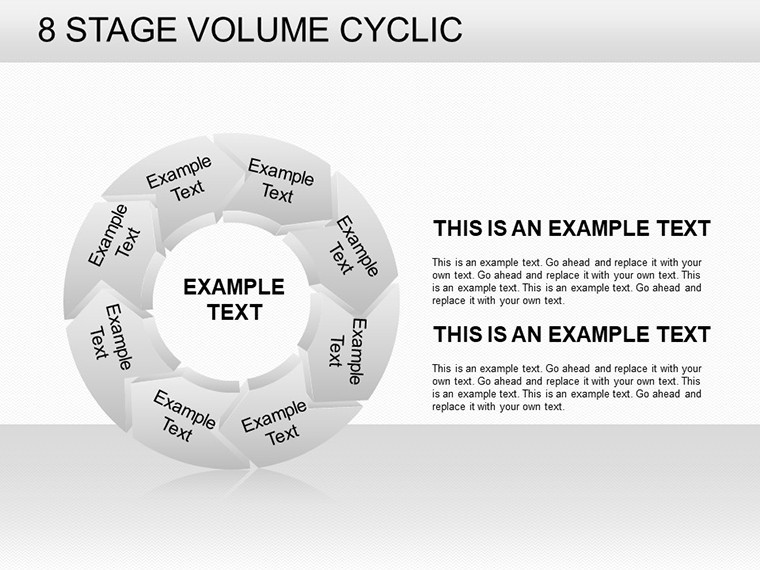
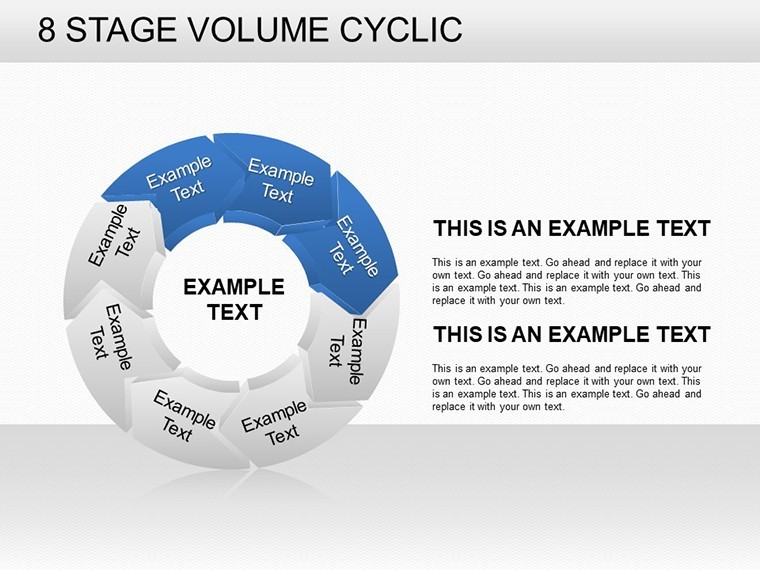
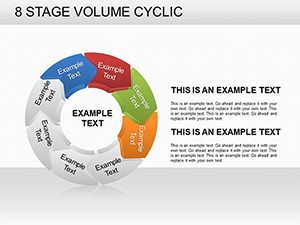
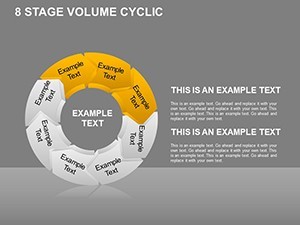
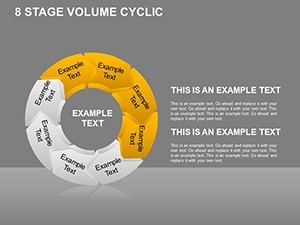
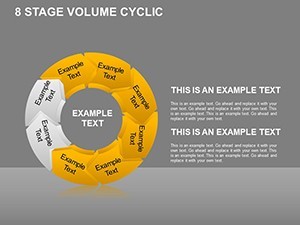
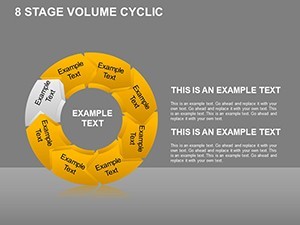
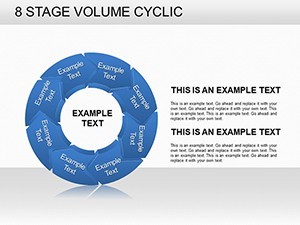
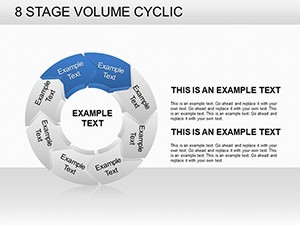
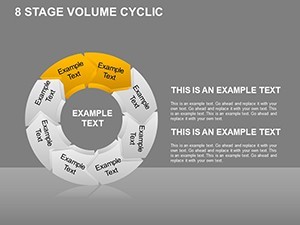
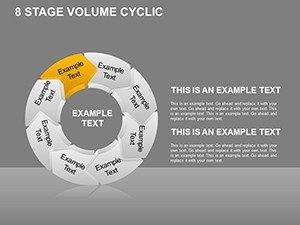
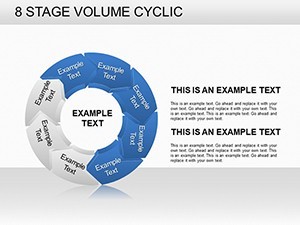
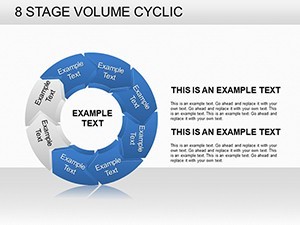
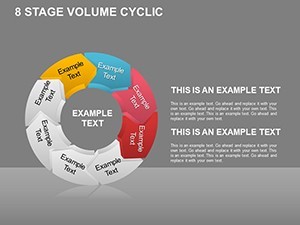
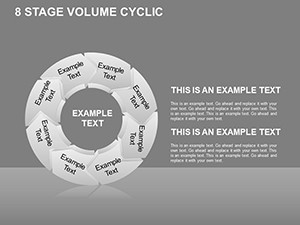
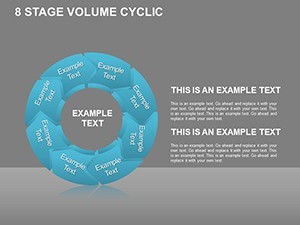
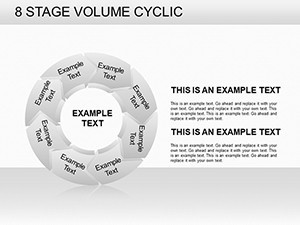
Dive into the rhythm of business evolution with the 8-Stage Volume Cyclic Keynote Charts Template, a powerhouse for anyone navigating repetitive processes with elegance. This collection of 26 meticulously crafted, editable slides harnesses the power of circular arrow designs to depict eight distinct stages, each arrow independently customizable to spotlight key actions or principles. Tailored for Keynote users but effortlessly adaptable to PowerPoint and Google Slides, it's the go-to for professionals seeking to infuse their presentations with motion and meaning.
Envision a boardroom where your project timelines unfold like a strategic dance - arrows curving through phases of ideation, execution, review, and renewal. This template shines in highlighting individual elements within a cohesive cycle, making it indispensable for process mapping in dynamic environments. From consulting firms dissecting client workflows to educators breaking down policy cycles, the volume emphasis adds weight to each stage, quantifying progress in ways that captivate and convince.
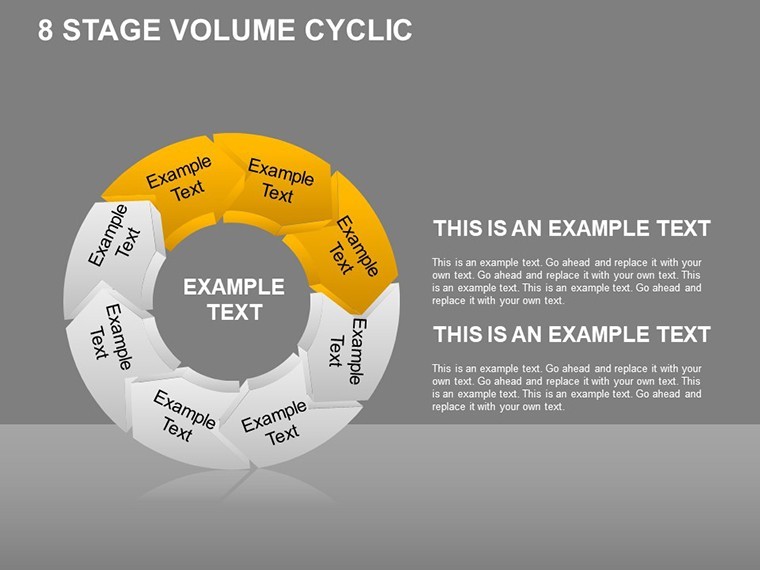
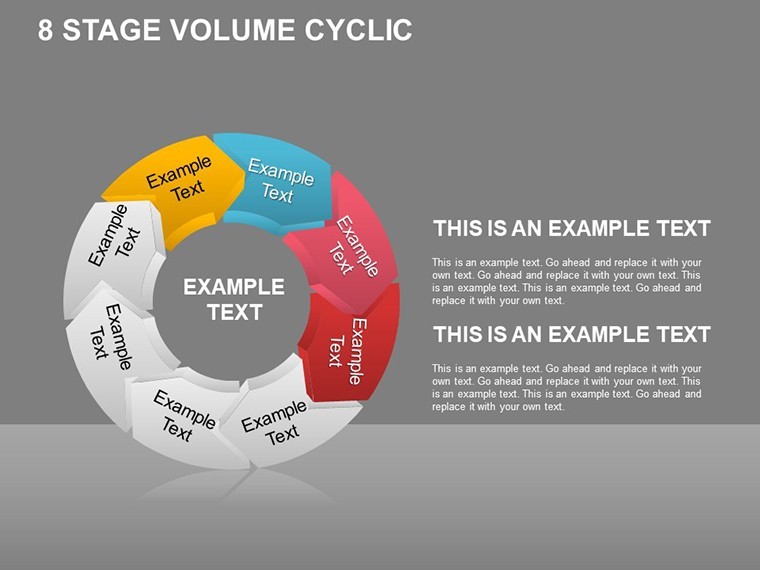
What sets this apart is its focus on modularity: Each arrow can be enhanced with gradients, shadows, or data overlays, turning a simple diagram into a narrative driver. In a world overloaded with information, this template cuts through the noise, aligning with principles from design thinkers like Edward Tufte, who advocate for data-ink ratios that maximize clarity. For a product manager at a SaaS company, it could illustrate feature development loops, where volume arrows represent user adoption metrics surging through testing to launch.
Mastering Arrow-Driven Dynamics
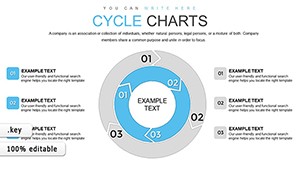
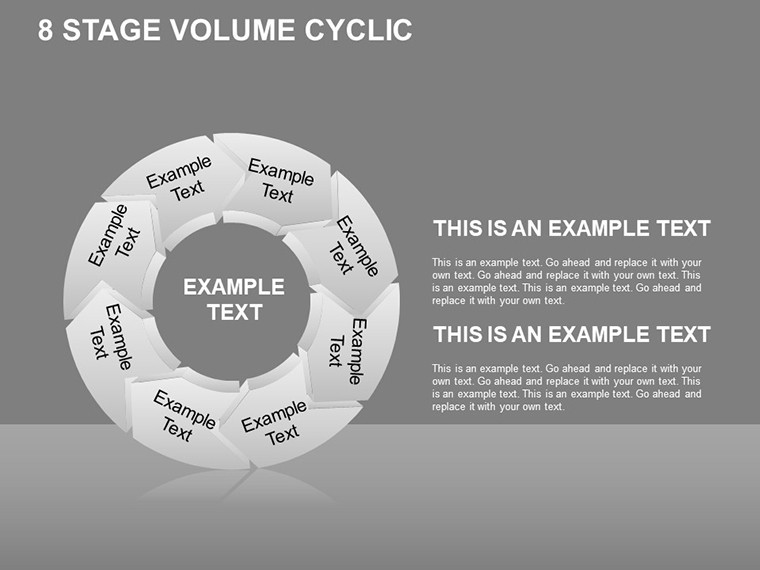
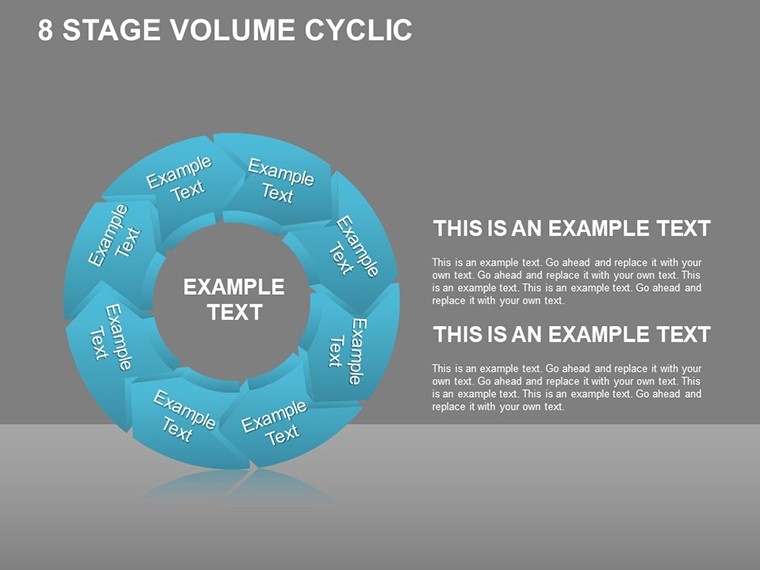
The circular arrow motif isn't arbitrary; it's rooted in psychological flow, guiding viewers' eyes naturally through cyclical narratives. With 26 slides, you'll find variations from minimalist overviews to detailed breakdowns, all vector-based for crisp outputs on any screen size. Features like drag-and-drop editing democratize design, requiring no advanced skills yet yielding pro-level results.
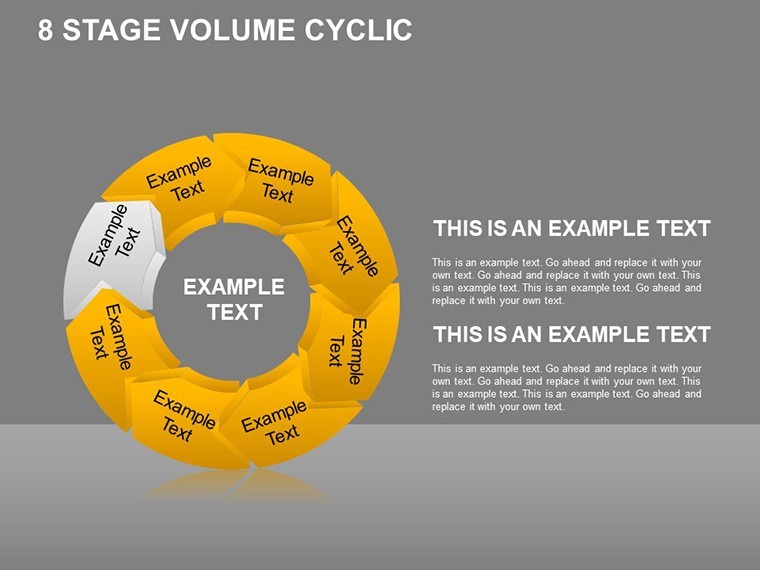
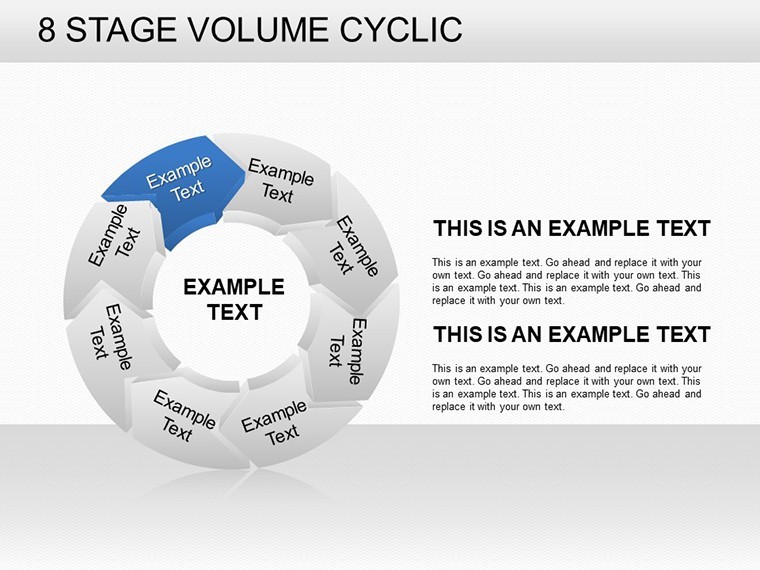
- Independent Arrow Controls: Isolate and animate single stages for emphasis, great for troubleshooting bottlenecks in supply chains.
- Volume Scaling: Adjust arrow thickness to reflect intensity, such as budget allocations in fiscal cycles.
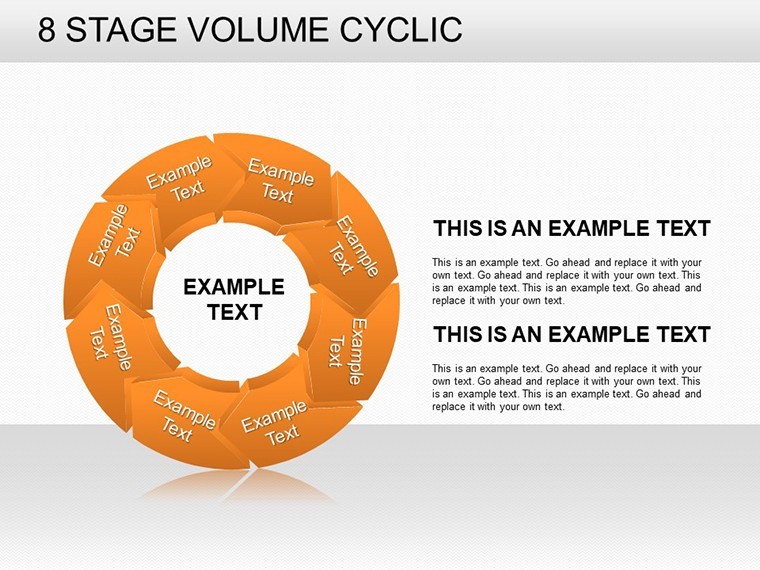
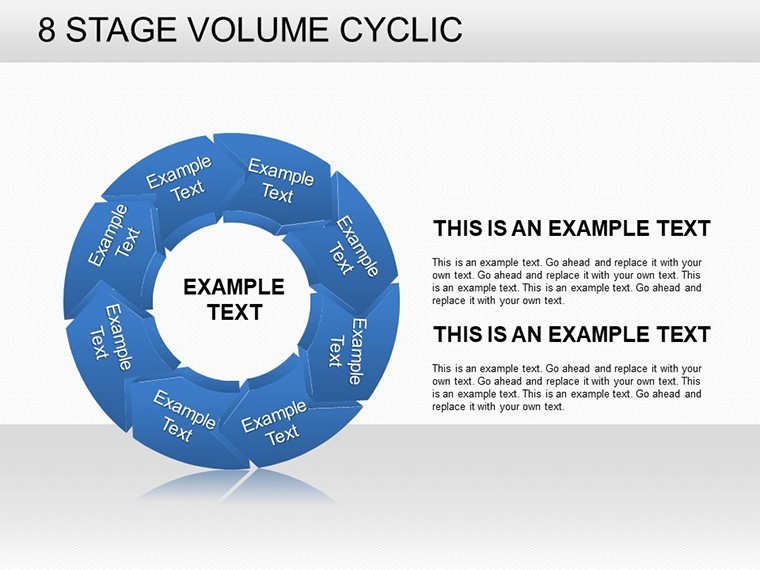
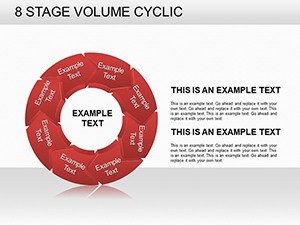
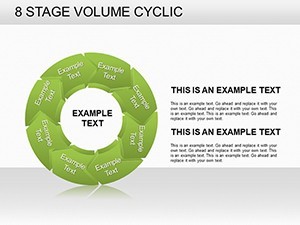
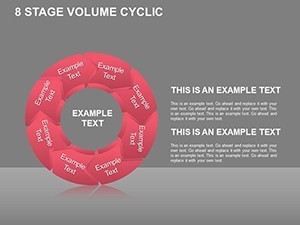
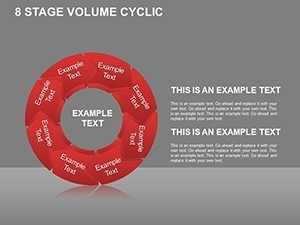
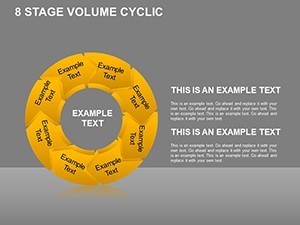
- Theme Versatility: Pre-set color schemes for industries, from tech blues to finance greens, ensuring brand harmony.
Versus basic diagramming tools, this template's Keynote-native animations - fading arrows that reveal stages sequentially - create immersive experiences that static exports can't match. It's like upgrading from a sketch to a storyboard.
Practical Workflow Integration
- Load Your Data: Paste metrics from Google Sheets directly into placeholders for instant updates.
- Refine Arrows: Use built-in tools to curve paths or add text callouts, inspired by agile methodologies for sprint cycles.
- Add Interactivity: Hyperlink stages to appendices, enhancing navigation in lengthy investor decks.
- Finalize Output: Export as video for social shares or interactive PDF for remote teams.
A case in point: An operations consultant used similar cyclic arrows to revamp a client's manufacturing loop, identifying a 20% efficiency gain by visualizing waste volumes at each stage - echoing lean principles from Toyota's playbook.
Diverse Applications Across Sectors
Project managers will love deploying it for phase reviews, where eight arrows trace from planning to evaluation. In healthcare, administrators can map patient care cycles, with volumes denoting case loads. Slide 8, featuring a multi-layered arrow set, is perfect for comparative analysis, like benchmarking against competitors' processes.
Pro tips: Layer in real-time data via Keynote's scripting for live demos, or pair with SWOT slides for holistic strategy views. This template doesn't just display data - it orchestrates it, fostering deeper discussions and actionable outcomes.
Elevate Your Narrative Game
Backed by insights from visualization experts, this template adheres to universal design standards, making it accessible and authoritative. It slashes prep time by 60%, letting you focus on strategy over styling. For growing enterprises, it's a scalable solution that grows with your ambitions.
Don't let cycles spin unnoticed. Grab the 8-Stage Volume Cyclic Keynote Charts Template now and direct your audience's focus with precision. Check out our relationship charts for complementary tools.
Frequently Asked Questions
How flexible are the arrow customizations?
Extremely - resize, recolor, and animate each independently for tailored emphasis.
Does it work outside Keynote?
Yes, seamless export to PowerPoint ensures broad compatibility.
Ideal for what project types?
Best for iterative processes like software development or marketing campaigns.
Are animations included?
Yes, built-in Keynote transitions for smooth stage reveals.
Can I use it for educational purposes?
Definitely; great for teaching business cycles in classrooms.
What's the slide variety like?
26 slides range from simple to complex, covering all cyclic needs.