Time Scale Keynote Charts: Mastering Timelines for Business Success


Type: Keynote Charts template
Category: Timelines
Sources Available: .key
Product ID: KC00219
Template incl.: 16 editable slides
Picture this: You're in a boardroom, unveiling a business plan that not only outlines goals but vividly maps the journey from past milestones to future aspirations. No more cluttered slides or confusing narratives - just clear, engaging timelines that keep everyone aligned. Our Time Scale Keynote Charts template delivers exactly that with 16 editable slides tailored for business professionals, project managers, and strategists. Whether crafting a startup pitch or reviewing quarterly progress, these charts transform abstract timelines into compelling visuals that inspire action.
Rooted in the essentials of project management frameworks like those from the Project Management Institute (PMI), this template emphasizes chronological clarity. It's perfect for displaying action plans, with modifiable elements that let you adjust dates, milestones, and metrics on the fly. Users report cutting preparation time in half, freeing up energy for strategic thinking. For example, a tech startup might use these to showcase product roadmap evolution, mirroring approaches in successful pitches like those at Y Combinator demos.
Essential Features That Drive Timeline Excellence
At its core, this template is about precision and adaptability. Each slide leverages Keynote's robust tools for smooth scaling and animation, ensuring your timelines flow dynamically during presentations. From horizontal Gantt-style bars to vertical milestone ladders, the variety covers diverse needs without requiring advanced design skills.
- Comprehensive Editability: Alter time frames, colors, and labels effortlessly to fit your project's scope.
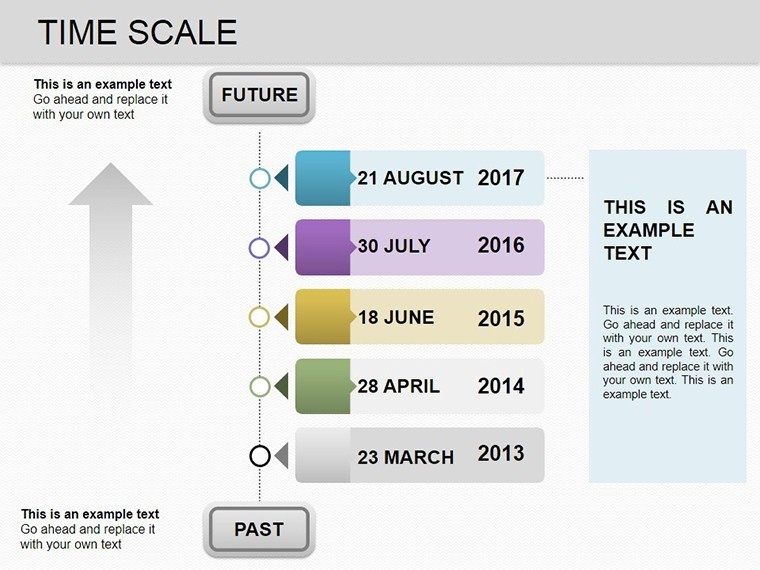
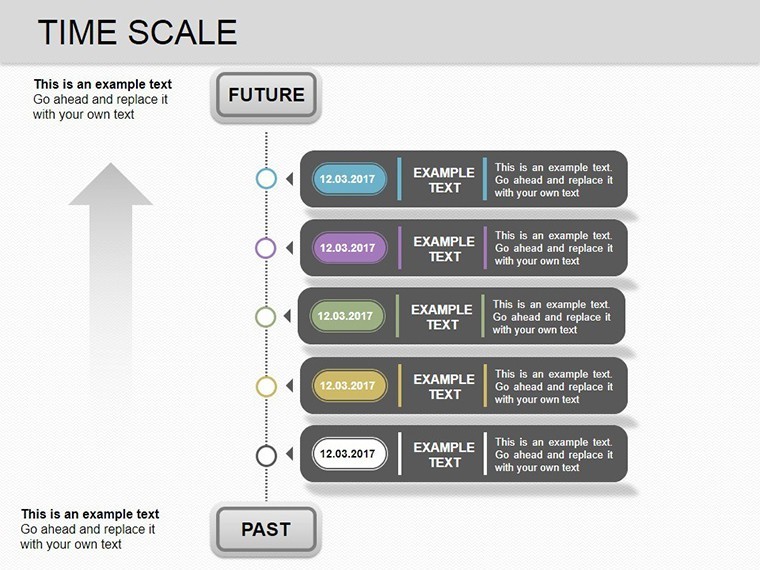
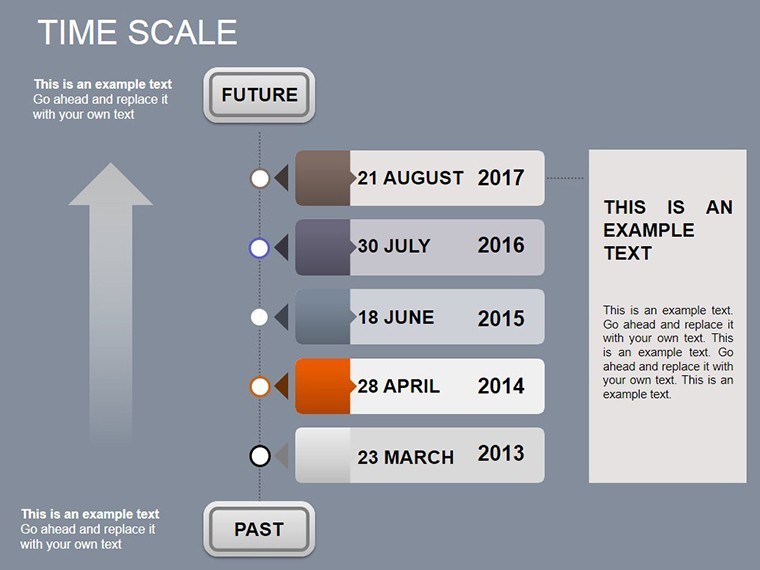
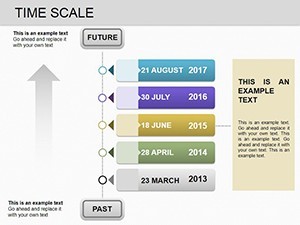
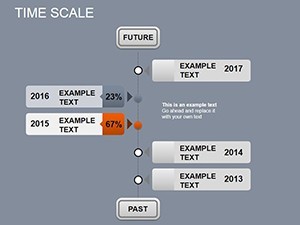
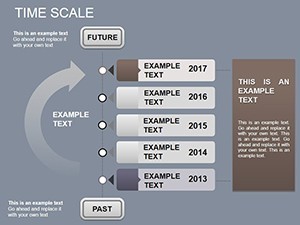
- Timeline-Specific Designs: Includes arrows, markers, and phases for depicting past, present, and future seamlessly.
- Integration-Ready: Pull data from tools like Microsoft Project or Excel for real-time updates.
- Professional Aesthetics: Modern, minimalist styles that align with corporate branding standards.
These features translate to tangible benefits, such as improved team buy-in. A case from a Fortune 500 company, detailed in a McKinsey report, showed that visual timelines boosted project completion rates by 25% through better foresight.
In-Depth Look at the 16 Slides
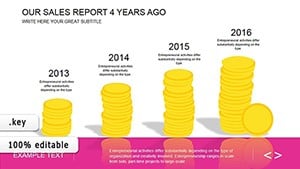
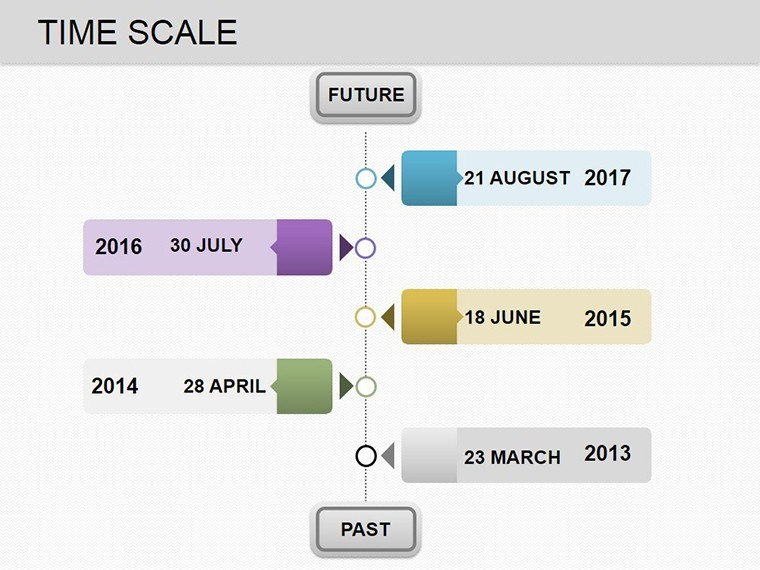
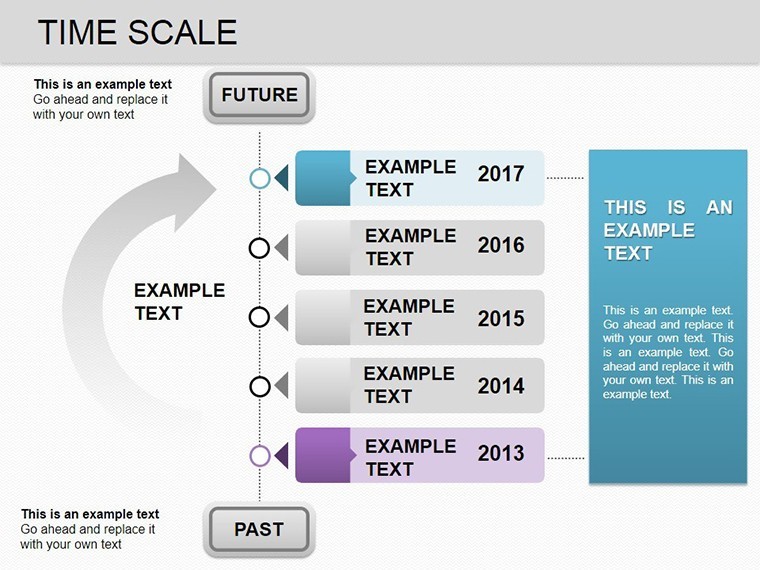
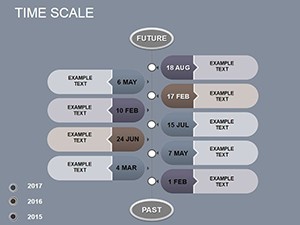
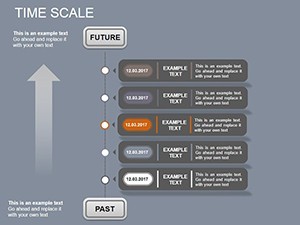
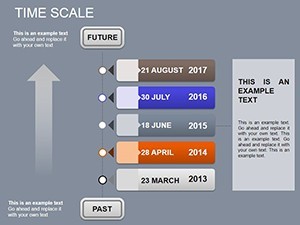
Slide 1 starts with a broad overview timeline, ideal for executive summaries with key phases highlighted. Slides 2-4 offer linear scales for short-term plans, like quarterly sprints, with room for annotations on risks and opportunities.
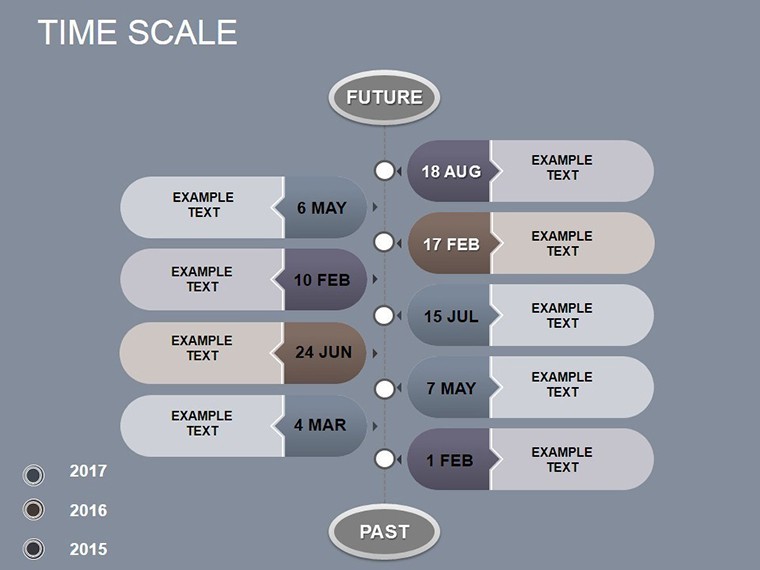
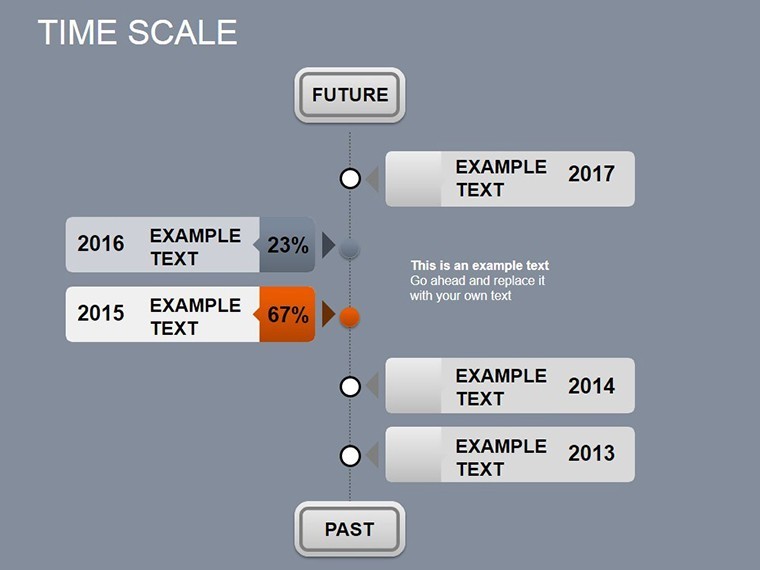
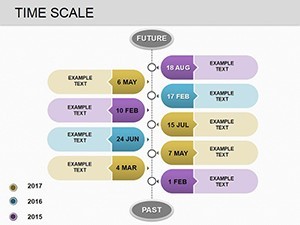
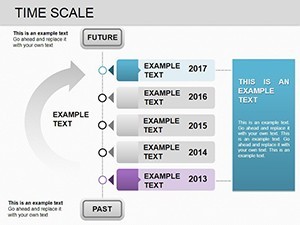
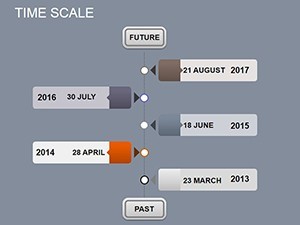
Slides 5-8 introduce branched timelines for complex projects, showing parallel tracks such as marketing and development. These are great for agile methodologies, incorporating scrum elements. Slides 9-12 focus on retrospective views, using curved lines to connect historical data points to current status.
Rounding out the set, Slides 13-16 provide futuristic projections, with dashed lines for uncertainties and solid for confirmed milestones. Each includes smart art for easy data entry, making them adaptable for industries from finance to manufacturing.
Practical Applications in Business Planning
These charts shine in scenarios where time is the narrative driver. For business development, use them to map market entry strategies, drawing from real examples like Amazon's expansion timelines in their investor reports.
In project management, they facilitate status updates, helping teams visualize delays and accelerations. Consider a construction firm using similar tools to track build phases, as highlighted in industry journals like Construction Management and Economics.
- Step-by-Step: Annual Review Presentation - Import past data into Slide 3, forecast future in Slide 14, add icons for emphasis, and rehearse transitions.
- Startup Pitch Deck: Customize Slide 7 to show funding rounds and growth projections, captivating investors.
- Team Roadmap Session: Use Slide 10 to align departments on shared timelines, reducing miscommunication.
Such uses underscore the template's role in fostering proactive planning.
Expert Tips for Timeline Customization
Maximize impact by layering in dependencies with connector lines, a technique endorsed by visualization experts at Tableau. Ensure scalability for different screen sizes, and incorporate feedback loops for iterative improvements.
Vs. standard Keynote timelines, this offers pre-themed options that accelerate setup, akin to premium tools but at a fraction of the cost. Add humor subtly, like noting "Time flies - but with these charts, you'll catch it!" to lighten dense sessions.
Elevate Your Business Narratives Today
Don't let vague timelines derail your plans. This template, trusted by hundreds, provides authoritative tools for clear communication. Step up your game - secure your Time Scale Keynote Charts and chart a course to success.
Frequently Asked Questions
What makes these Time Scale charts unique?
They offer 16 varied designs focused on business timelines, fully editable for past-future visualizations.
Do they support animations in Keynote?
Yes, built-in animations enhance transitions between time phases smoothly.
Can I integrate external data?
Certainly - import from spreadsheets for dynamic updates.
Are there templates for specific industries?
While general, they adapt easily to tech, finance, or marketing needs.
How do I handle long timelines?
Use zoomable slides or break into segments for clarity.