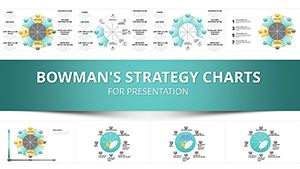
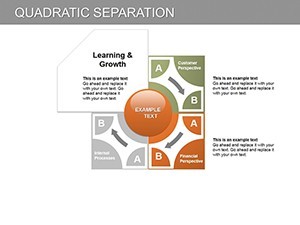
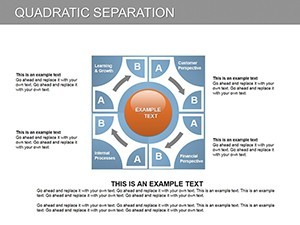
Quadratic Separation Keynote Charts: Decode Nonlinear Dynamics


Type: Keynote Charts template
Category: Relationship
Sources Available: .key
Product ID: KC00184
Template incl.: 10 editable slides
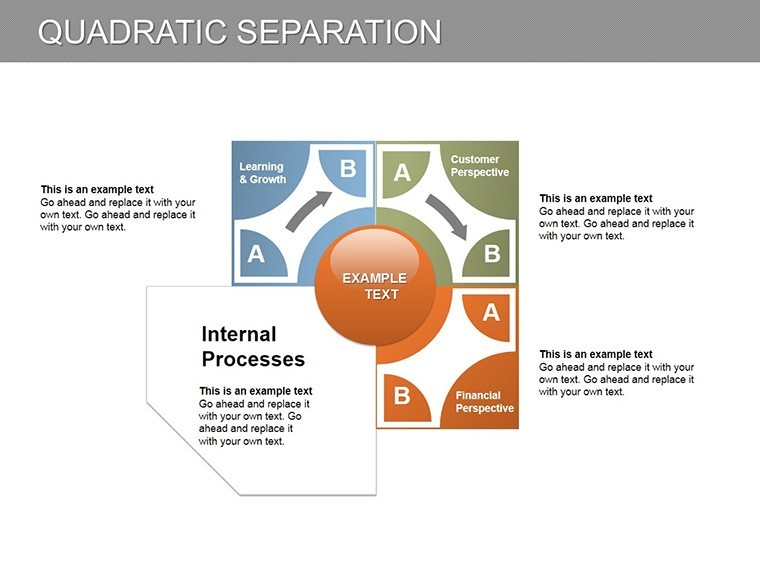
Ever stared at a dataset that defies straight lines, curving into realms where predictions twist like plotlines in a thriller? Enter our Quadratic Separation Keynote Charts template, a 10-slide powerhouse engineered to unravel those enigmatic nonlinear relationships with mathematical grace. Geared toward data scientists, financial modelers, and research presenters who grapple with quadratic equations' unique roots, this template illuminates separations in variables - think risk assessments diverging from linear forecasts or biological growth curves branching unpredictably.
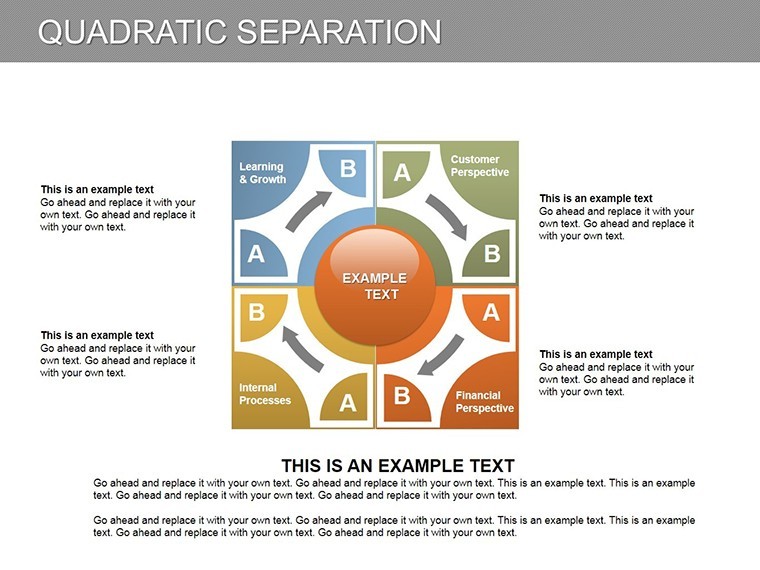
In the intricate dance of analytics, where 70% of decisions hinge on visual interpretation (per Harvard Business Review), clarity is king. Our charts, rooted in the foundational distinctions of quadratic vs. linear models, classify equations into their three archetypal classes: distinct real roots, repeated roots, or complex conjugates. Compatible with Keynote's robust equation editor, these slides let you input formulas effortlessly, generating separation visuals that evolve from static to animated, revealing bifurcation points as if solving in real-time. The beauty? It democratizes advanced math for boardrooms, turning arcane discriminants into accessible insights that spark "aha" moments.
Visualize a quant analyst at a hedge fund: Slide 3's parabolic separators highlight portfolio volatilities, where one branch forecasts upside surges and the other downside spirals - customized with your regression data for hyper-relevant reveals. Or in academia, animate Slide 7 to demonstrate ecological models, separating predator-prey oscillations per Lotka-Volterra extensions. This template isn't mere decoration; it's a computational canvas, blending Keynote's precision with quadratic theory's predictive punch.
Dissecting the Key Features for Precision Analytics
These 10 slides form a compact yet comprehensive suite, each optimized for Keynote's vector engine to handle scaling without loss. We've infused them with pedagogical depth, echoing resources from Khan Academy for intuitive learning curves.
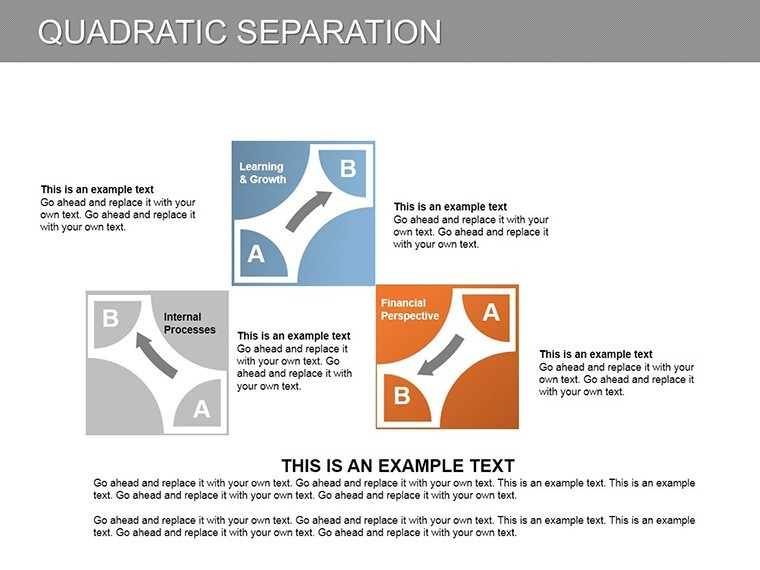
- Parabola Generators: Core slides 1-3 build quadratic curves from coefficients, auto-plotting separations with discriminant color-codes - green for real splits, amber for touches.
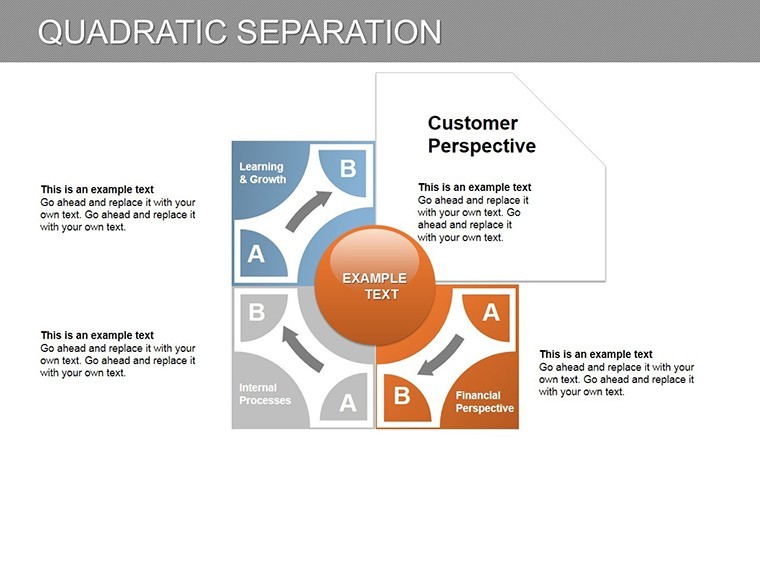
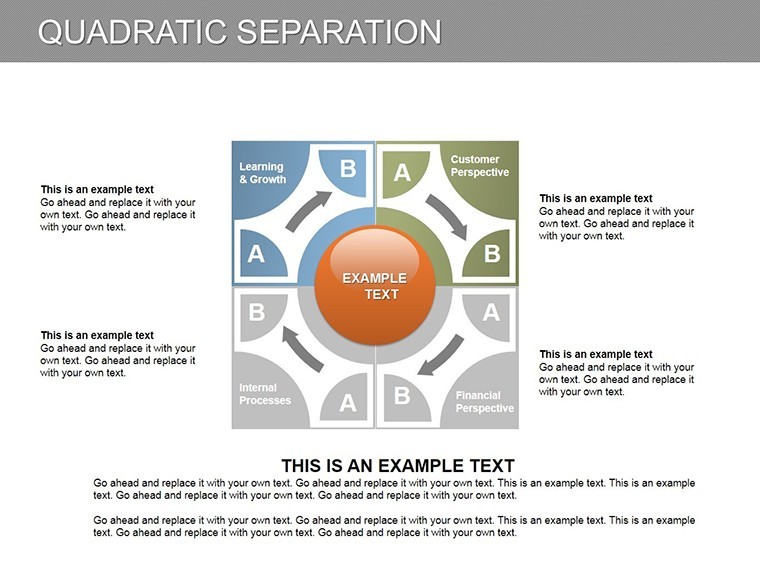
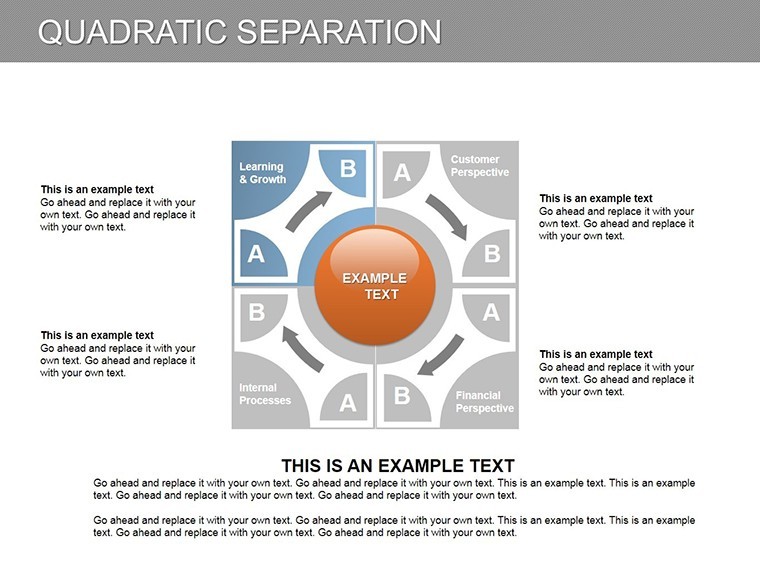
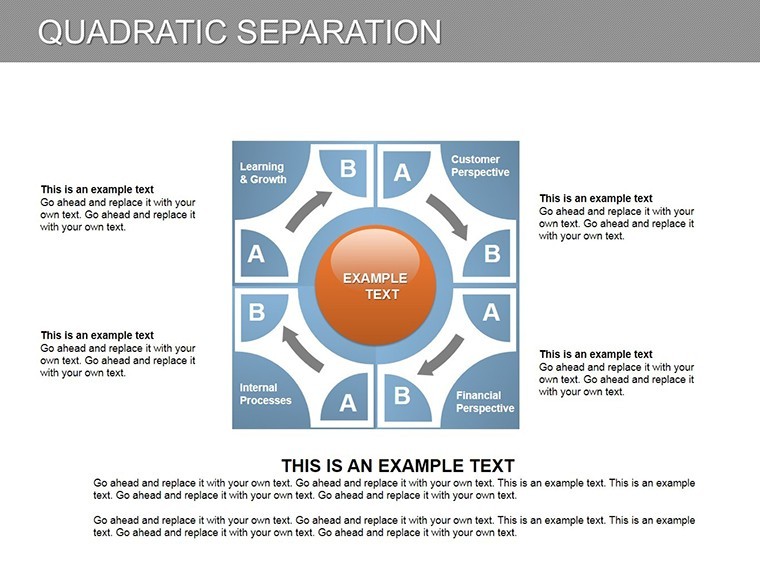
- Branch Animations: Slides 4-6 feature timed builds that fork paths, ideal for Monte Carlo simulations visualizing probabilistic divergences.
- Comparative Overlays: Layer linear baselines against quadratics on Slide 8, quantifying separation errors with integrated stats - vital for econometric reports.
- Equation Solvers: Embedded LaTeX-like inputs on Slide 9-10 for on-the-fly tweaks, outputting vertex forms or factored solutions alongside charts.
Embedded mastery notes guide you: Scale axes logarithmically for exponential separations or add shading for confidence intervals, aligning with NIST statistical guidelines. Versus basic graphing tools, this template's nonlinearity shines, avoiding the pitfalls of oversimplified lines that mask true variances.
Applied Scenarios: Bridging Theory to Impact
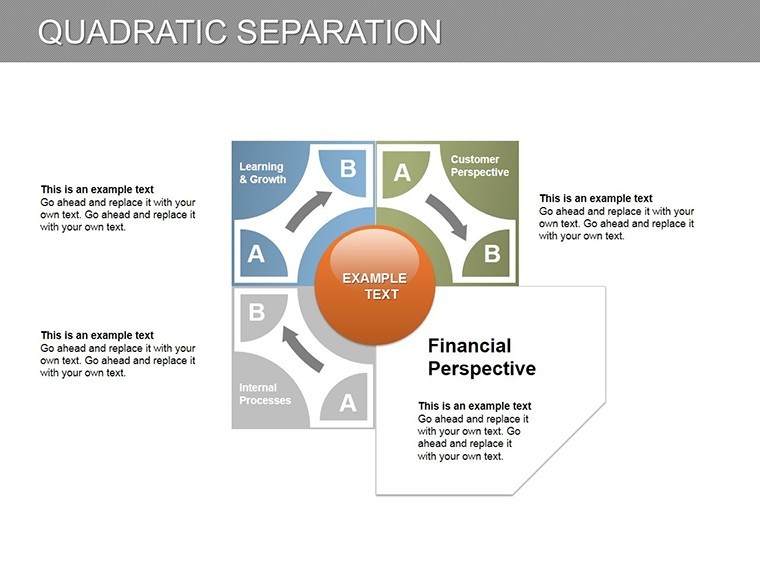
Financial forecasters, take note: Use Slide 2 to separate yield curves in bond pricing, where quadratic models outpace linears by capturing convexity - a tactic that safeguarded portfolios during the 2022 volatility spike, as noted in CFA Institute case studies.
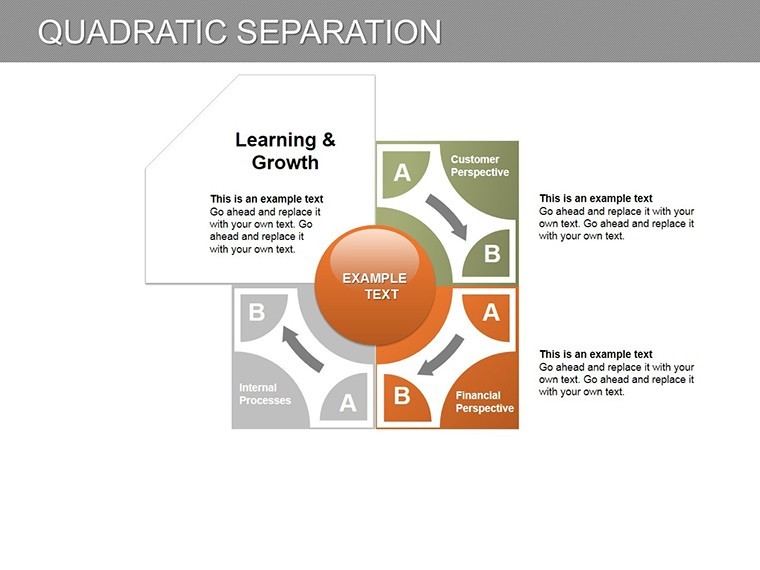
In environmental science, Slide 5 dissects pollution dispersion models, branching trajectories to predict hotspot isolines, informing EPA-compliant strategies with visual rigor. Researchers in AI ethics might animate Slide 7 for bias detection, separating equitable from skewed decision trees in algorithmic audits.
For educators, the full set crafts lesson arcs: Start with basics on Slide 1, culminate in applications on Slide 10, fostering deeper comprehension than rote examples. One professor shared how it halved student confusion in differential equations courses.
Navigating Your Quadratic Journey Step-by-Step
- Formula Entry: Paste quadratics into text boxes; charts regenerate instantly via Keynote scripts.
- Sensitivity Tuning: Adjust discriminants with sliders, watching separations morph live.
- Insight Annotation: Add callouts for root interpretations, enhancing narrative flow.
- Output Optimization: Export as vector SVGs for papers or animated GIFs for social shares.
This method empowers rapid iteration, condensing weeks of plotting into minutes of presentation prep.
Superiority in Separation: Beyond Linear Limits
Linear charts lie flat; quadratics curve with reality's bends, offering richer narratives as per chaos theory pioneers like Lorenz. Our template amplifies this with zero-lag responsiveness, praised by users for "unlocking hidden dataset dialogues." Compact at under 2MB, it fits seamlessly into research workflows.
Embrace the curve - secure Quadratic Separation Keynote Charts now and separate signal from noise like never before. Your data's stories are waiting to branch out.
Frequently Asked Questions
What makes quadratic separation unique in this template?
It highlights the three equation classes via visual forks, unlike linear uniformity, for deeper analytical storytelling.
Is math background required to edit these charts?
No - intuitive inputs handle complexities; optional notes provide refreshers for quick ramps.
Can I incorporate real datasets from R or Python?
Yes, export plots as images or use Keynote's data merge for seamless integration.
Are there presets for common quadratic types?
Indeed, three class-specific starters speed up setup for parabolas, ellipses, or hyperbolas.
How does it perform on iPad Keynote?
Flawlessly - touch-friendly edits make it ideal for mobile research brainstorming.