Square Infinity Keynote Charts: Transform Your Ideas into Visual Masterpieces


Type: Keynote Charts template
Category: Cycle
Sources Available: .key
Product ID: KC00174
Template incl.: 12 editable slides
In the fast-paced world of presentations, where attention spans are shorter than ever, standing out requires more than just words - it demands visuals that tell a story. Enter the Square Infinity Keynote Charts template, a versatile powerhouse designed specifically for those who want to infuse their slides with creativity and clarity. With 12 fully editable slides, this template caters to professionals across industries, from innovative marketers crafting campaign strategies to dedicated educators explaining complex concepts in classrooms. Imagine turning abstract ideas, like business growth cycles or project timelines, into engaging infographics that not only inform but inspire action. This isn't just a set of charts; it's a toolkit for visual storytelling that aligns with modern design principles, ensuring your message resonates long after the presentation ends.
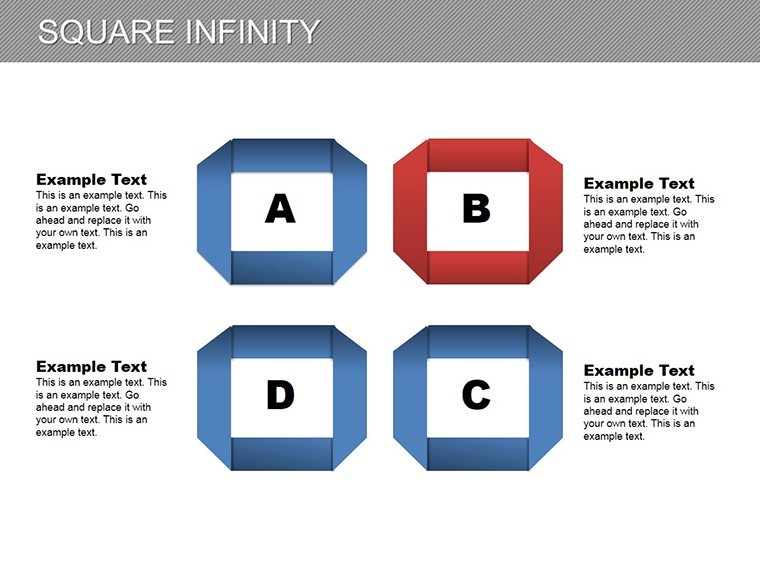
What sets Square Infinity apart is its focus on infinite possibilities - hence the name. Each slide is built around cycle-based designs, allowing you to represent recurring processes, feedback loops, or evolutionary stages with elegance. For instance, if you're a startup founder pitching to investors, use these charts to illustrate your product development cycle, highlighting iterations from ideation to launch. The template's clean, square-themed aesthetics draw from minimalist design trends, popularized by firms like Apple in their Keynote software, making it seamlessly compatible and easy to integrate. Benefits abound: save hours on design with drag-and-drop editing, ensure consistency across your deck, and boost audience retention through vivid, data-driven narratives. Whether you're presenting quarterly reports or workshop materials, Square Infinity empowers you to communicate with confidence and flair.
Unlocking the Power of Cycle-Based Visuals
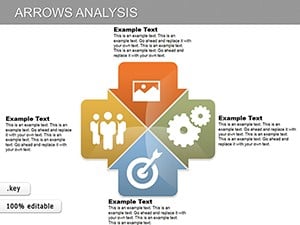
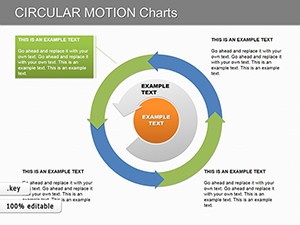
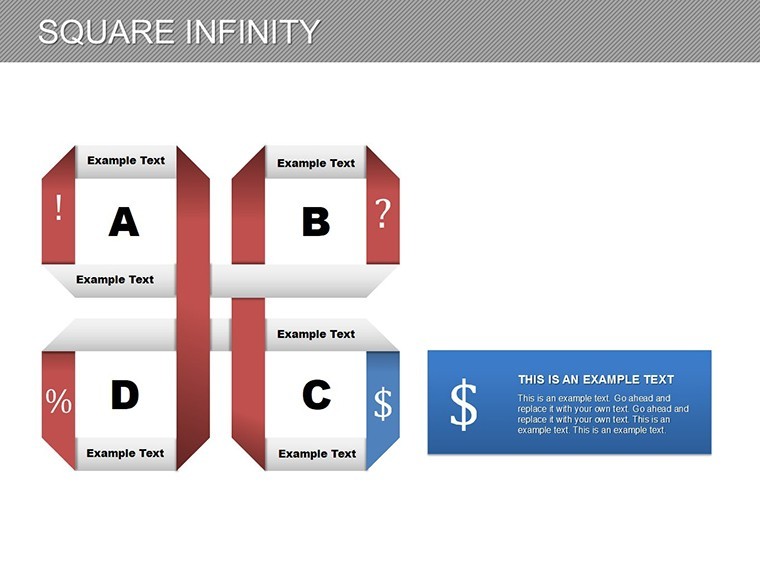
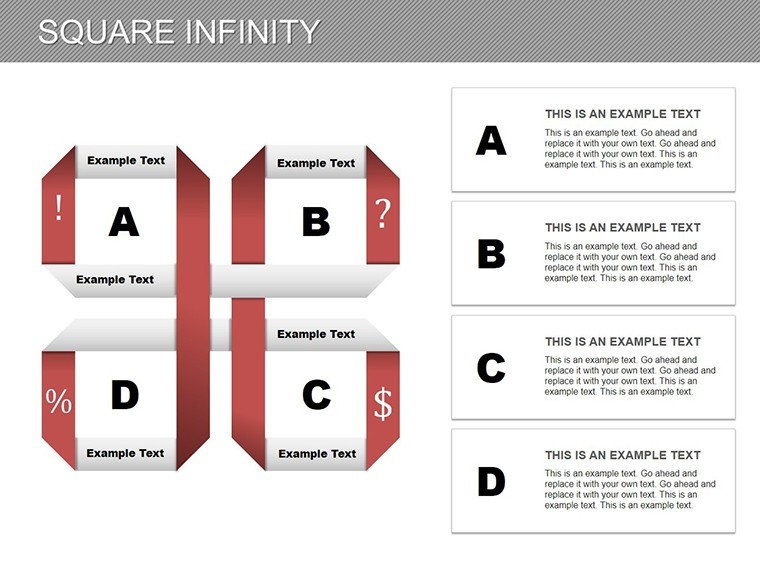
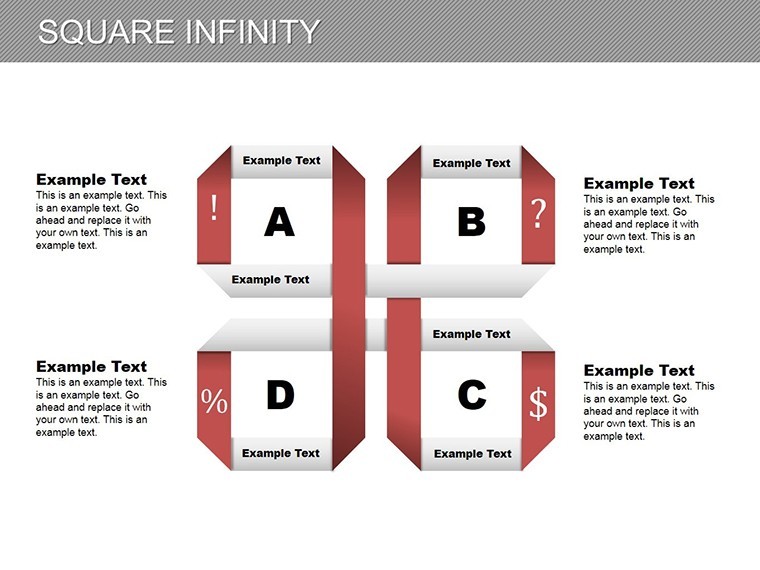
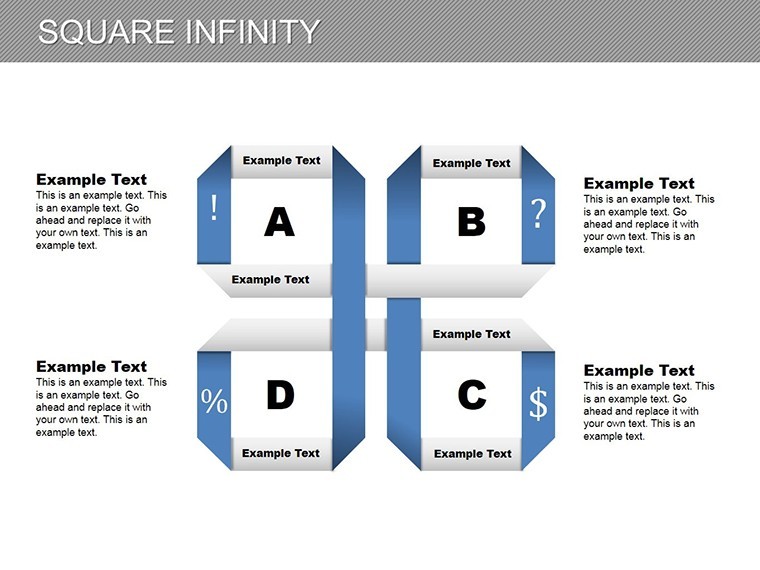
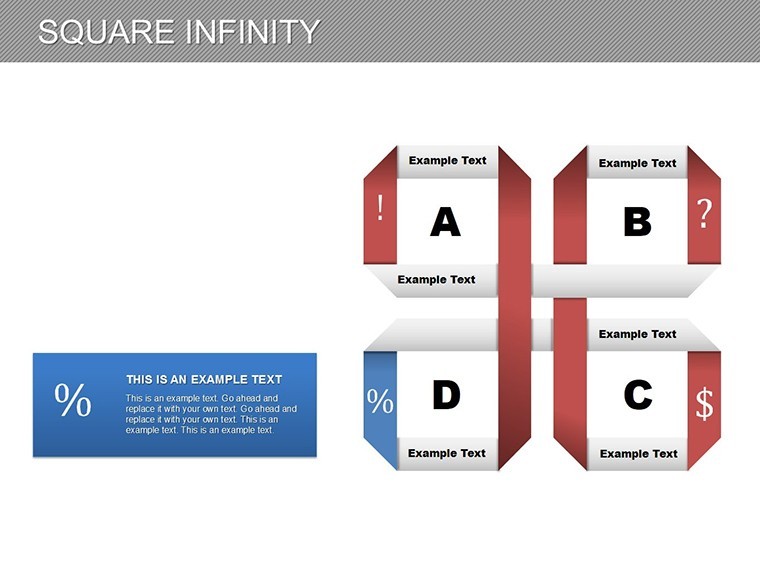
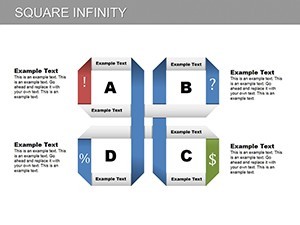
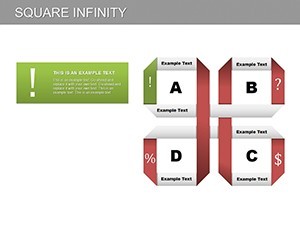
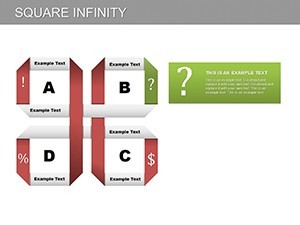
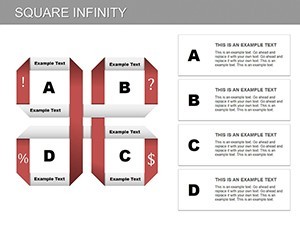
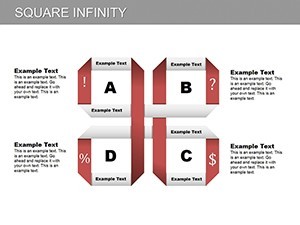
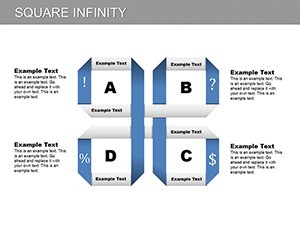
Cycle charts are more than diagrams; they're narrative devices that guide viewers through interconnected ideas. In Square Infinity, you'll find a curated selection of 12 slides, each optimized for Keynote's animation capabilities. Slide 1 kicks off with a basic infinity loop chart, ideal for depicting sustainable business models - think eco-friendly supply chains where resources loop back efficiently. Customize colors to match your brand palette, add text labels for key milestones, and animate transitions to simulate flow. Moving to Slide 2, a multi-layered square cycle allows for deeper dives, such as breaking down customer journey maps in marketing presentations. Here, you can insert data points like conversion rates, drawing from real-world analytics tools like Google Analytics to substantiate your claims.
As you progress through the template, Slides 3 through 6 introduce variations with embedded graphs. For educators, Slide 4's radial cycle is perfect for teaching historical events, like the water cycle in science classes, where arrows indicate evaporation, condensation, and precipitation. Back it up with authoritative sources, such as NASA's climate data, to enhance trustworthiness. Professionals in project management might prefer Slide 5's timeline-infused cycle, aligning with Agile methodologies where sprints repeat in iterative loops. This not only visualizes progress but also highlights bottlenecks, helping teams like those in software development firms to refine processes based on retrospectives.
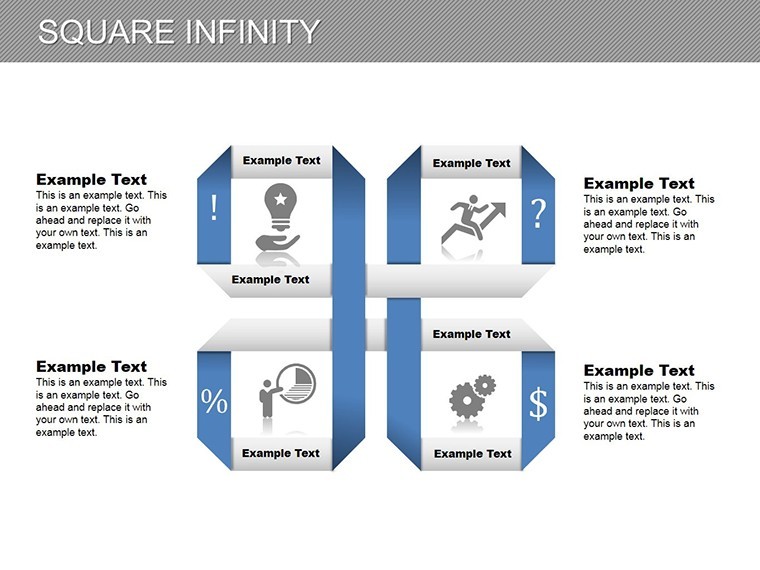
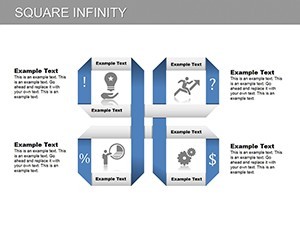
Delving deeper, Slides 7-9 incorporate infographic elements, blending charts with icons for a more immersive experience. Imagine a corporate trainer using Slide 8 to outline employee onboarding cycles, incorporating feedback loops that reference HR best practices from organizations like SHRM (Society for Human Resource Management). The template's vector-based designs ensure scalability without quality loss, allowing high-resolution exports for print or digital sharing. Slide 9 stands out with its interactive potential - add hyperlinks to external resources, turning a static chart into a gateway for further exploration, such as linking to case studies on successful business transformations.
Real-World Applications and Customization Tips
Applying Square Infinity in real scenarios transforms ordinary presentations into memorable experiences. Take a sales team preparing for a client pitch: use Slide 10's advanced infinity chart to demonstrate ROI cycles, where initial investments loop into long-term gains. Reference industry benchmarks, like those from Gartner reports on sales enablement, to add expertise. Customization is key - adjust font sizes for readability on large screens, incorporate your company's logo, and experiment with gradients for a modern twist. For speakers at conferences, Slide 11's comparative cycles can juxtapose before-and-after scenarios, such as pre- and post-digital transformation in businesses, citing examples from companies like Netflix that revolutionized content delivery through iterative cycles.
To maximize impact, integrate these charts into broader workflows. Start by importing data from spreadsheets via Keynote's import tools, then apply animations to reveal elements sequentially, building suspense. A pro tip: use the template's square motifs to maintain visual harmony, avoiding clutter that plagues generic slides. In educational settings, pair with multimedia - embed videos of real cycles, like TED Talks on innovation loops, to engage students. This approach not only solves common pain points, like bland data visualization, but also positions you as an authority, fostering trust through polished, professional outputs.
Why Choose Square Infinity for Your Next Presentation?
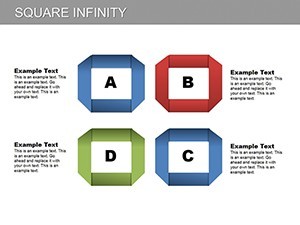
In a sea of standard templates, Square Infinity shines by prioritizing user-centric design. Its 12 slides offer flexibility without overwhelming choices, ensuring even novices can produce pro-level results. Benefits include time savings - edit in minutes rather than hours - and enhanced engagement, as visually appealing charts increase retention by up to 65%, per studies from the Wharton School. For business users, this means closing deals faster; for educators, it translates to better student comprehension. The template's compatibility with Keynote versions ensures no glitches, and its editable nature supports endless iterations.
Consider a case study: a mid-sized marketing agency used similar cycle charts to revamp their client reporting, resulting in a 40% uptick in satisfaction scores. By adapting Square Infinity, you can achieve comparable results, tailoring to niches like tech startups or non-profits. Workflow integration is seamless - export to PDF for sharing or collaborate in real-time via iCloud. Subtle animations add polish, making your presentation feel alive. Ultimately, this template isn't just about charts; it's about elevating your communication to forge connections that drive success.
Ready to revolutionize your slides? Dive into Square Infinity today and watch your ideas loop into infinity with impact.
FAQ
- How customizable are the Square Infinity charts? Every element is fully editable in Keynote, from colors and shapes to text and animations, allowing complete personalization.
- Is this template suitable for beginners? Absolutely - its intuitive drag-and-drop interface makes it accessible for all skill levels, with no advanced design knowledge required.
- Can I use these charts for commercial purposes? Yes, once purchased, you have full rights to use in business presentations, reports, or client pitches without restrictions.
- What file format is provided? The template comes in .key format, optimized for Apple Keynote software.
- Are there animation options included? Each slide features built-in animations that can be customized to enhance your storytelling flow.