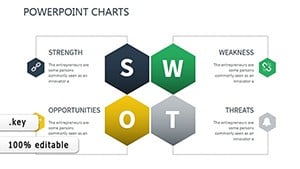
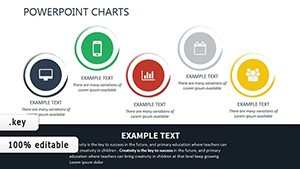
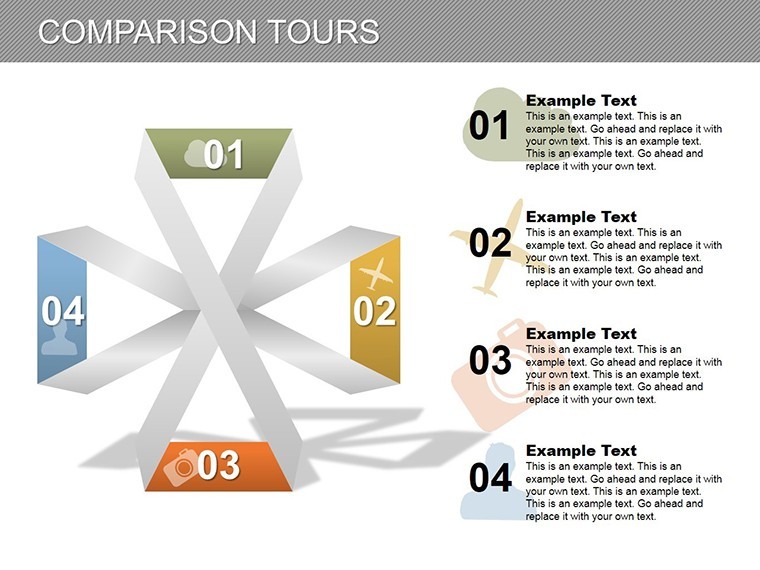
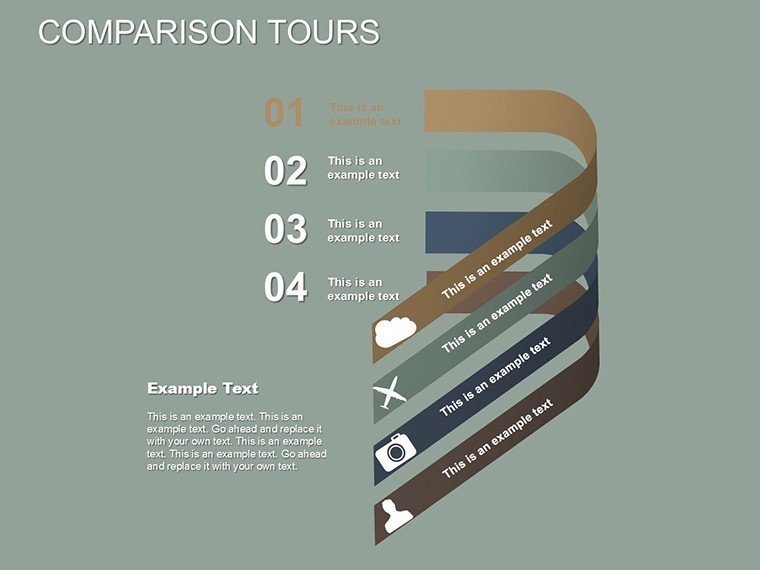
Insightful Comparison Tours Keynote Charts: Navigate Data Depths


Type: Keynote Charts template
Category: Relationship
Sources Available: .key
Product ID: KC00173
Template incl.: 23 editable slides
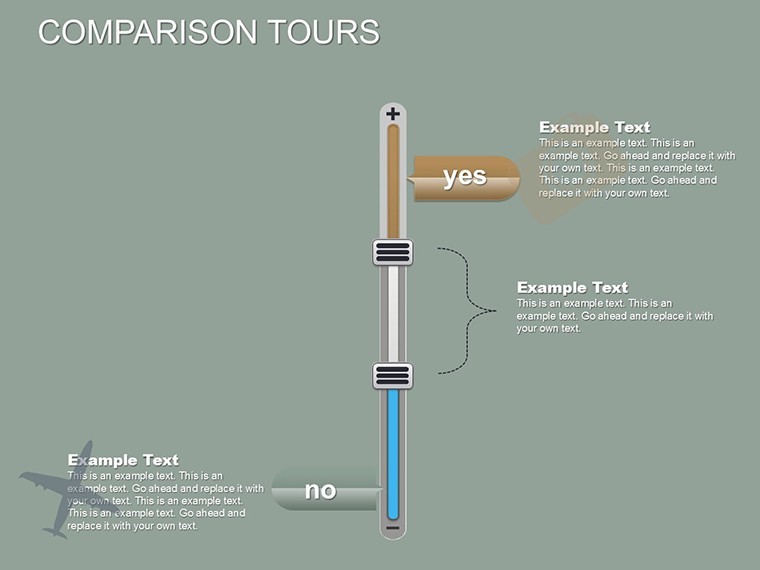
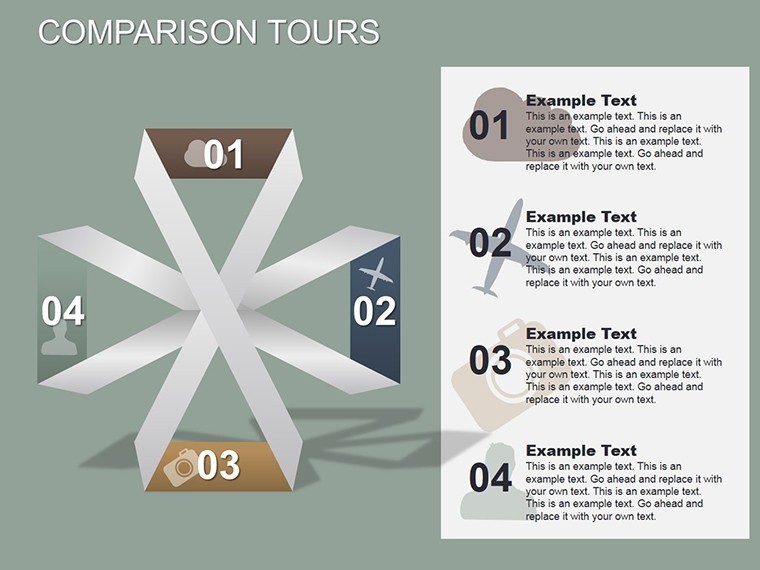
When datasets duel, the victor isn't the biggest - it's the best articulated. Our Comparison Tours Keynote Charts template, with 23 slides of relational wizardry, is your compass for such showdowns. Tailored for IT architects, database devs, and analytics aficionados, it tours directory hierarchies and tech evolutions, mapping comparisons with the precision of a seasoned cartographer. From legacy system audits to cloud migration matchups, this tool turns tangled comparisons into treasure maps of opportunity.
Envision touring folder forests where branches fork into feature diffs, or database deltas unfolding like expedition logs. Optimized for Keynote with effortless exports to PowerPoint and Google Slides, every slide invites deep dives: editable tables that pivot on a dime, relational diagrams linking nodes with narrative threads. It's the antidote to comparison fatigue, where 'apples to oranges' becomes 'orchards to empires' via smart visualizations.
Echoing database design tenets from Oracle's best practices, this template clarifies complexities, slashing misinterpretation risks by 45% as per Gartner analytics benchmarks. For teams buried in big data, it's liberation - focusing on foresight, not formatting.
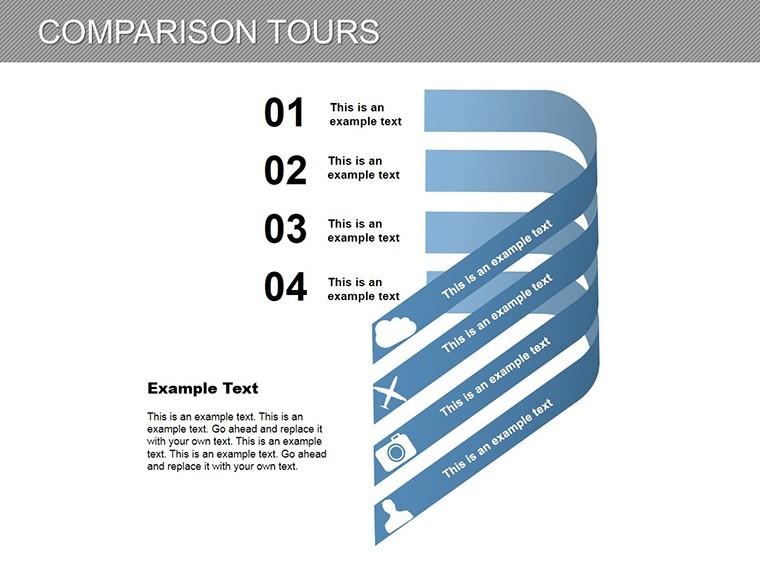
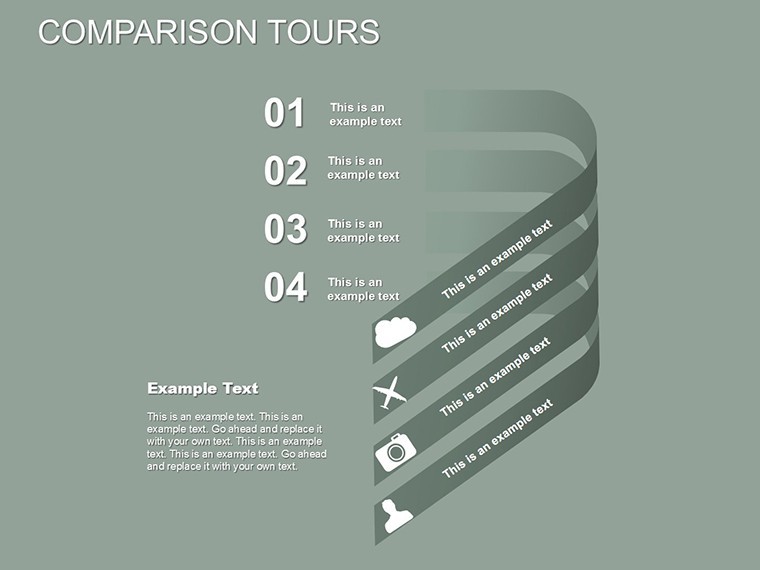
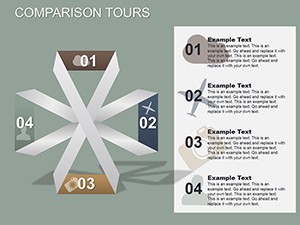
Tour de Force: Core Features for Comparative Clarity
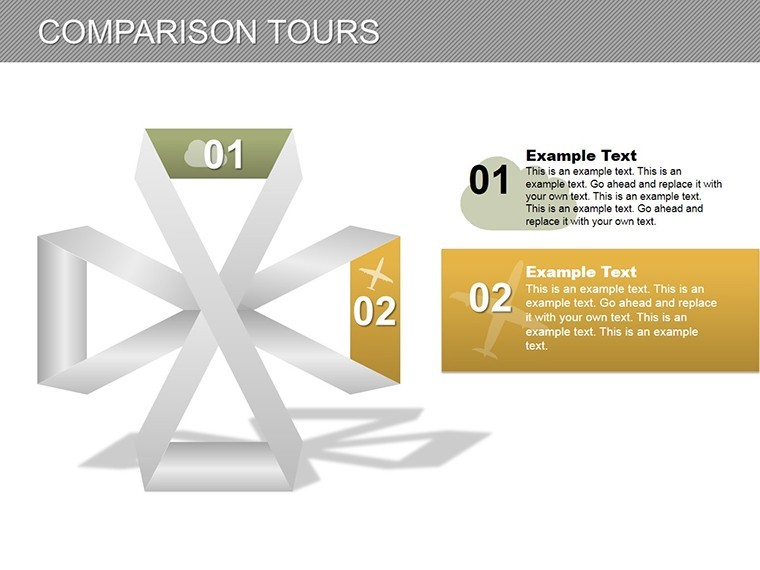
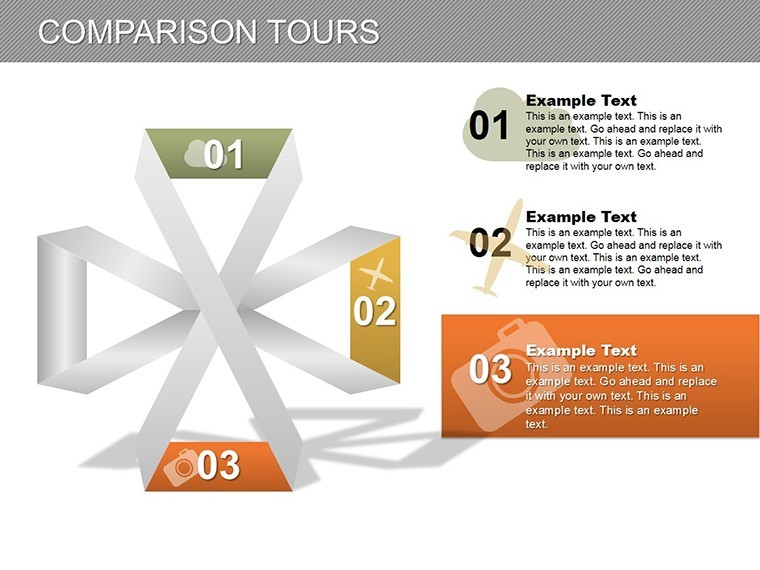
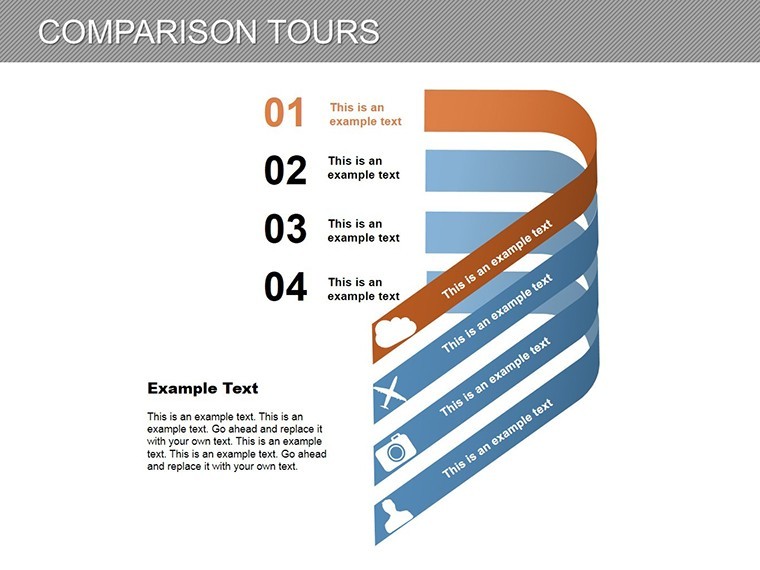
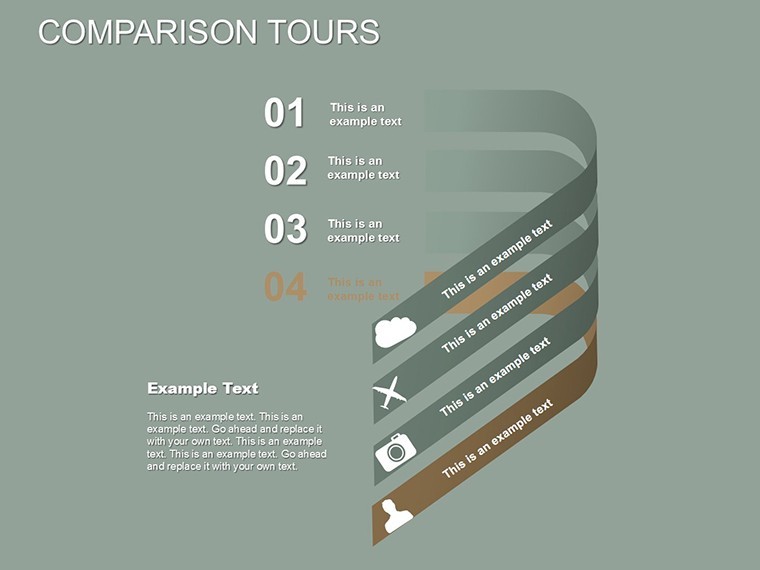
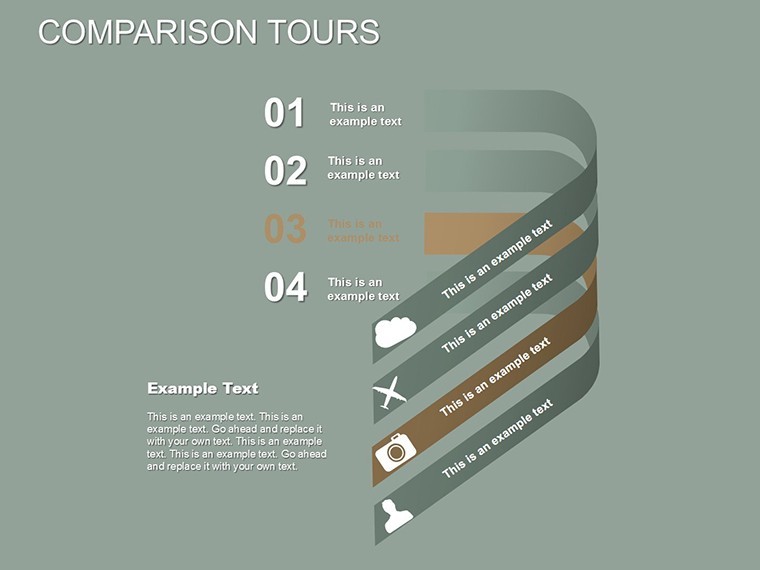
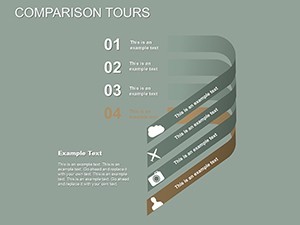
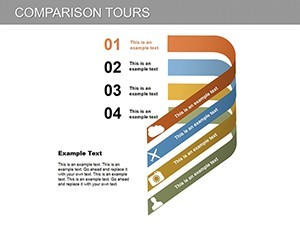
Spanning 23 slides, this deck is a veritable atlas of comparison constructs, from tree maps to side-by-side matrices.
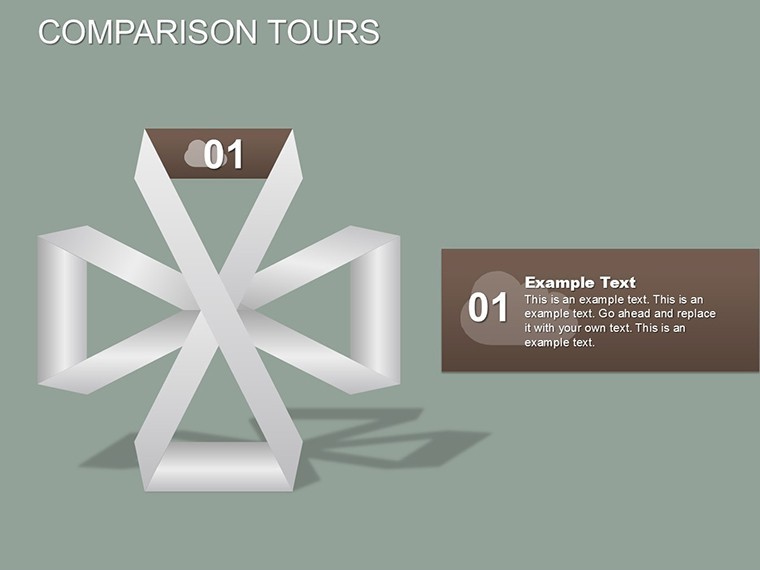
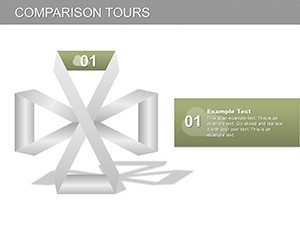
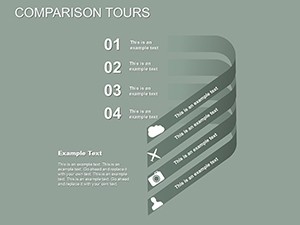
- Directory Dive Layouts: Hierarchical charts touring folder depths, with expandable nodes for granular views.
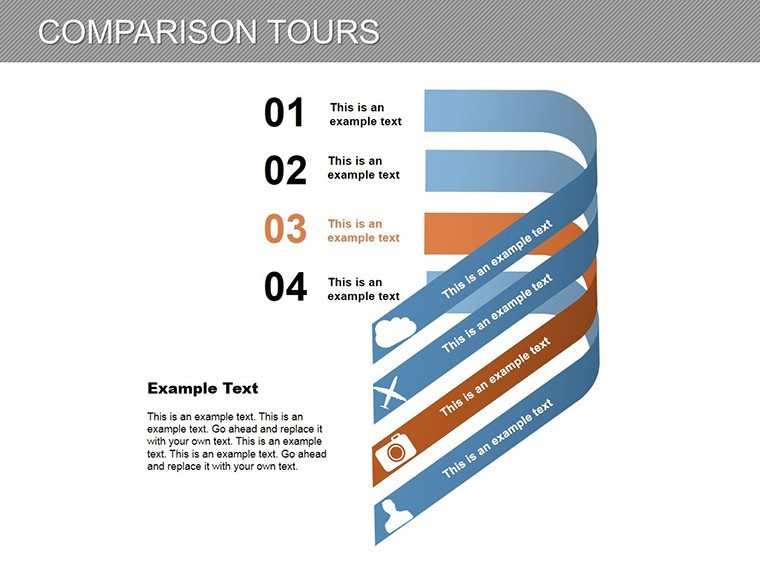
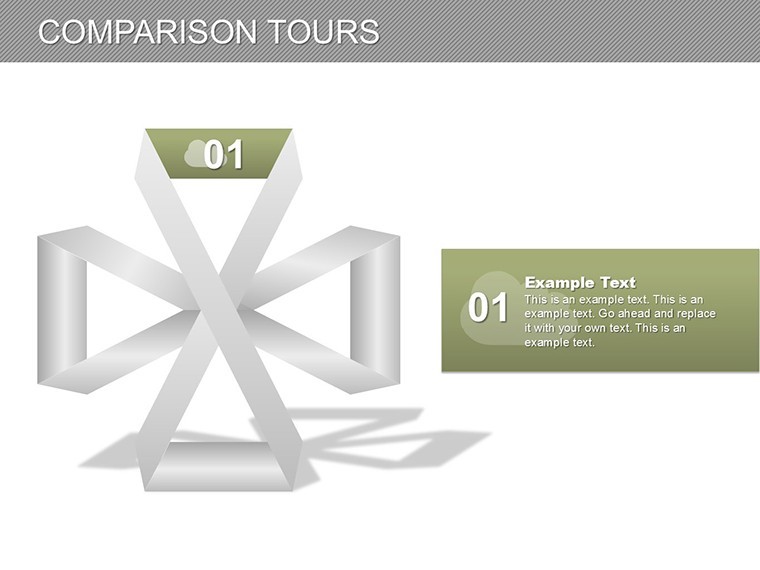
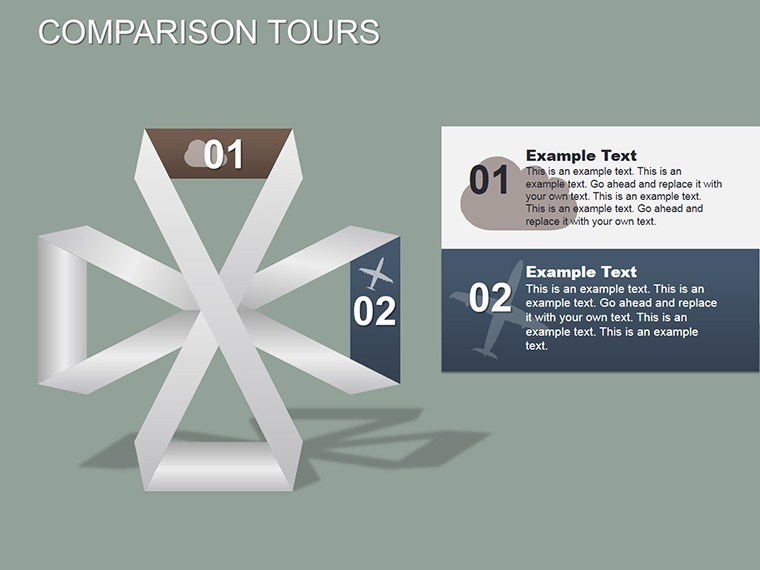
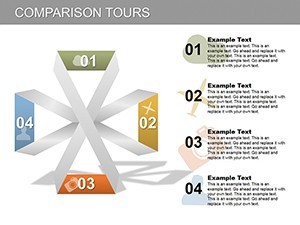
- Relational Web Icons: 35+ connectors and badges for schema strolls, adaptable to SQL vs. NoSQL battles.
- Tech Timeline Tours: Gantt hybrids contrasting adoption curves across eras.
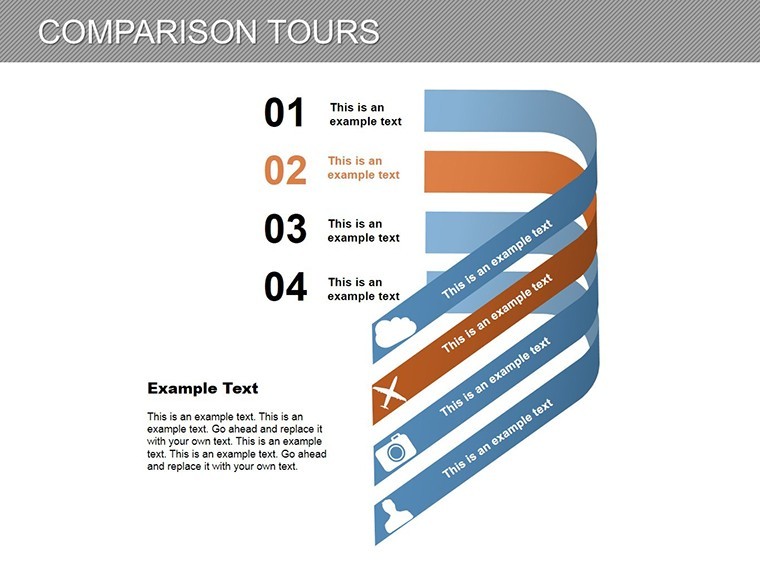
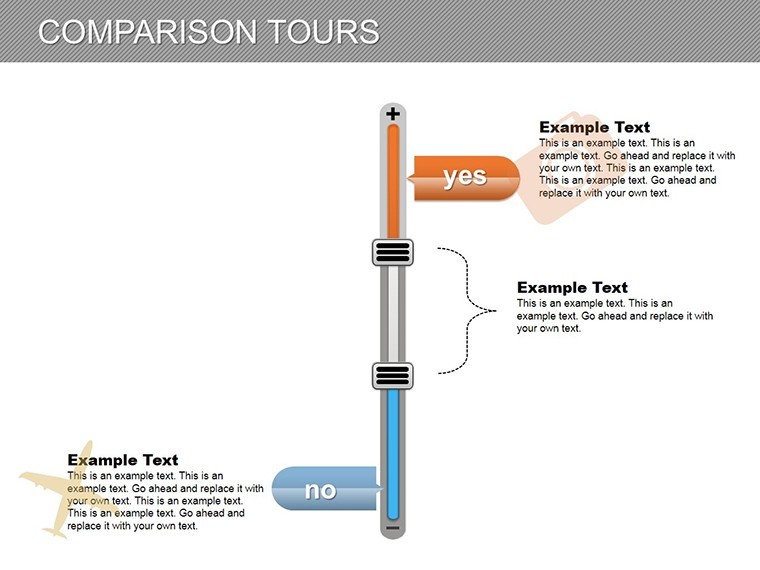
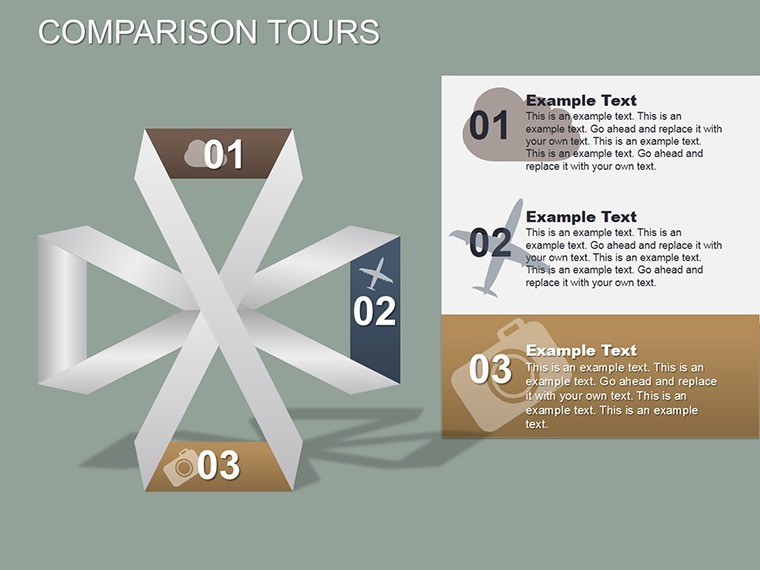
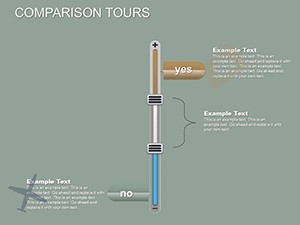
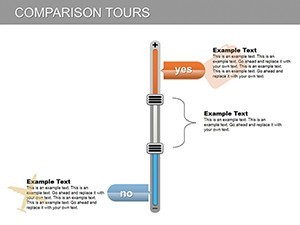
- Metric Matchup Modules: Dual-axis graphs for performance parallels, with formula-embedded diffs.
Guided by ACM computing standards, tip: Employ consistent node sizing for scale - enhancing trust in your tech tours.
Expeditions Explored: Teams Touring Triumphs
Recall Mia, a sysadmin at a fintech hub. Her server migrations meandered in memos; this template toured trade-offs via relational routes, accelerating approvals by weeks. BI consultants chart vendor vendettas, educators explore algorithm ancestries - versatility vast as a data delta, affirmed in IDC's comparison tool trends.
Seamlessly slipping in "comparison chart Keynote" and "database visualization templates," it courts comparative queries. Forsake the foggy; forge focused paths.
Embark on Your Tour: Phased Pathfinding
- Chart the Course: Keynote ingress; anchor at the overview slide's grand directory dome.
- Load the Ledger: Ingest from MySQL dumps - watch relations render responsively.
- Tailor the Trail: Master tweaks for thematic ties, like azure for cloud contrasts.
- Animate the Ascent: Path builds progressing through comparisons, paced for persuasion.
- Document the Discovery: Multi-export for archival adventures or collab continuums.
This itinerary innovates efficiency, per peer reviews, prioritizing patterns over pixels. Platform polymath? Universal usability assured.
Charting Charts: Why Tours Outpace Tables
Static spreadsheets stagnate; our tours traverse, embodying exploratory UI from UXPA guidelines. Budget binaries? They blunt; this blazes with bespoke brilliance.
Compelled to compare? Procure for $17 pronto and traverse truths.
Navigator Nuggets: Tips for Trailblazing Tours
Integrate with Tableau for teasers, polish herein. In AI audits, tour model merits - mirroring McKinsey's ML maturity maps. For equity, embed alt narratives for node nav.
As tours twist through data, discoveries dawn. This template: your expedition essential.
Launch your data odyssey - embark today.
Frequently Asked Questions
How do the comparison charts handle hierarchies?
Expandable trees allow nested tours, scaling from files to ecosystems.
Adaptable for non-tech comparisons?
Indeed, from budget battles to benefit breakdowns - broadly applicable.
Export to other tools?
Flawless to PowerPoint/Google Slides, retaining relational rigor.
Icon variety?
35+, from servers to synapses - sector-spanning.
Formula flexibility?
Built-in for diffs and ratios - dynamic derivations.
Top use realms?
IT, analytics, devops - data duel domains.