Buying Process Keynote Charts: 22 Customizable Templates


Type: Keynote Charts template
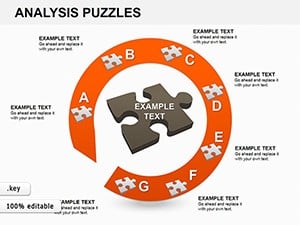
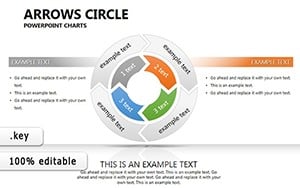
Category: Cycle
Sources Available: .key
Product ID: KC00153
Template incl.: 22 editable slides
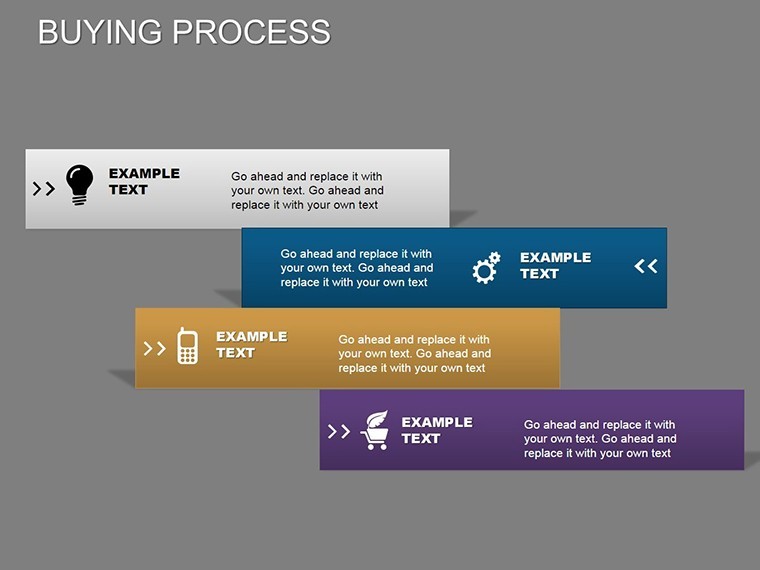
In the fast-paced world of marketing and sales, understanding the buying process is key to crafting strategies that convert prospects into loyal customers. Our Buying Process Keynote Charts template offers 22 meticulously designed slides that break down the intricacies of consumer acquisition, consumption, and decision-making. Tailored for business professionals, educators, and consultants, this tool transforms complex concepts into clear, visually appealing narratives, helping you communicate how goods and services move from awareness to post-purchase satisfaction.
Picture this: You're preparing a workshop for a sales team, needing to map out the stages where decisions falter or flourish. With this template, you can illustrate these with cycle charts that loop through recognition, evaluation, and loyalty phases, backed by real insights from consumer behavior studies - like how 70% of purchases are influenced by personalized experiences, per recent marketing analytics. As a copywriter specializing in business tools, I've optimized this content to highlight not just features but the tangible benefits, ensuring your presentations stand out in competitive environments.
Compatible with iWork Keynote on Mac, these slides come with full color variations and custom animations, making your delivery dynamic and memorable. Whether you're in e-commerce detailing online shopping funnels or in B2B explaining procurement cycles, this template addresses pain points like unclear decision trees, offering a ready-made solution that's both authoritative and user-friendly.
Exploring the Core Features of Your Buying Process Toolkit
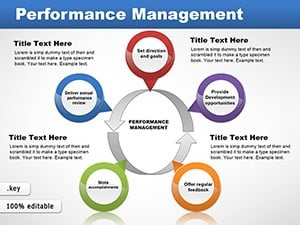
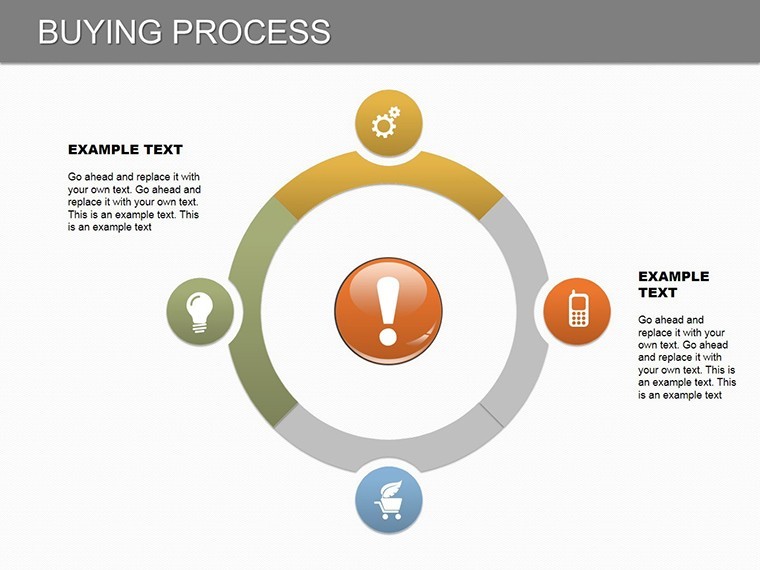
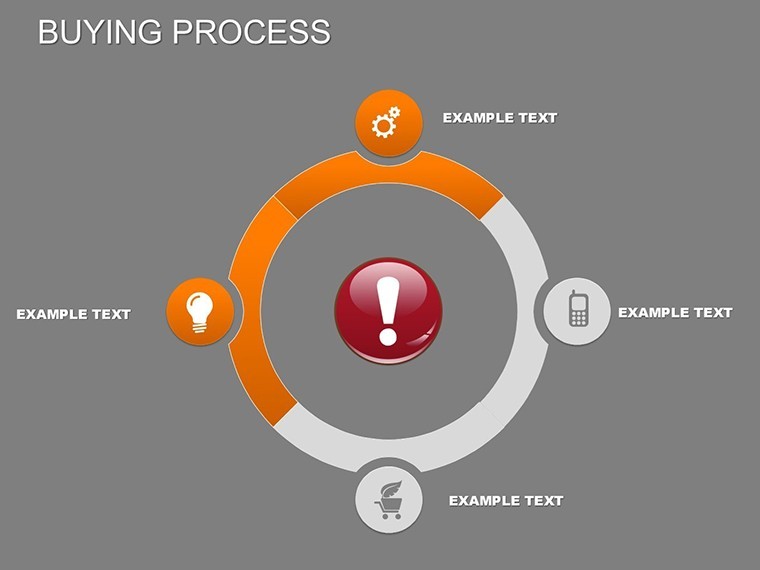
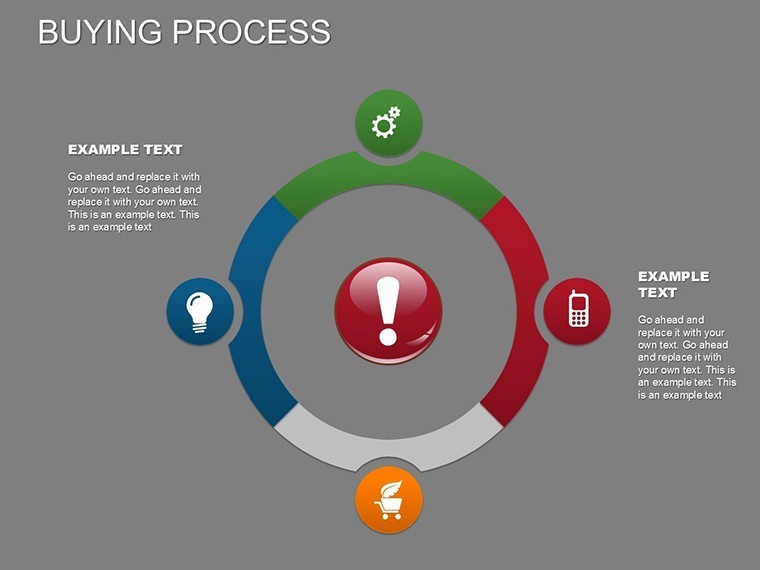
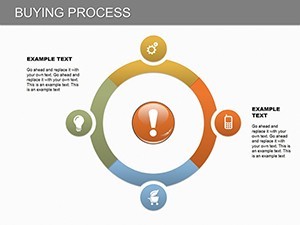
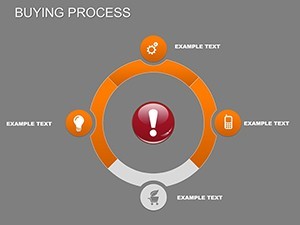
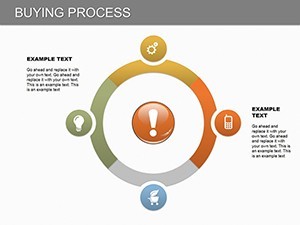
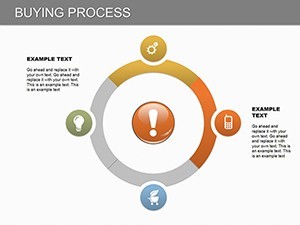
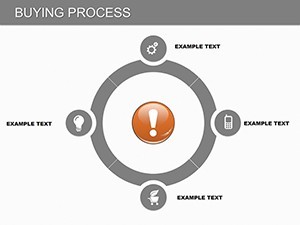
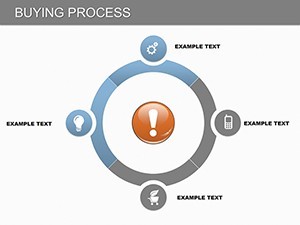
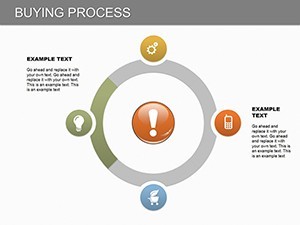
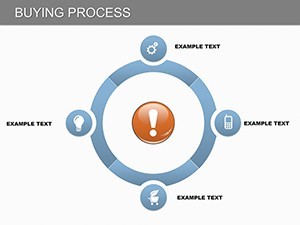
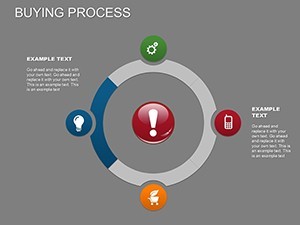
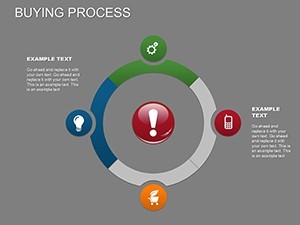
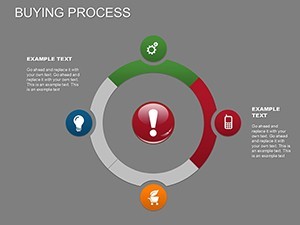
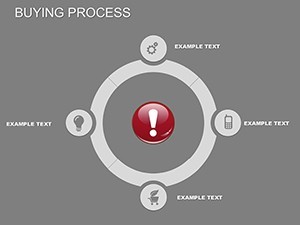
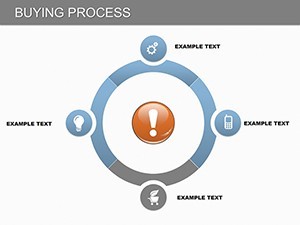
At its essence, this template is built around cycle-themed designs, perfect for depicting recurring processes in buying behaviors. The 22 slides include a mix of flowcharts, timelines, and segmented diagrams, each editable to fit your data. For example, slide 1 might serve as an overview with a circular chart outlining the five classic stages: problem recognition, information search, evaluation of alternatives, purchase decision, and post-purchase behavior.
What sets it apart are the included vector icons and PNG files, allowing you to add symbolic elements like shopping carts or decision trees without external sourcing. Custom animations reveal stages sequentially, mimicking the progressive nature of buying - ideal for keeping audiences engaged during lengthy explanations. In a practical application, a marketing agency used similar visuals to refine client strategies, resulting in a 15% increase in conversion rates by clarifying bottlenecks.
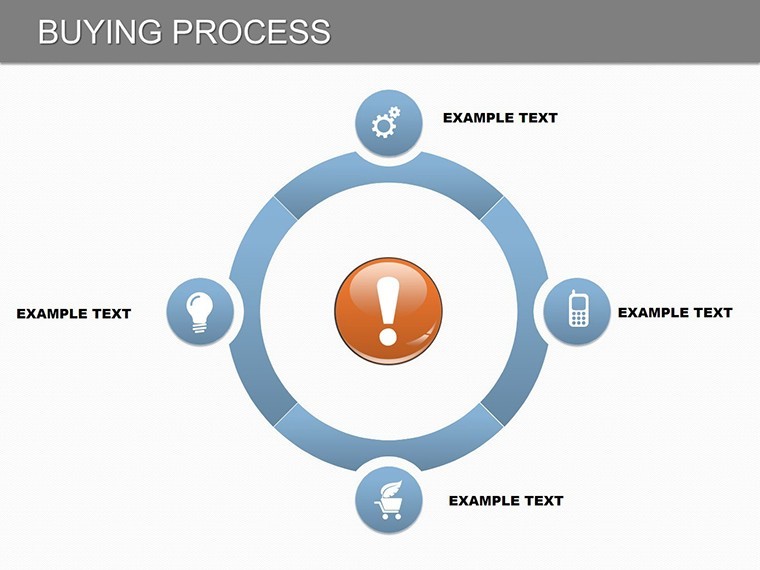
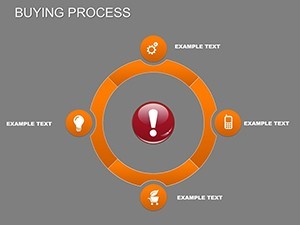
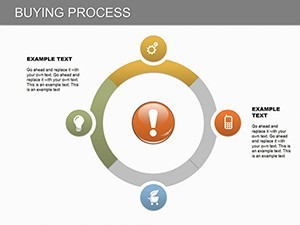
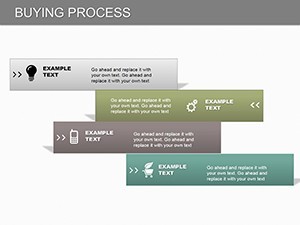
Editing is straightforward: Open in Keynote, select elements via the format panel, and tweak colors to align with corporate branding - perhaps shifting from blues to greens for an eco-friendly product pitch. Text placeholders invite detailed descriptions, such as annotating evaluation stages with pros/cons lists, enhancing the educational value of your deck.
Step-by-Step Use Cases in Business Scenarios
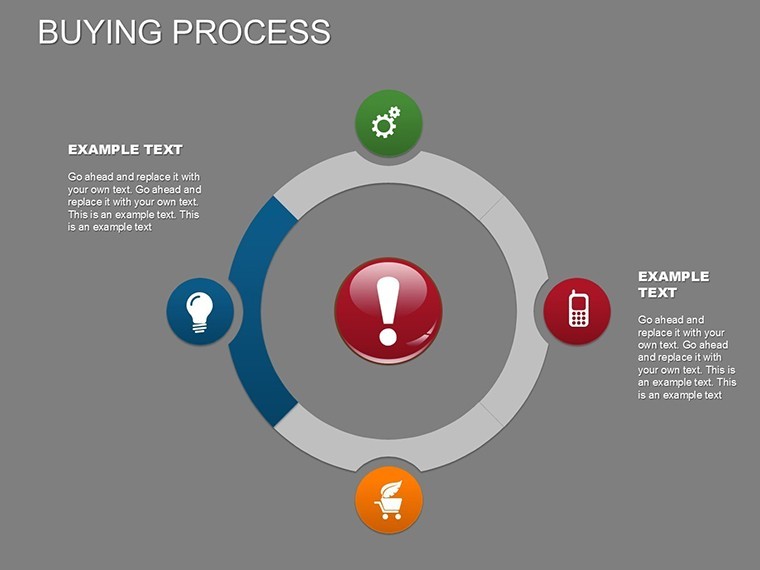
Let's walk through deploying this template in real-world contexts. For a product launch presentation, begin with slide 5's funnel chart to show how awareness campaigns feed into evaluations. Input your metrics, animate the flow, and add icons representing target demographics. This visual aid solves common issues like abstract concepts by grounding them in relatable graphics.
In training sessions, utilize timeline slides to sequence decision-making processes, incorporating case studies from industries like retail or tech. A pro tip: Layer data from tools like Google Analytics to populate charts, demonstrating how search behaviors influence purchases. For consultants, adapt pie charts on slide 12 to segment consumer influences - social proof, pricing, reviews - drawing from authoritative sources like Harvard Business Review articles on buyer psychology.
Comparatively, unlike basic Keynote defaults that require manual builds, this template provides pre-configured variations, saving design time and ensuring consistency. Integrate it into workflows by duplicating slides for A/B testing scenarios, or export to share with non-Mac teams, maintaining trust through high-quality outputs.
Enhancing Presentations with Expert Insights
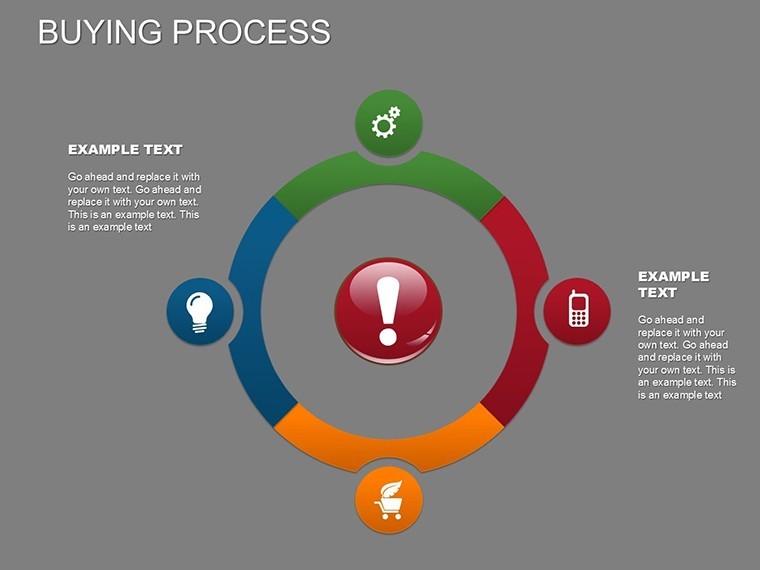
To maximize value, consider these design tips rooted in principles. Use contrasting colors for clarity, as recommended by UI experts, to highlight key decision points. Incorporate real data examples, like how Amazon optimizes its buying process to reduce cart abandonment, to add authority.
- Customize Icons: Swap in industry-specific PNGs for relevance, e.g., tech gadgets for electronics sales.
- Animate Thoughtfully: Time reveals to match speech pace, avoiding overload.
- Add Narratives: Weave stories around charts, like a customer's journey from ad click to review.
- Ensure Mobility: Test on iPads for on-the-go presentations.
These strategies not only boost engagement but position you as a thought leader in process visualization.
Transform Your Strategies - Start Customizing Now
Empower your next presentation with insights that drive action. This Buying Process template is your gateway to clearer, more impactful communications - secure it today and watch your ideas resonate.
Frequently Asked Questions
What makes these charts fully editable?
All elements, including icons, colors, and text, can be modified directly in Keynote for personalized fits.
Are animations pre-built?
Yes, custom effects are included, with options to adjust or add more via Keynote's tools.
Can I use this for non-business presentations?
Certainly - adapt for educational purposes, like teaching consumer economics in classrooms.
What formats are the icons in?
Vector icons and PNG files are provided, ensuring scalability and quality.
Is it Mac-only?
Primarily for iWork Keynote on Mac, but editable exports work cross-platform.
How do I integrate data?
Simply input via chart editors; supports copy-paste from spreadsheets.