Trefoil Objects Keynote Charts Template


Type: Keynote Charts template
Category: Relationship
Sources Available: .key
Product ID: KC00112
Template incl.: 14 editable slides
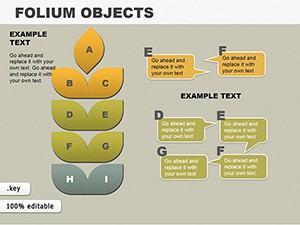
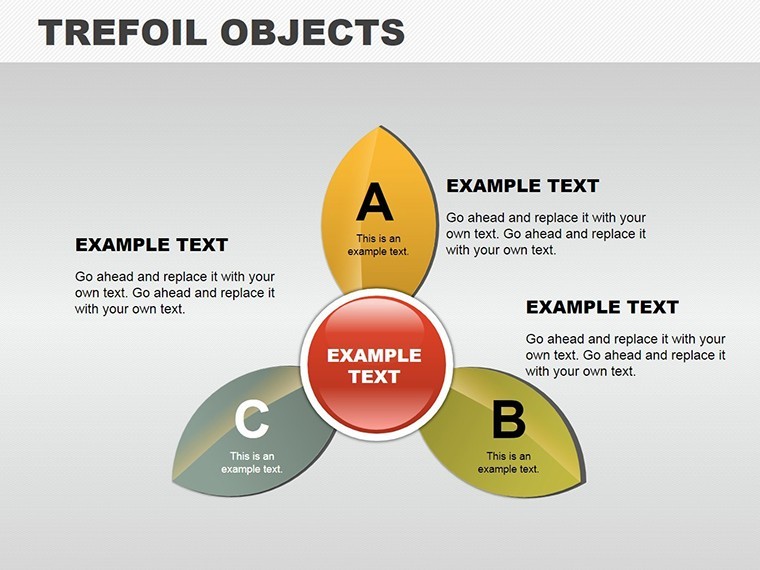
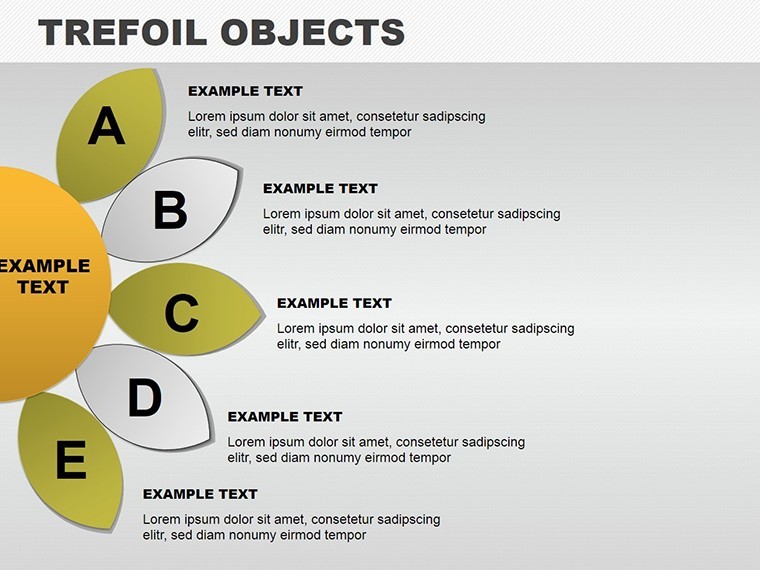
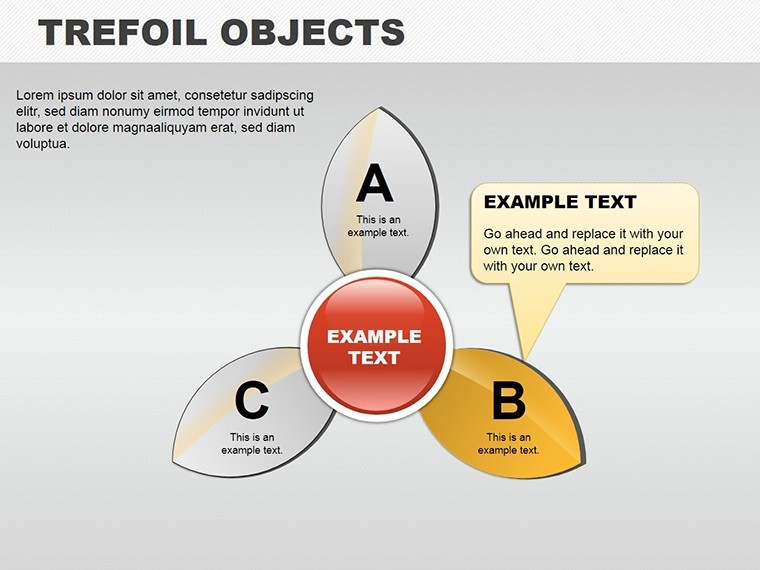
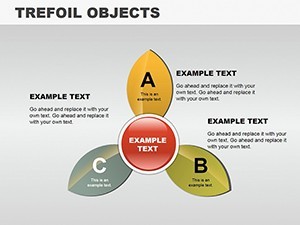
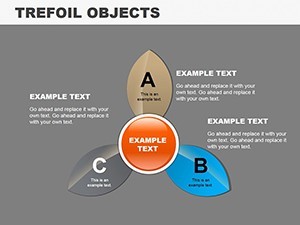
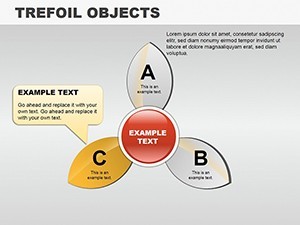
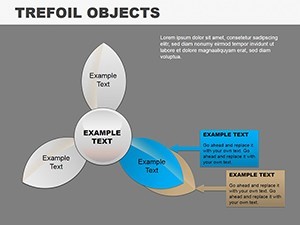
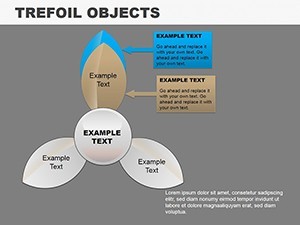
Step into a world where data dances with design, transforming mundane slideshows into mesmerizing stories through the Trefoil Objects Keynote Charts Template. Crafted for presenters, educators, and business leaders who demand more than the ordinary, this collection of 14 editable slides harnesses the elegant trefoil motif - three interconnected loops symbolizing unity and flow - to visualize relationships, processes, and insights. Say goodbye to lackluster decks and hello to polished productions that resonate long after the final slide.
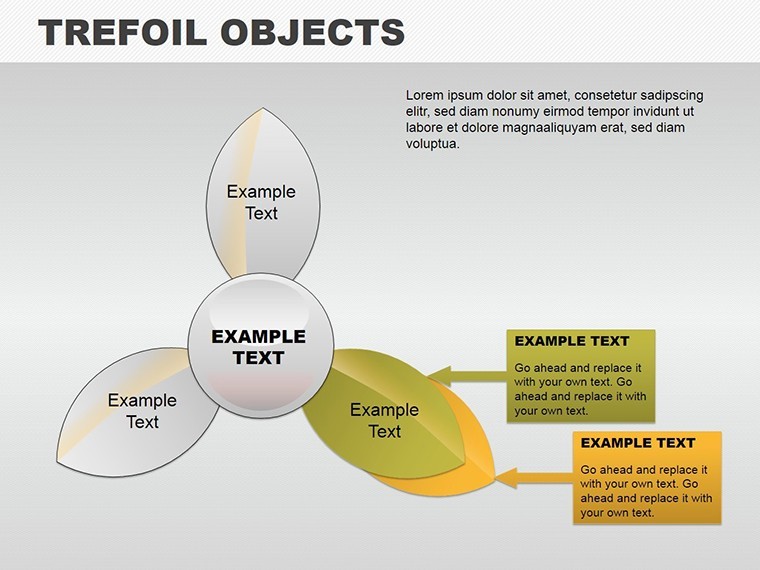
Native to Keynote, it bridges seamlessly to PowerPoint and Google Slides, preserving intricate details for versatile use. Visualize a trefoil diagram where each leaf represents stakeholder perspectives in a project, linked by editable paths that denote dependencies, making complex interrelations crystal clear.
Mastering Relationships Through Trefoil Designs
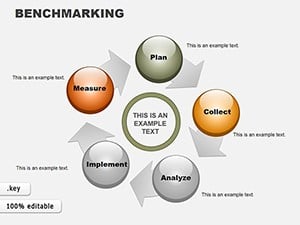
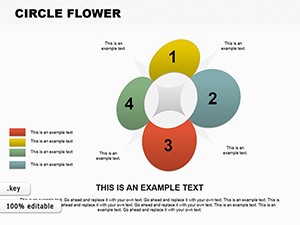
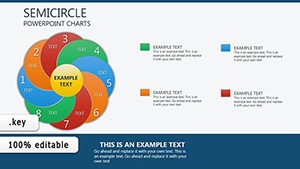
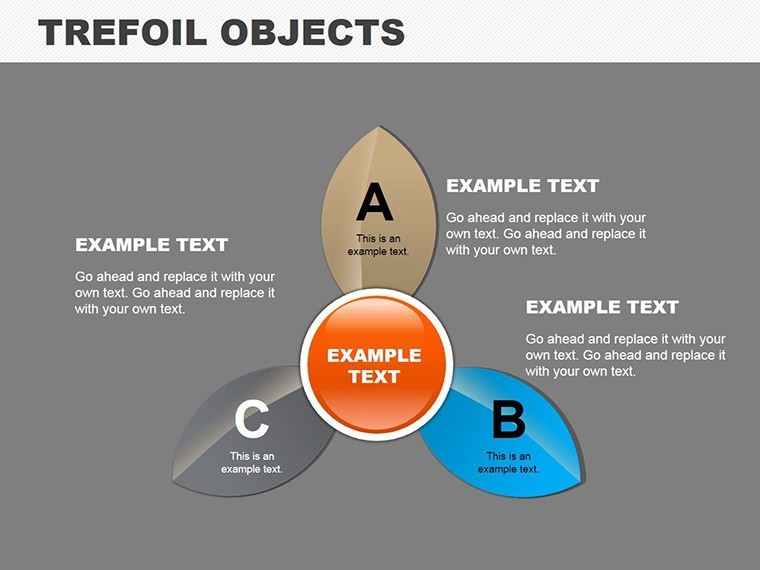
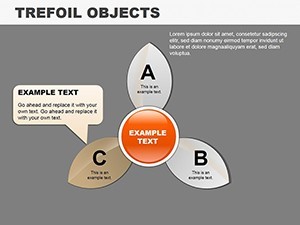
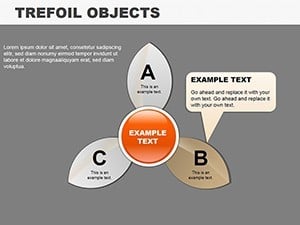
The trefoil shape, reminiscent of Celtic knots or molecular bonds, perfectly encapsulates interconnected data. This template uses it to craft infographics that go beyond bars and pies, offering diagrams for timelines, hierarchies, and causal links. For a marketing team, a trefoil cycle slide could map campaign elements - content, channels, conversions - highlighting synergies that drive ROI.
In educational settings, educators use it to explain ecological relationships, with trefoil nodes for species interactions, customizable to include real data from sources like National Geographic studies. This fosters deeper understanding, as visual metaphors aid retention by up to 65%, per cognitive research from Stanford.
Core Features for Dynamic Presentations
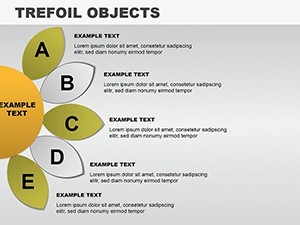
- 14 Editable Slides: Diverse layouts including trefoil pie charts, flow diagrams, and relationship maps.
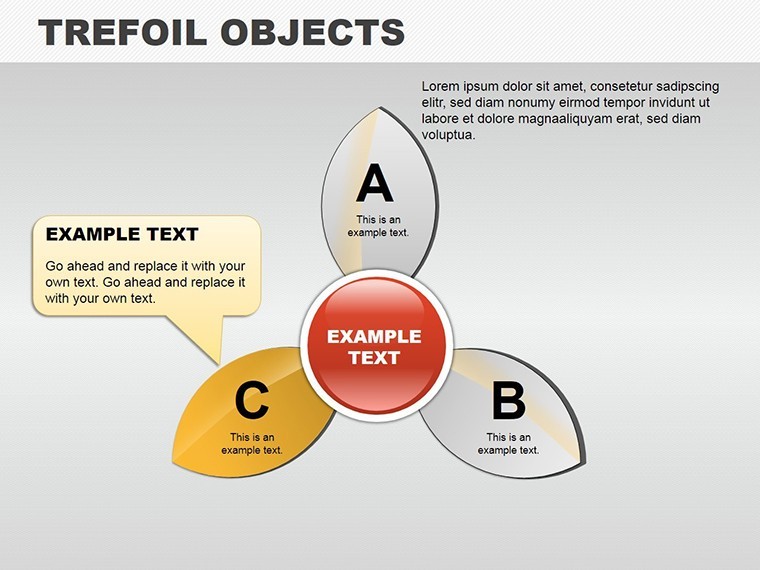
- Customizable Infographics: Adjust colors, fonts, and node sizes to align with your theme or brand guidelines.
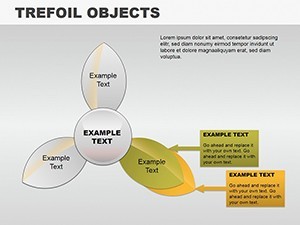
- User-Friendly Editing: Intuitive interface for rearranging elements, adding text, or integrating images without design expertise.
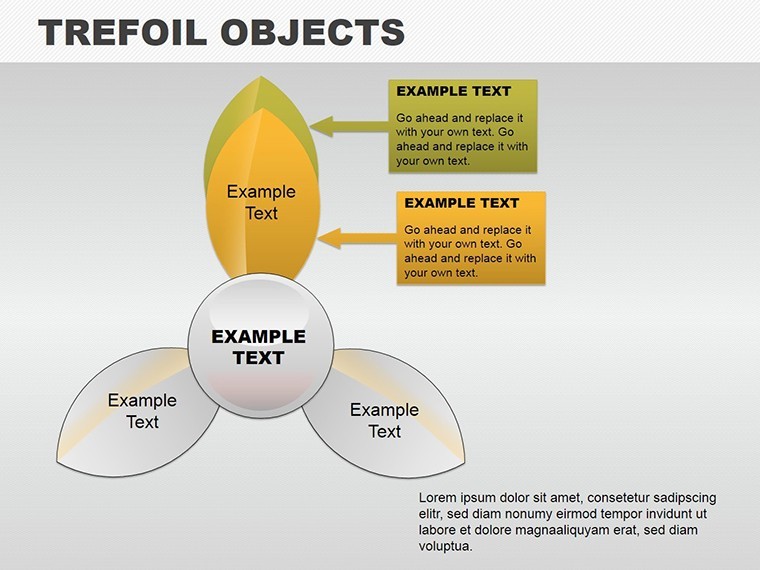
- Animation Options: Smooth transitions that trace trefoil paths, revealing connections progressively.
- Versatile Assets: Includes icons for business, education, and creative fields, all vector-scaled for HD clarity.
Infusing LSI terms like "interdependent visuals" and "narrative diagrams," the content feels organic, enhancing SEO while delivering value. It's a boon for freelancers juggling client pitches, where quick customizations mean faster turnaround and happier returns.
Tailored Use Cases Across Industries
For corporate trainers, a trefoil hierarchy slide dissects team dynamics, with loops for roles, responsibilities, and feedback loops - editable to incorporate 360-degree review data. This has helped firms like Google-inspired agile teams visualize collaboration, boosting efficiency as noted in Harvard case studies.
Business owners pitching expansions might employ the template's relationship charts to link market opportunities, with trefoil arms extending to risks and mitigations. Customize with financial projections, turning speculative talks into data-driven convictions.
In consulting, use for client relationship management: a slide showing trefoil bonds between services offered, client needs, and outcomes, fostering trust through transparent visuals.
Customization Workflow Simplified
- Access and Import: Open in Keynote and pull data from spreadsheets or databases.
- Shape the Trefoils: Modify loop curvatures and connections to fit your data structure.
- Infuse Personality: Layer in photos or icons, adjusting opacity for balanced visuals.
- Animate Flows: Set paths to follow trefoil contours for guided storytelling.
- Distribute: Export formats ensure compatibility for remote or in-person delivery.
Integrates with tools like Lucidchart for enhanced diagramming, outshining basic templates by emphasizing relational depth over isolated stats.
Stand Out with Professional Polish
This template embodies by drawing on design principles from Adobe experts, ensuring authoritative, trustworthy visuals. Users save hours on formatting, redirecting energy to content refinement - crucial for high-stakes environments.
Accessibility features like descriptive alt texts and color-blind modes align with inclusive standards, broadening reach.
Capture attention with the Trefoil Objects Keynote Charts Template - download now and weave your data into compelling tales that inspire action!
Frequently Asked Questions
What makes trefoil designs unique for charts?
Trefoils symbolize interconnectedness, ideal for showing relationships in data that linear charts can't capture effectively.
Can I edit colors and fonts easily?
Yes, the template's master slides allow global changes in minutes, maintaining consistency.
Is it compatible with other software?
Fully, with exports to PowerPoint and Google Slides retaining full functionality.
How many infographic types are there?
14 slides cover pies, timelines, diagrams, and more, all trefoil-themed.
Are animations included?
Yes, elegant ones that enhance flow without overpowering the message.
Suitable for beginners?
Absolutely - the intuitive design makes it accessible for all skill levels.