Vortex Spiral Cycle Keynote Charts - Instant Download | ImagineLayout


Type: Keynote Charts template
Category: Cycle
Sources Available: .key
Product ID: KC00142
Template incl.: 16 editable slides
Files and Formats Included
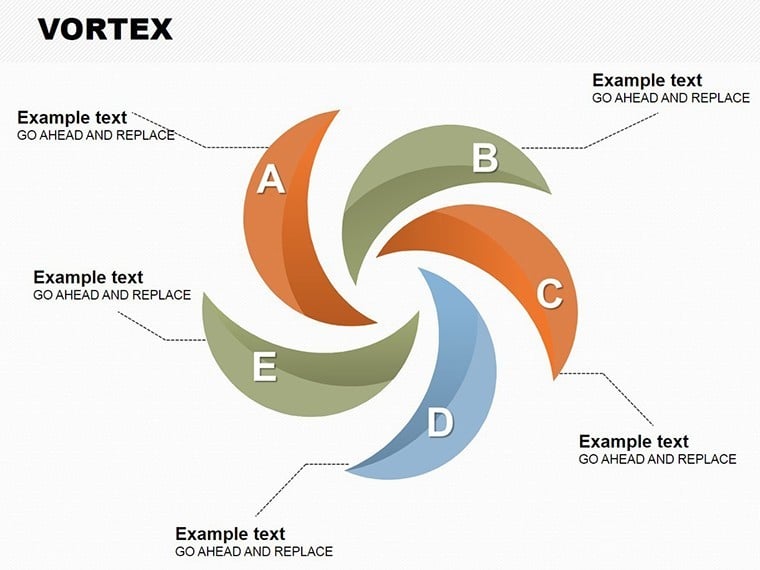
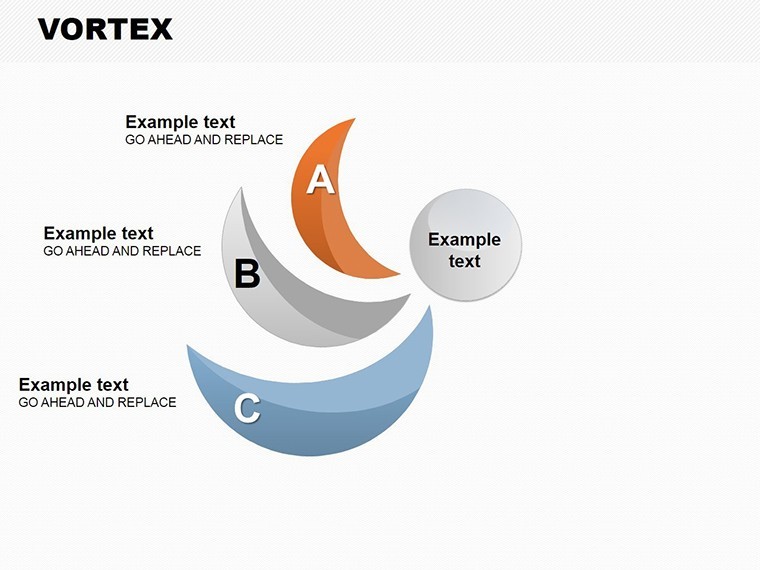
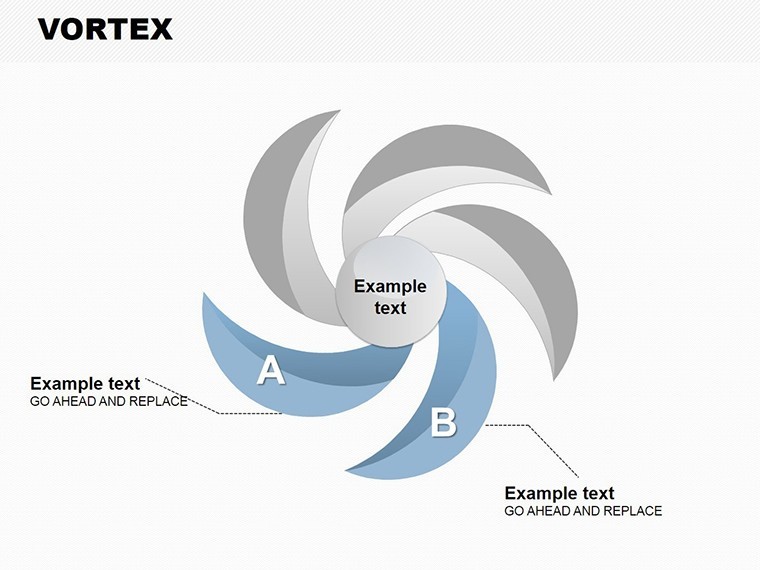
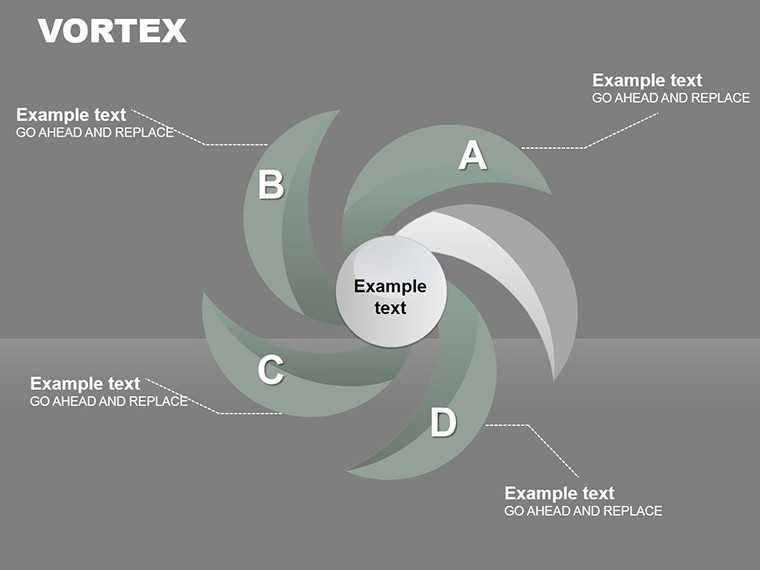
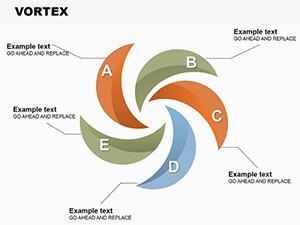
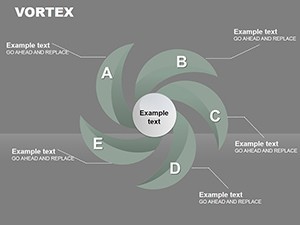
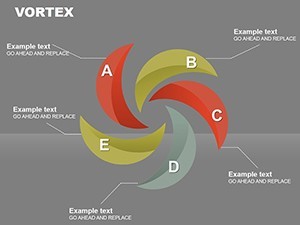
The package delivers one 16-slide .key file with vortex cycle diagrams.
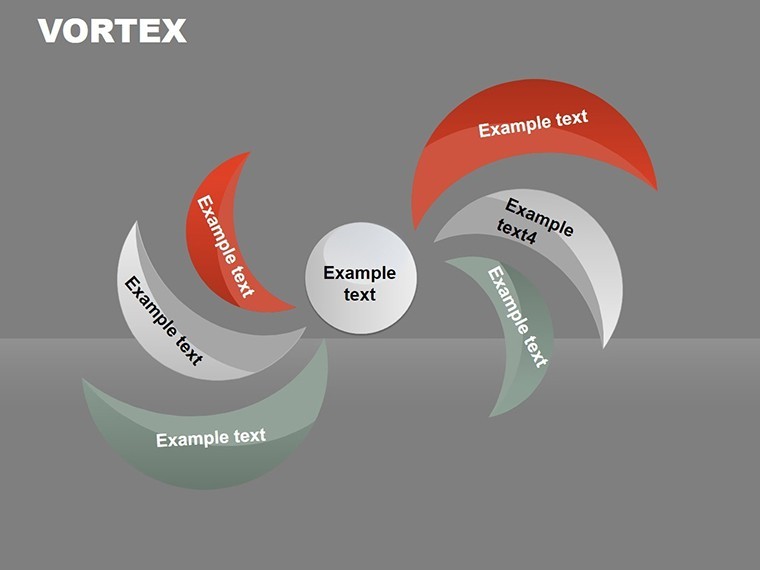
Animated elements appear on every spiral layout.
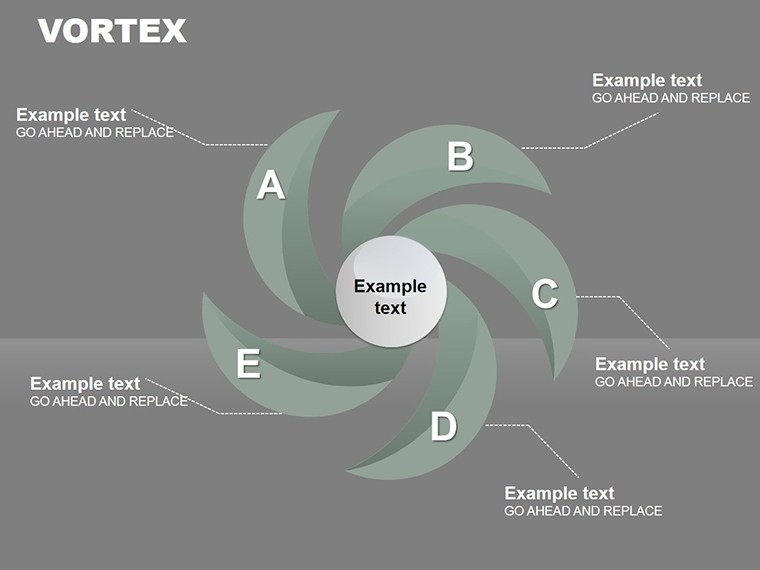
Legends and tooltips accompany each chart.
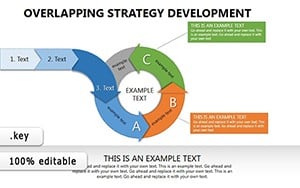
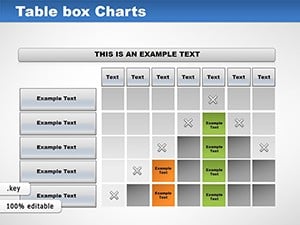
Animated vortex visuals distinguish this from Network Charts and Overlapping Strategy templates by supporting complex project storytelling.
All diagrams load ready for immediate editing.
Key Specifications
| Feature | Details |
|---|---|
| Slides included | 16 vortex cycle charts |
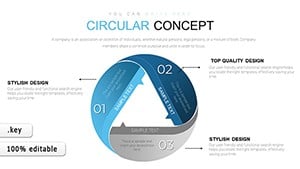
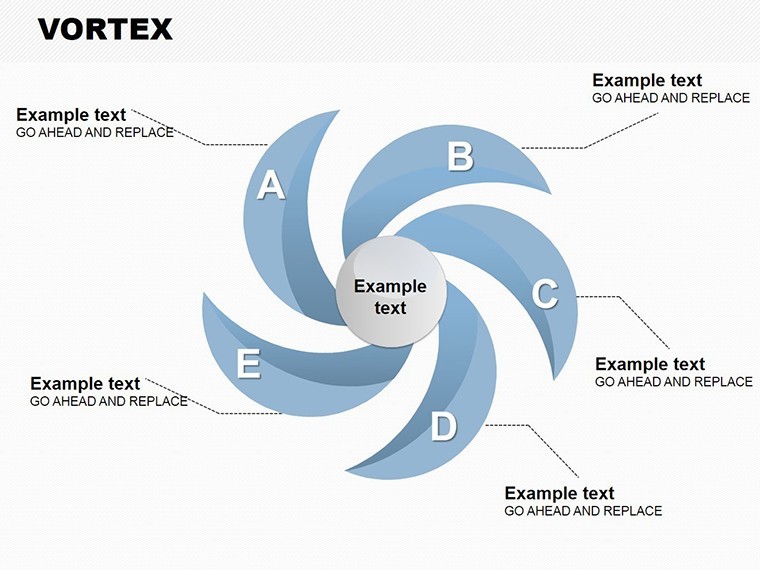
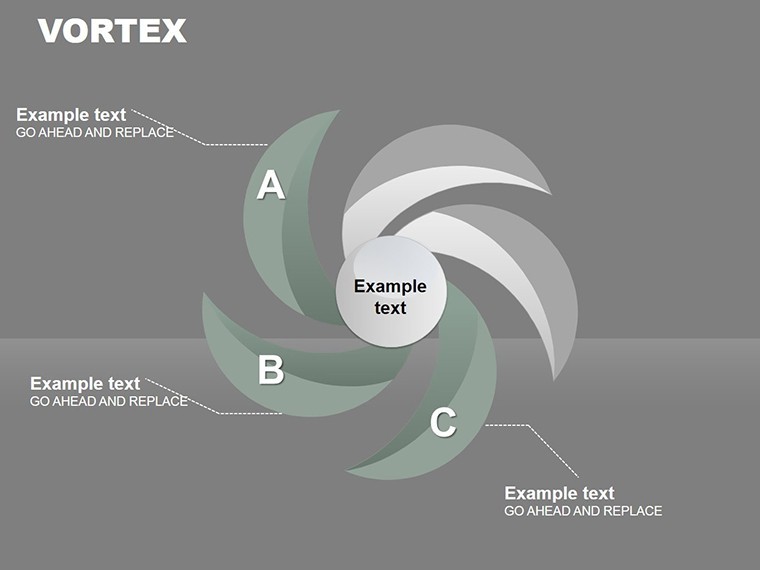
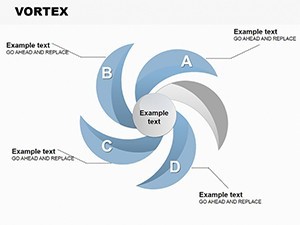
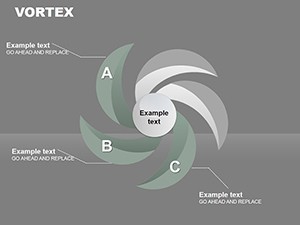
| Diagram categories | spiral data flow |
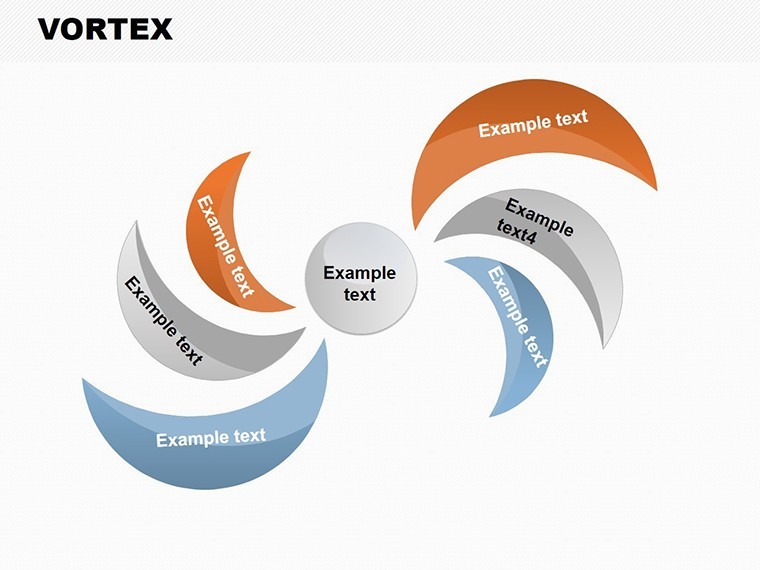
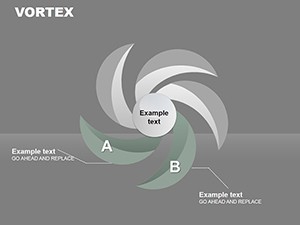
| Editable elements | segments resize independently |
| Aspect ratio | 16:9 widescreen |
| Keynote compatibility | version 12 and later |
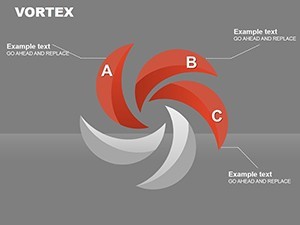
| Color themes | master palette adjustments |
Icon layers replace without layout shift.
Animation support stays manual but ready.
This maintains strong information spacing.
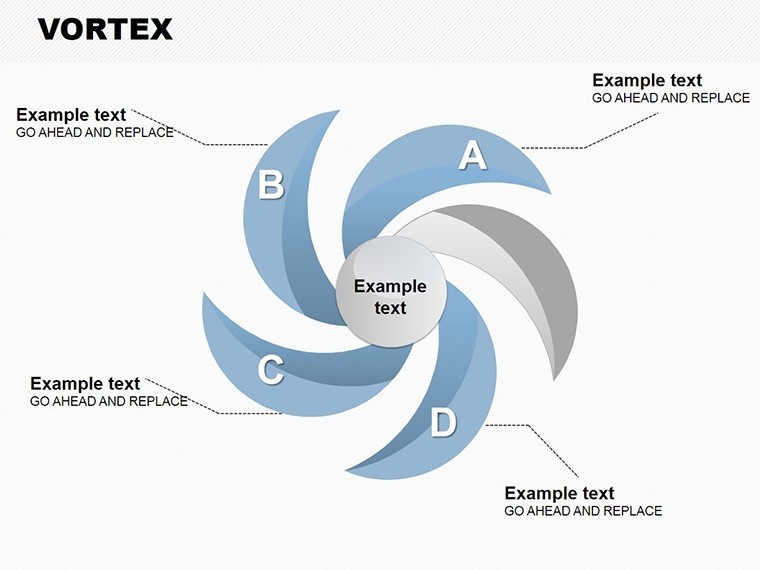
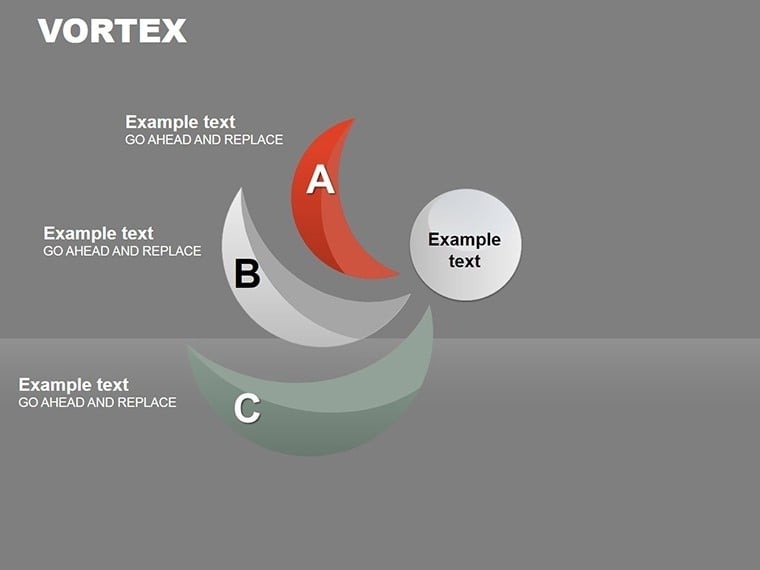
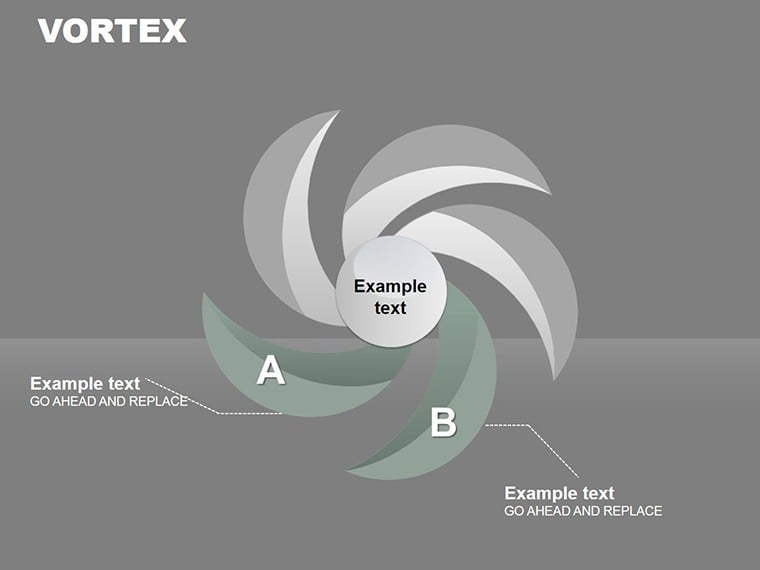
Zone segmentation follows natural flow direction.
From Download to Final Deck
1. Open the .key file in Keynote 12+ (1 minute).
2. Swap vortex data labels and adjust animation timing (4 minutes).
3. Update color themes via the inspector (2 minutes).
4. Export as PDF or retain editable format (1 minute).
The workflow rates moderate for standard Keynote users.
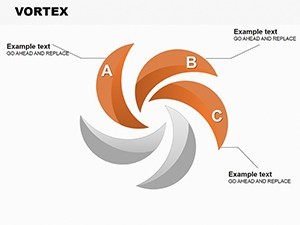
Diagram connectors adjust without regrouping.
Text placeholders keep layout composition intact.
Typical Use Cases by Role
Architects in construction firms use the spiral cycles to map project phases in client proposals.
They reuse the file across three reports by simply swapping color schemes.
Trainers in corporate education apply animated vortices for process training sessions.
They cut preparation time from 3 hours to 45 minutes with direct label edits.
Consultants in strategy firms rely on vortex flow for board briefings.
Download the Spiral Cycle Charts Keynote Template now and present in minutes.
Building From Scratch vs. Starting Here
Creating spiral cycles manually takes 5 hours and precise alignment skills.
Typical mistakes involve broken animation paths and uneven ring spacing.
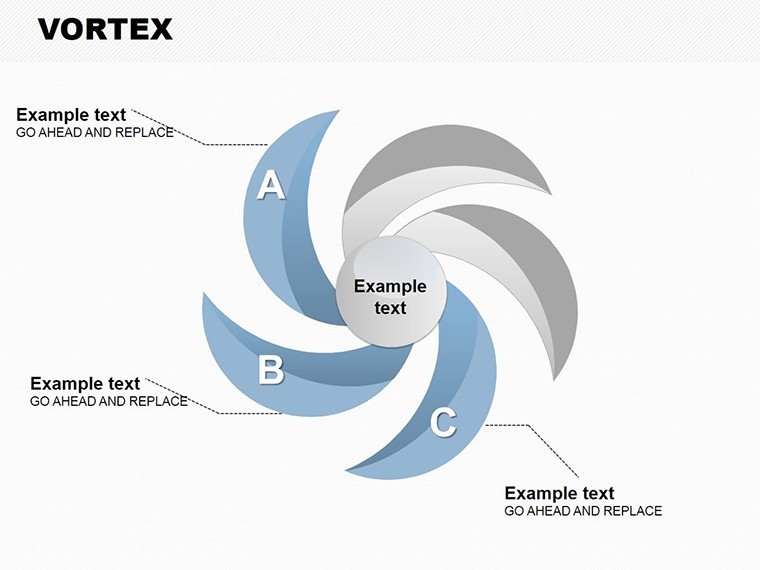
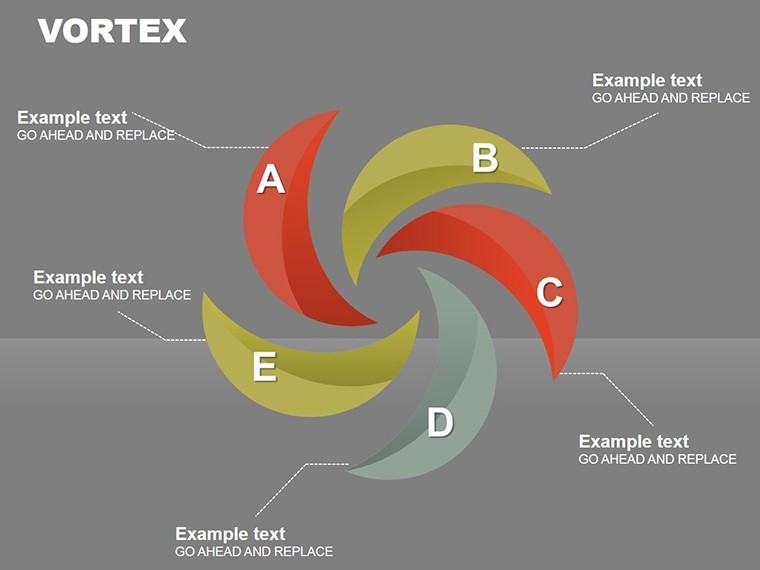
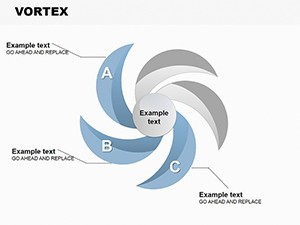
This template keeps tooltips outside the main vortex.
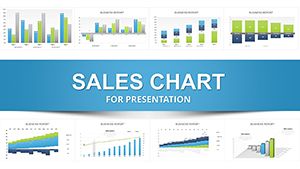
Many charts embed legends inside spirals which reduces readability on large screens during sales report presentations.
The paid version supplies the full animated .key file unlike free previews.
Get the Spiral Cycle Charts Keynote Template for $5 and start mapping cycles visually right away.
Which Keynote versions does this template support?
It works in Keynote 12 and newer releases. Older versions may lose animation timing. Verify the file right after download. Support can assist with version-specific fixes.
How do I change the color scheme?
Click any spiral segment. Open the Format panel and select new fills. Update the slide master to propagate changes. The full set of 16 diagrams adopts your colors without further tweaks.
What does the license allow for client work?
Client presentations and consulting decks remain allowed. Resale of the file itself is not permitted. Internal training use stays fine. Keep the original license reference visible.
What does the paid version include compared to free?
The paid version gives the complete 16-slide .key with animations enabled. Free previews display static screenshots only. Full tooltips and vortex layers become available instantly. No restrictions appear in the downloaded file.
What software is required and what is the refund policy?
Keynote 12 or above is mandatory. Refunds issue within 7 days for compatibility failures. Submit your exact error and version. Support evaluates each request case by case.