Business Timeline Keynote Template - Fully Editable | ImagineLayout


Type: Keynote Charts template
Category: Timelines
Sources Available: .key
Product ID: KC00084
Template incl.: 24 editable slides
X Diagrams, Y Color Schemes: What You Get
24 slides.
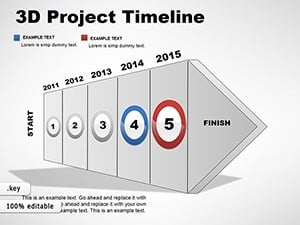
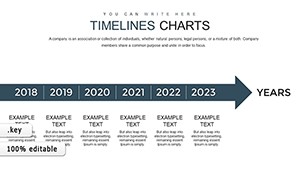
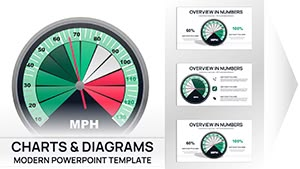
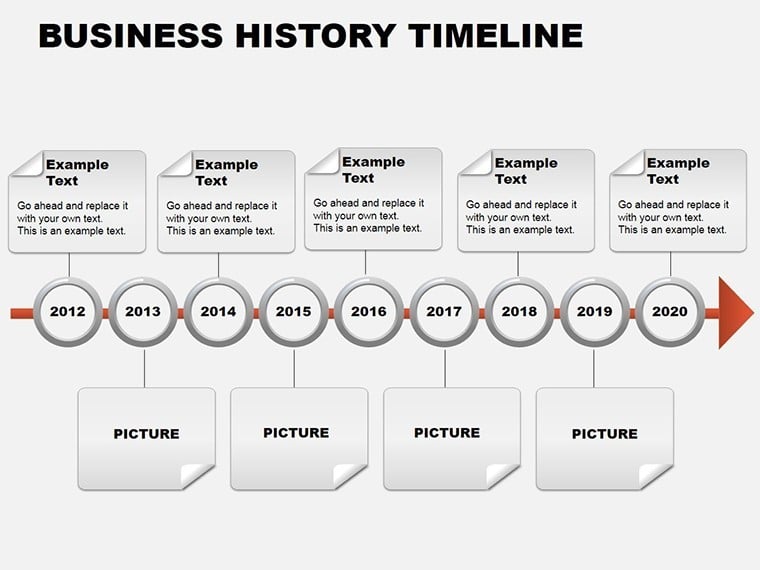
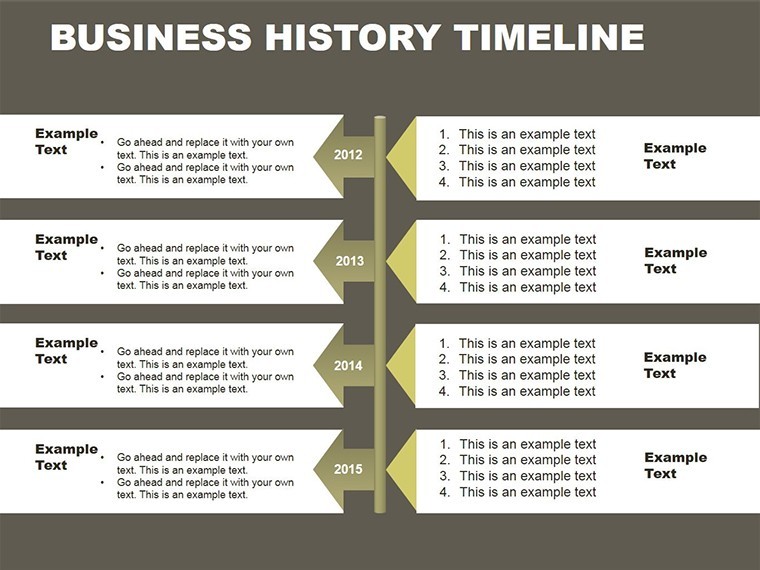
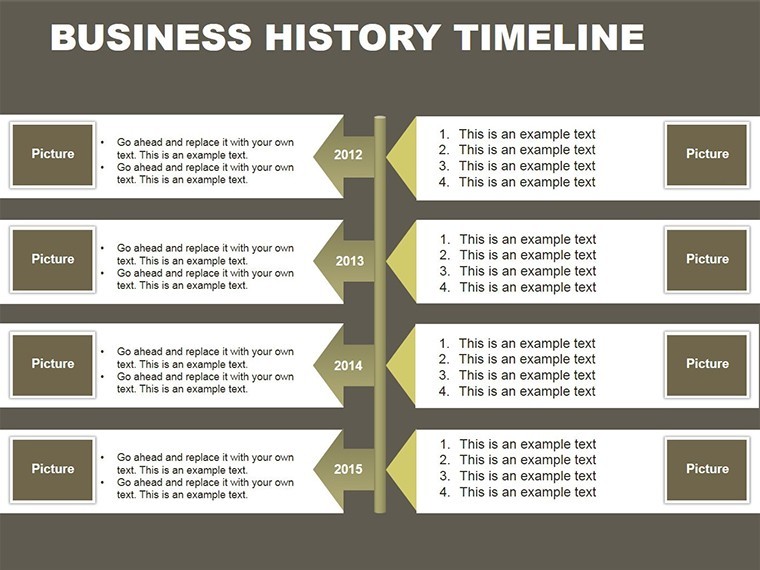
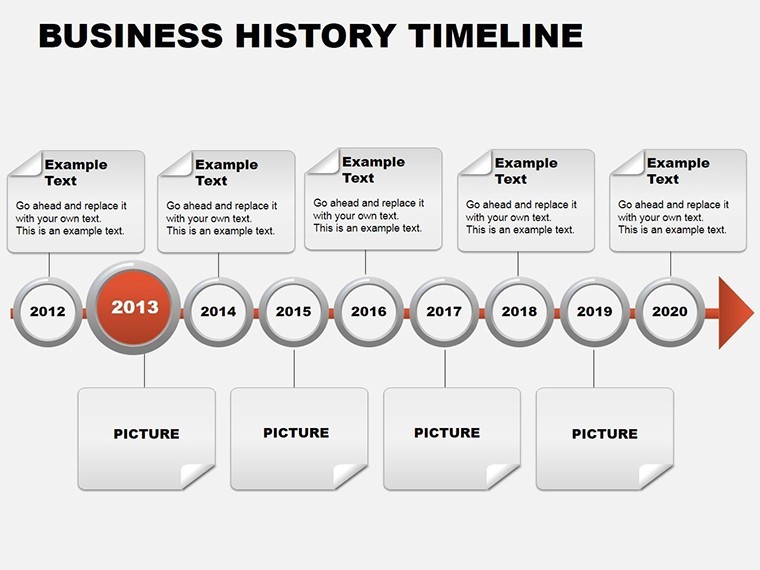
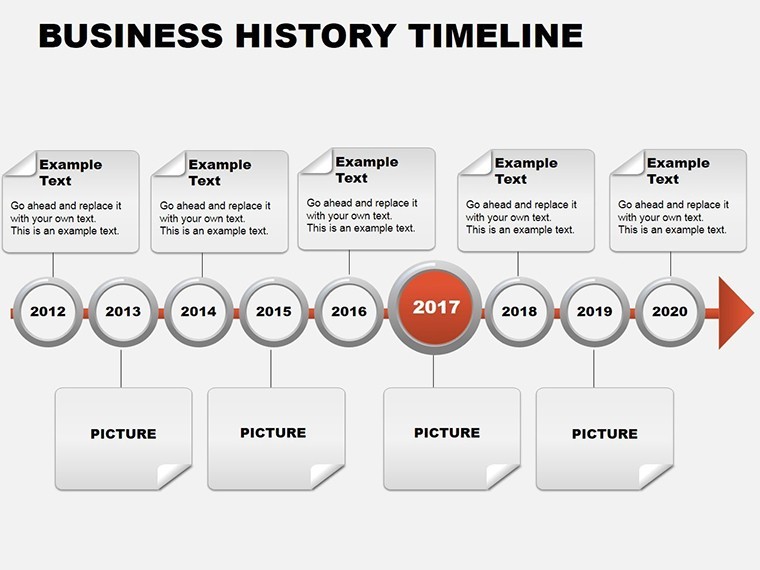
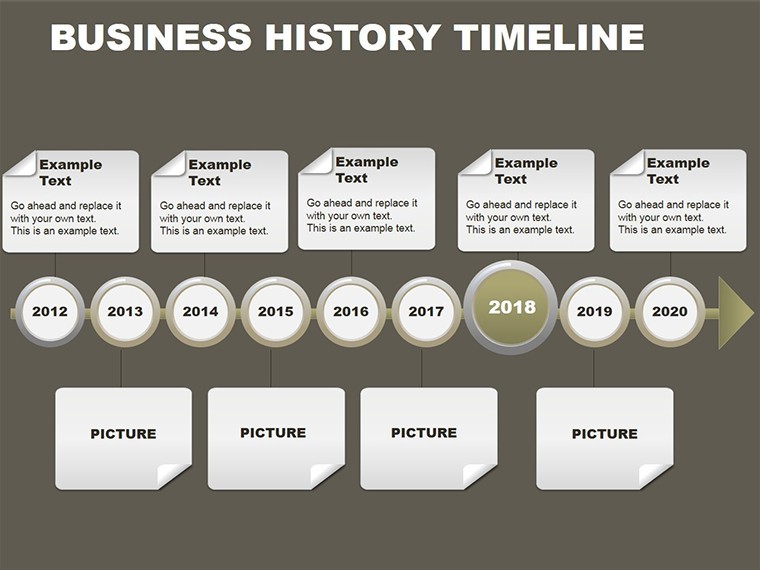
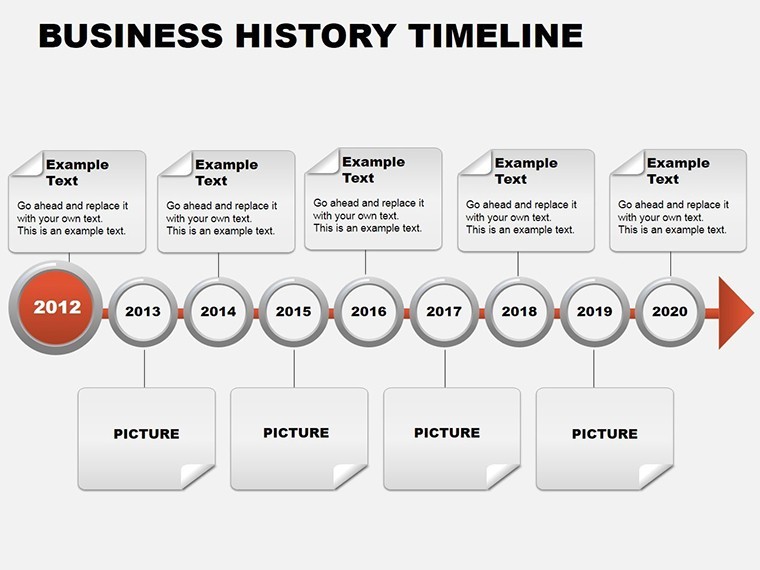
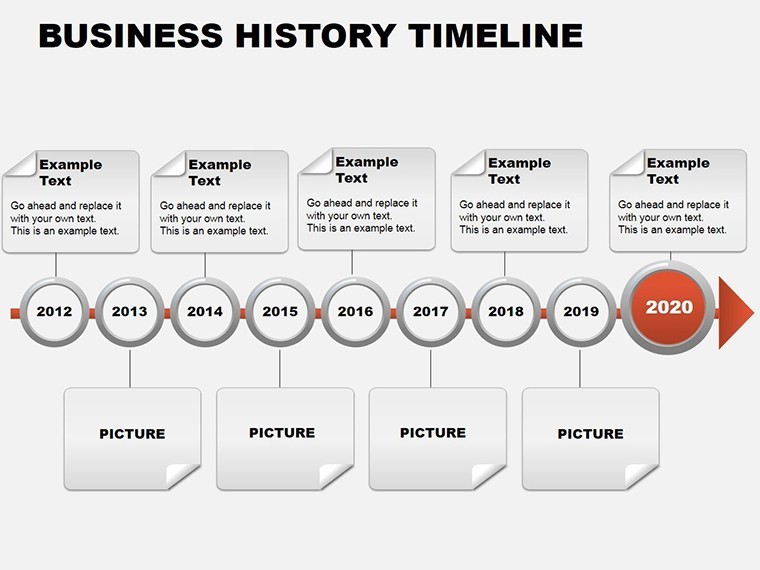
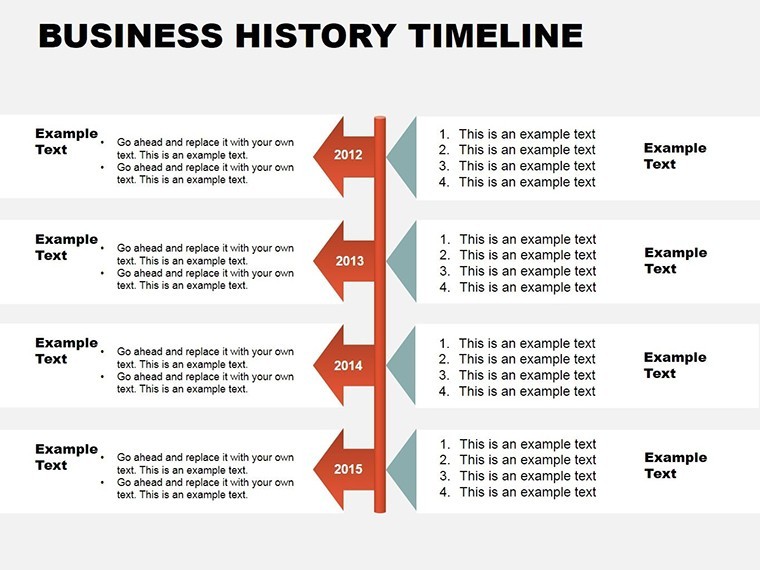
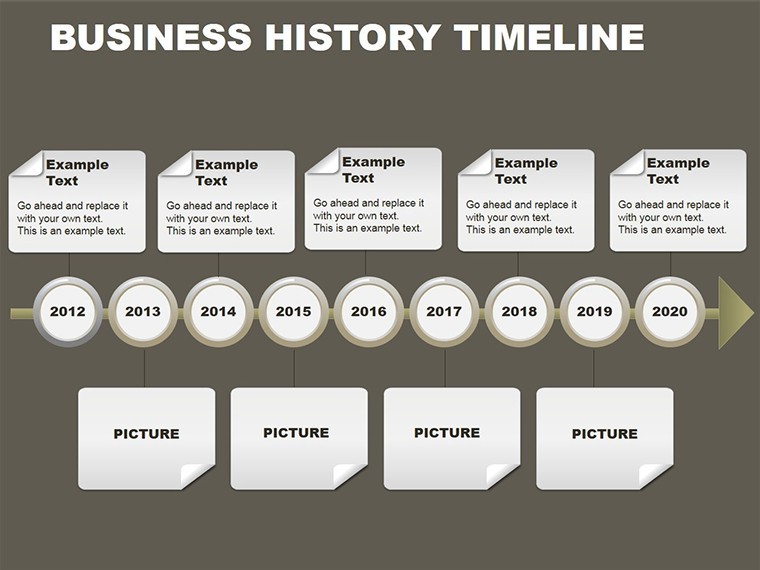
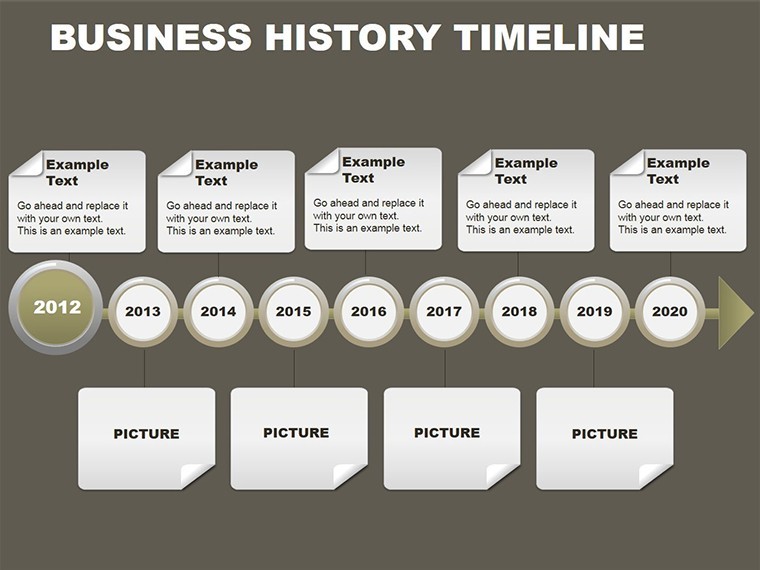
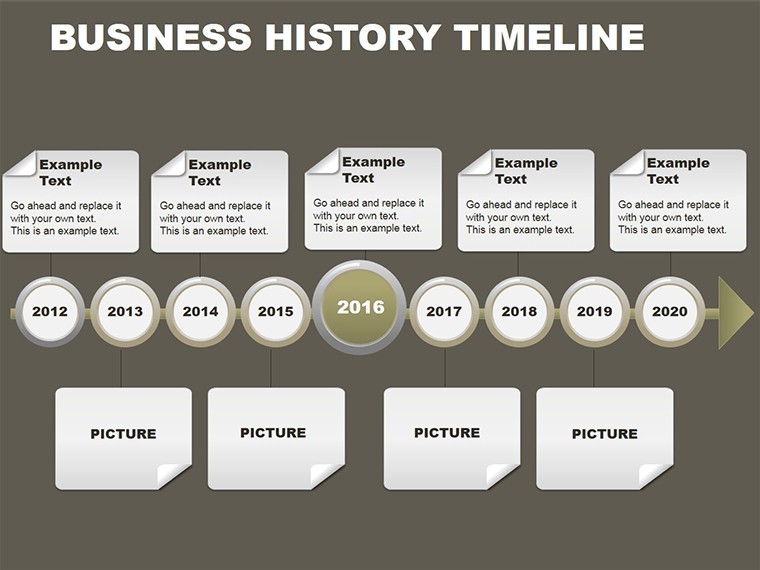
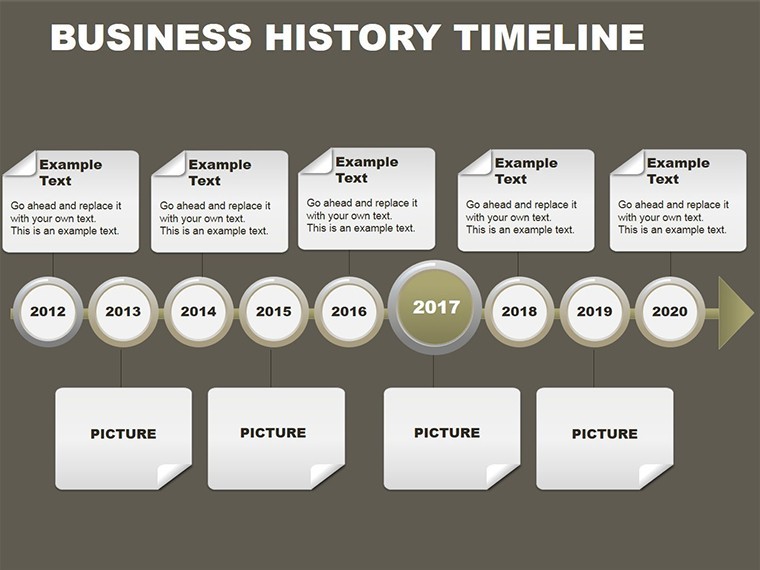
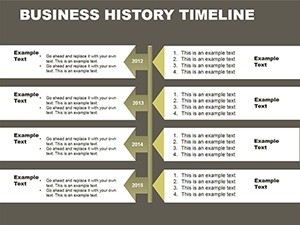
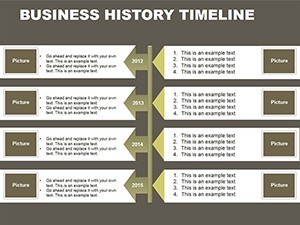
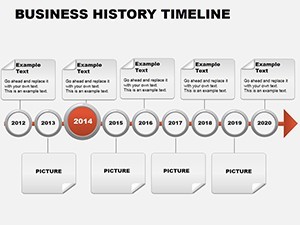
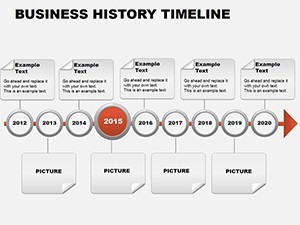
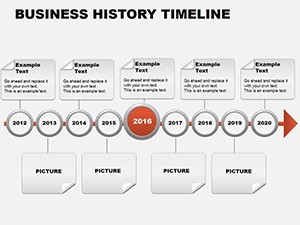
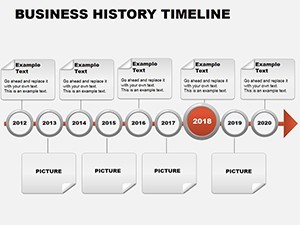
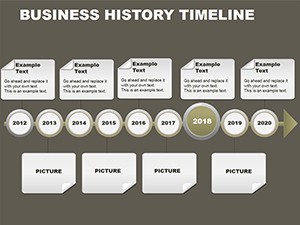
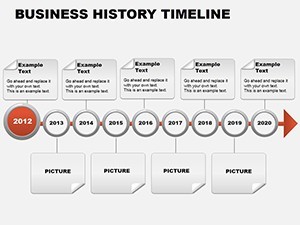
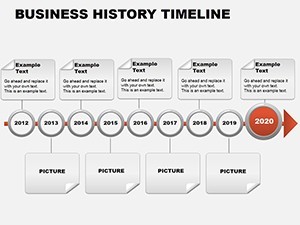
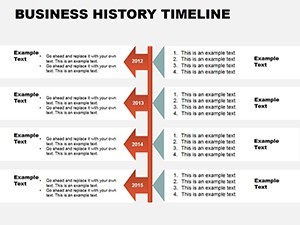
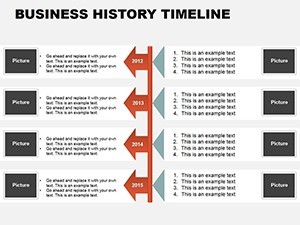
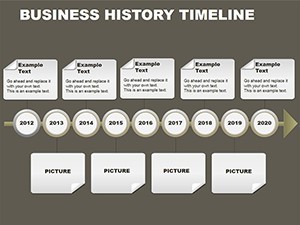
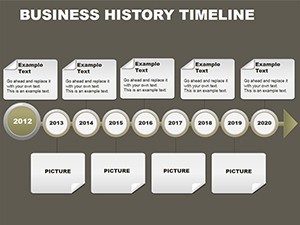
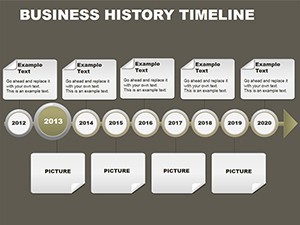
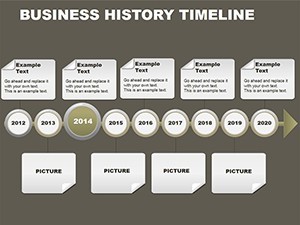
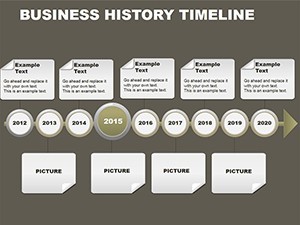
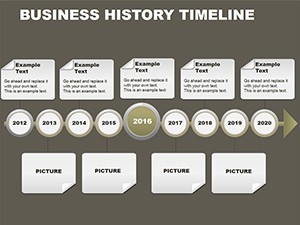
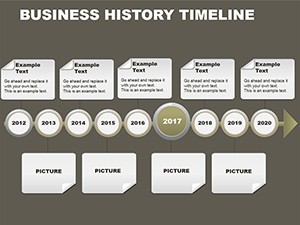
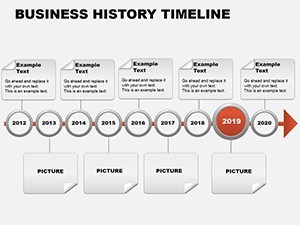
Linear circular Gantt and milestone layouts with embedded bar and pie charts appear.
One .key file delivers the full set.
Aspect ratios include 16:9 4:3 and 16:10.
Annual report and investor pitch designs support board briefings.
Format and Compatibility Details
| Feature | Details |
|---|---|
| Slides included | twenty four timeline slides |
| Diagram categories | linear circular Gantt milestone |
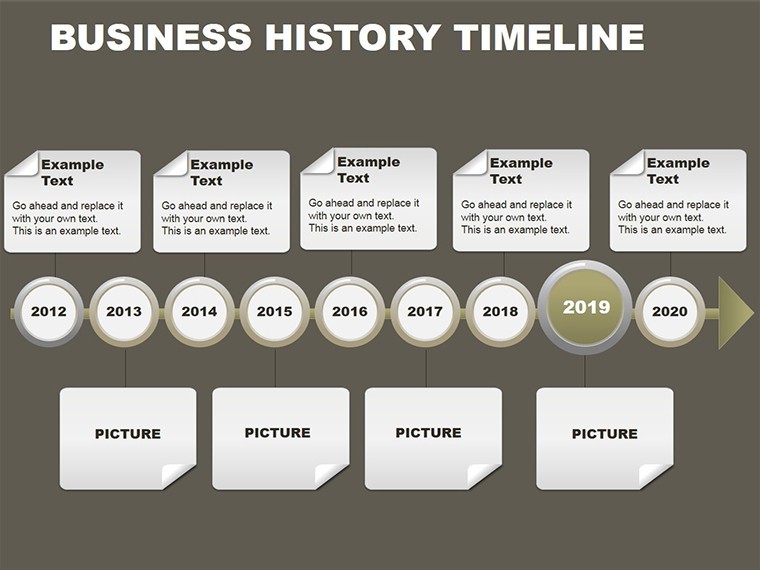
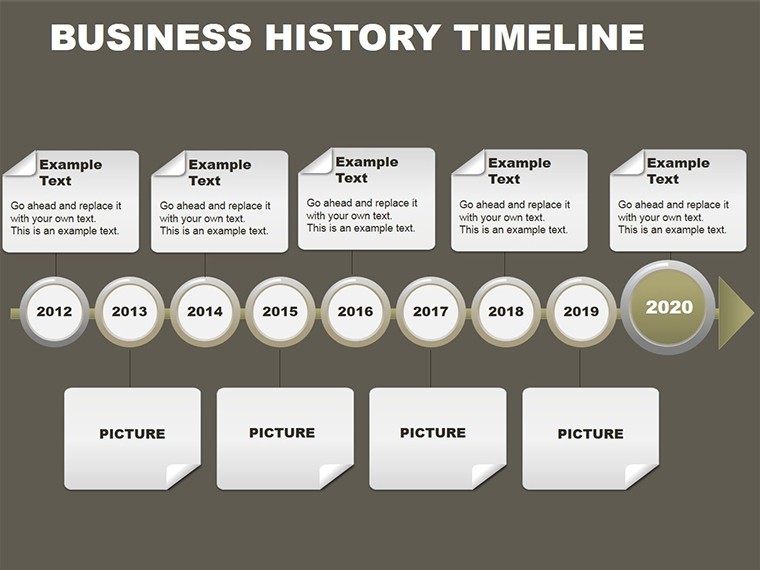
| Editable elements | date labels milestone icons color theme adjustments |
| Aspect ratio | 16:9 4:3 16:10 |
| PowerPoint compatibility | Keynote native no conversion needed |
| Icon layers | milestone icons recolorable independently |
File formats stay Keynote only.
Diagram connectors adjust direction freely.
From Strategy Decks to Boardroom Pitches
Executives in manufacturing map project phases.
They reuse the same file across three client reports by swapping color schemes.
Regional sales directors in tech update milestones and cut preparation from four hours to fifty minutes.
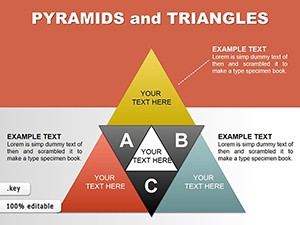
HR specialists combine this business timeline template with SWOT charts from our SWOT category when presenting performance reviews.
This template differs from its three closest related templates.
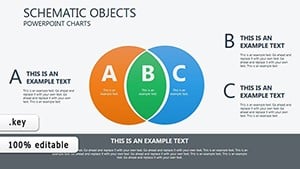
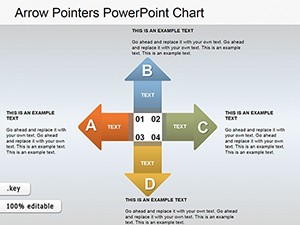
Venn Diagram stays static while Arrow Pointers focus on direction and 3D Project stays volumetric.
Here embedded charts and multiple layouts support company storytelling.
One specific visual characteristic is the circular milestone rings with embedded pie segments.
It works best for annual reports and investor pitches.
Company story visualization allows faster updates than general pointer neighbors.
The paid version includes all twenty four slides and embedded charts.
No free version limitations appear on page.
Download the Business Timeline Keynote Template now and map your milestones.
Customization in 4 Steps
- Step 1 - Open .key file takes one minute.
- Step 2 - Update dates and text takes four minutes.
- Step 3 - Adjust embedded chart data takes three minutes.
- Step 4 - Export as PDF takes one minute.
Total time stays under ten minutes.
Editing difficulty sits at moderate level.
You change colors without a designer.
It opens in Keynote 12 and later versions.
You adapt to your brand in minutes.
You use it in paid client work.
You get a refund if the file fails to open.
The Cost of Not Using a Template
Manual timeline creation takes two hours per slide.
Alignment errors appear when scaling Gantt bars manually.
Milestone icons drift without locked layers.
This layout places labels outside shapes for projection clarity.
Flow direction guides the eye chronologically without extra effort.
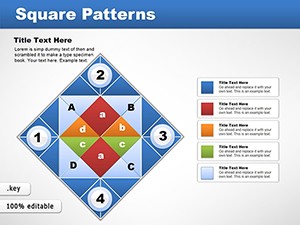
Visual hierarchy emerges from contrasting zone segmentation.
Many quarterly reviews rely on these exact layout composition choices.
Download the Business Timeline Keynote Template now and map your milestones.
Which Keynote versions does this work with?
Keynote 12 and newer versions open the .key file without issues. Older releases may lose some layer effects. Apple Silicon Macs run it fastest. Test the file immediately after download to confirm full compatibility.
How do I change the color scheme?
Select any shape or segment. Open the Format panel on the right. Choose Fill then pick your brand color. Repeat for all segments in one diagram. Keynote slide master updates propagate across all slides automatically.
What does the license allow?
You may use the template in paid client work. You cannot resell or sublicense the file itself. Internal company use stays unlimited. Attribution is never required.
What does the paid version include that the free version does not?
The paid version includes all twenty four slides and embedded charts. No free version limitations appear on page. You receive the full .key file ready for immediate editing. Every diagram connector and text placeholder stays editable.
What software do I need?
Apple Keynote on Mac or iPad opens the .key file. Windows users require Keynote for iCloud. No additional plugins appear necessary. Export to PDF works from any compatible device.
What is the refund policy?
You receive a full refund within thirty days if the file does not open in your Keynote version. Contact support with your order number. The policy covers download issues only. No questions are asked beyond verification.