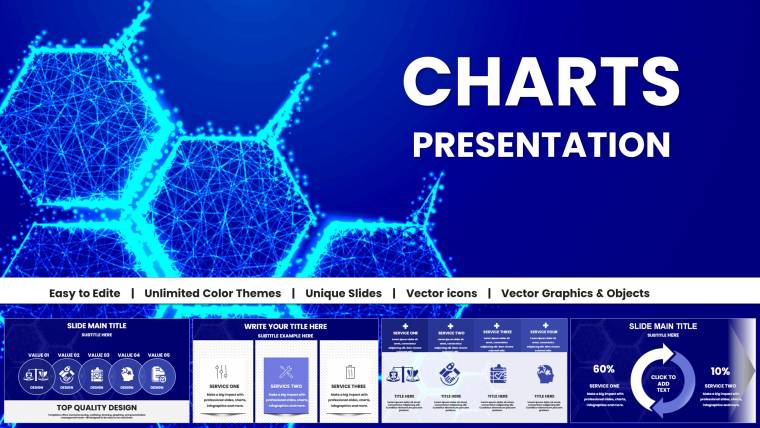
Medical Science Charts Template for Keynote Presentation


Type: Keynote Charts template
Category: Medicine - Pharma
Sources Available: .key
Product ID: KC01040
Template incl.: 42 editable slides
Step into the spotlight of a medical symposium, where your slides don`t just inform - they heal misunderstandings with crystal-clear visuals. Our Medical Science Charts Template for Keynote is meticulously crafted for the healthcare heroes: doctors dissecting case studies, researchers unveiling trial results, educators molding future medics, and innovators pitching health tech breakthroughs. Boasting 42 editable slides (thumbnails suggest 0-41), this template marries scientific precision with aesthetic appeal, drawing from AMA presentation guidelines to foster trust and engagement. Imagine a hospital executive using these tools to present patient outcomes, turning stats into stories that sway boards. Developed with insights from medical illustrators, it`s more than slides - it`s a diagnostic tool for communication woes, as echoed by a Johns Hopkins affiliate who cut revision cycles dramatically.
Why This Template Empowers Medical Communicators
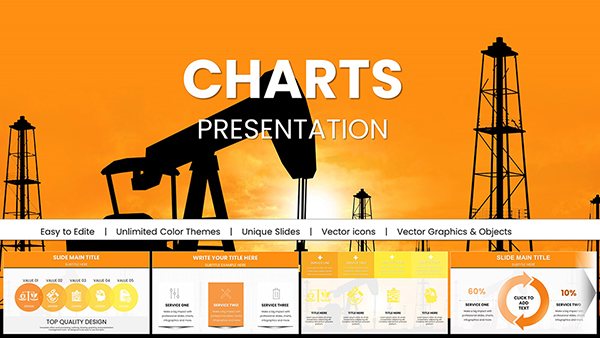
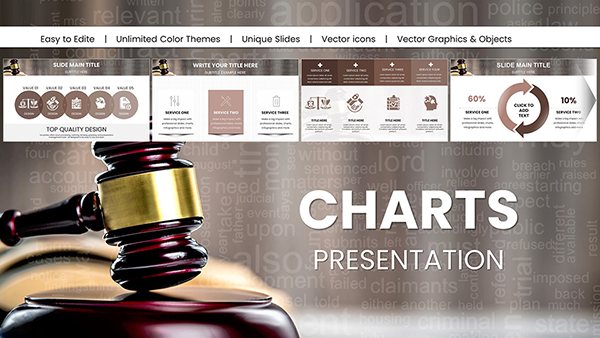
In medical science, where lives hinge on accurate data relay, visuals must be impeccable. This template`s professional schemes - subdued blues and whites evoking sterility and calm - align with health psychology principles to build credibility. Kick off with title slides featuring anatomical motifs, setting a tone of expertise for topics like epidemiology trends.
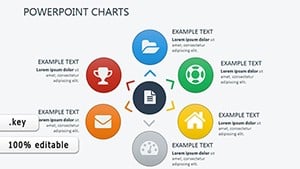
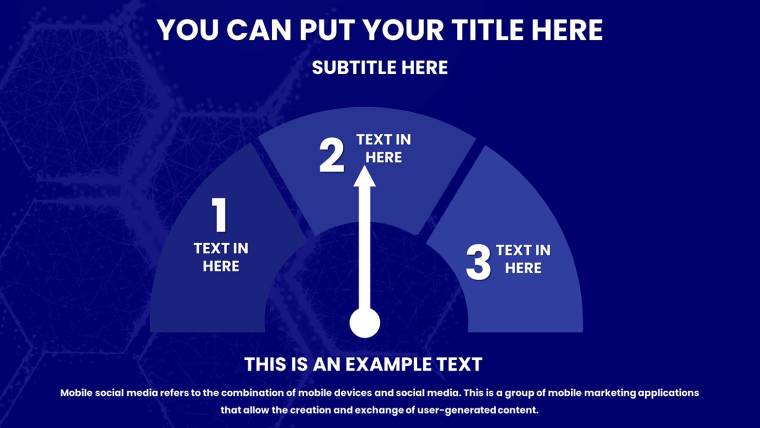
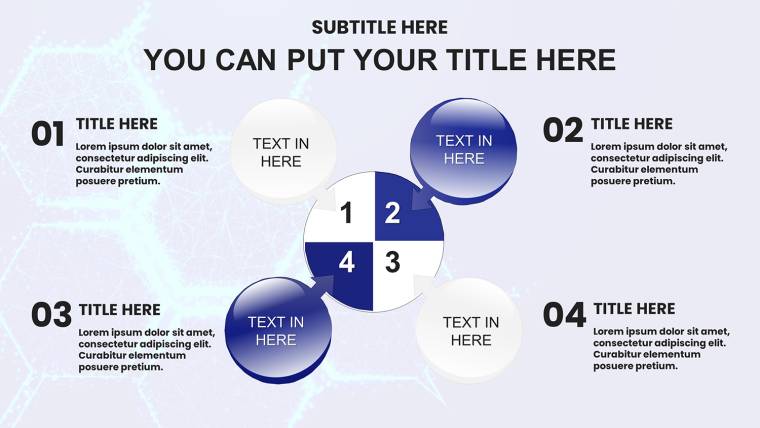
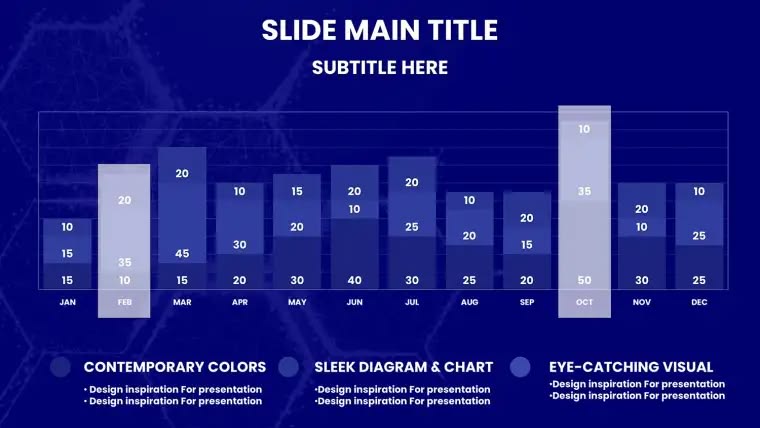
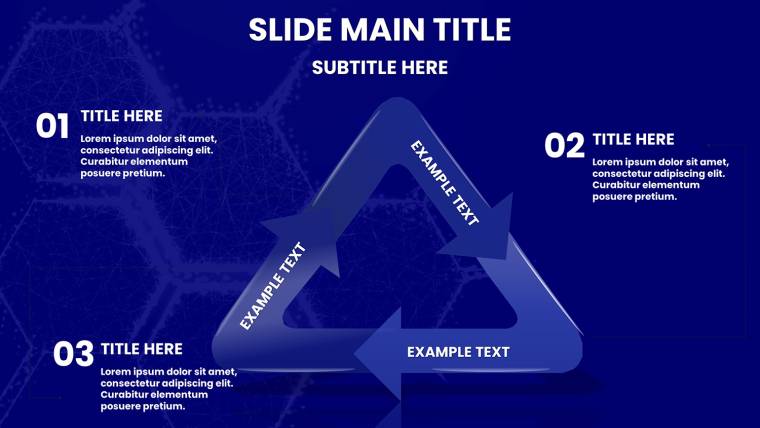
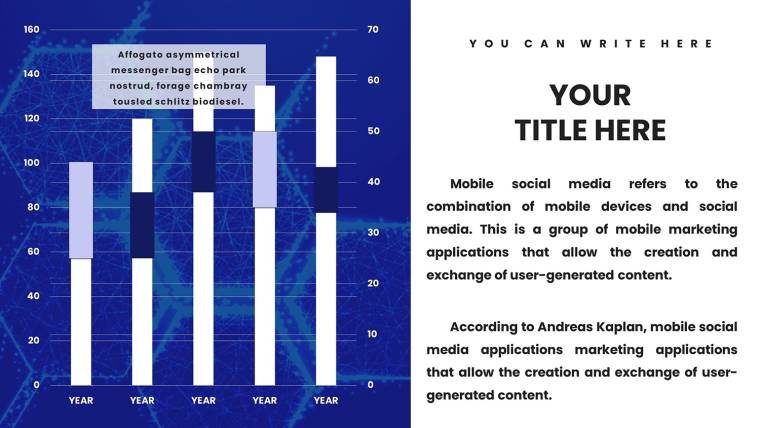
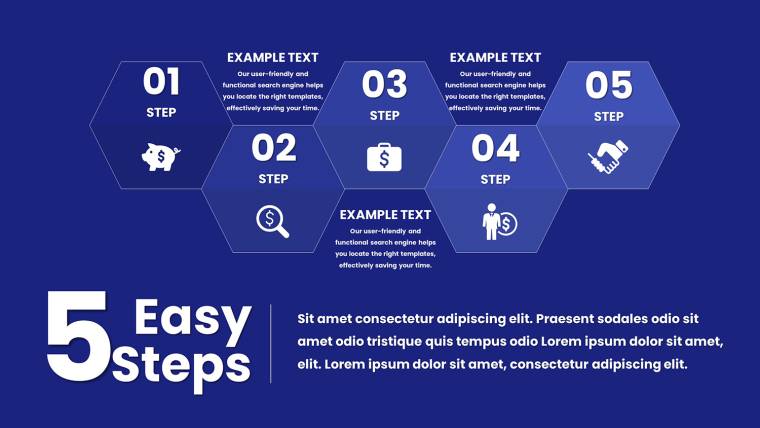
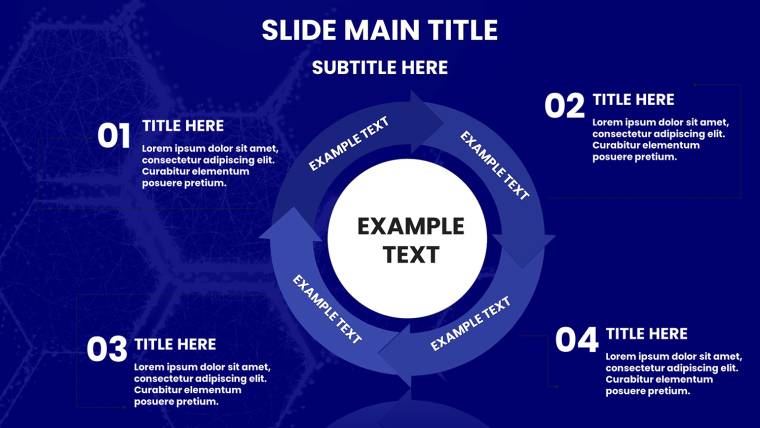
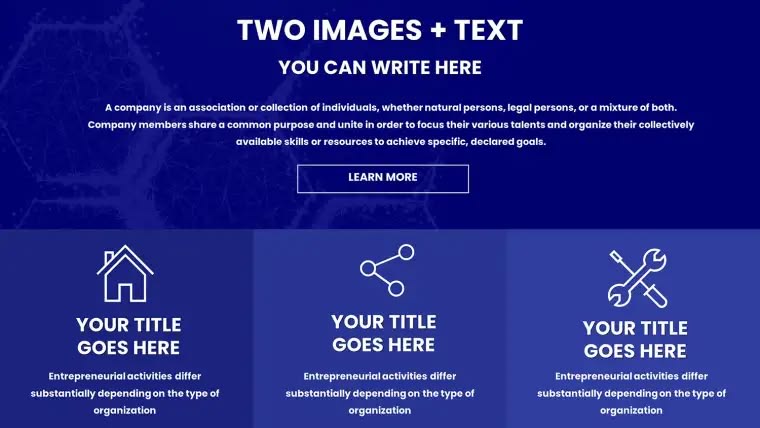
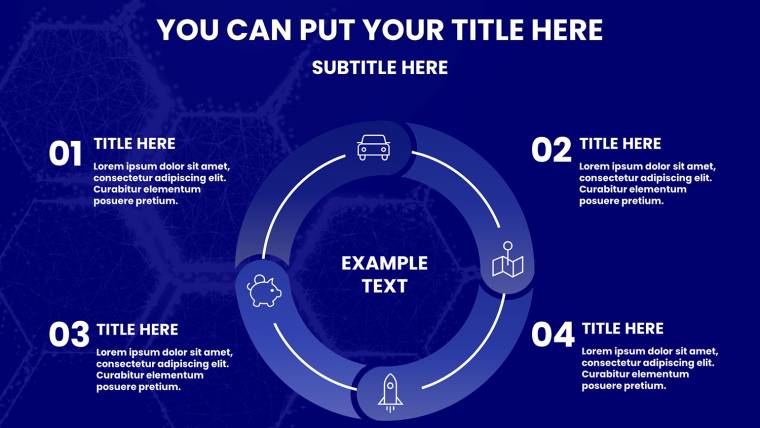
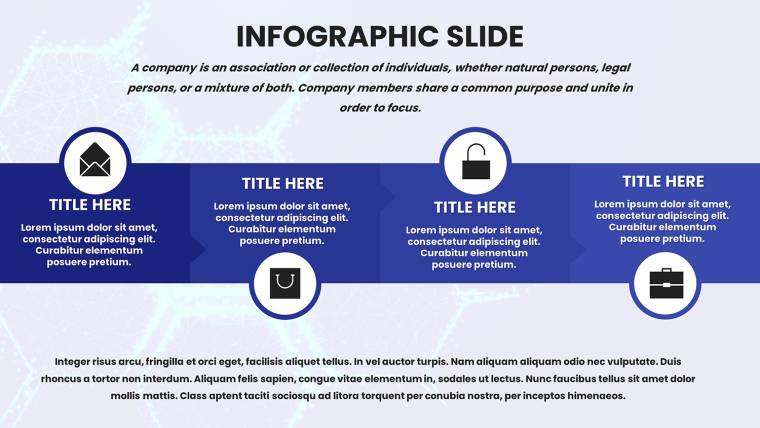
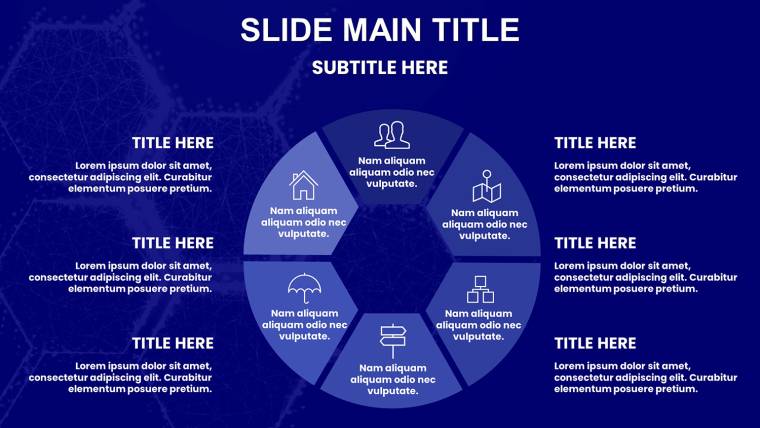
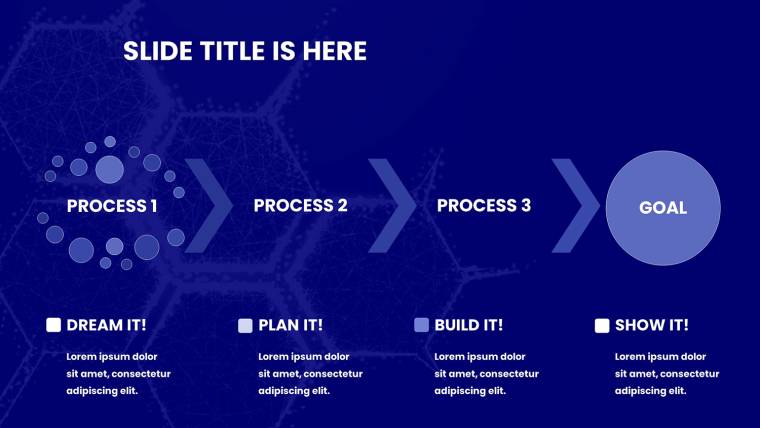
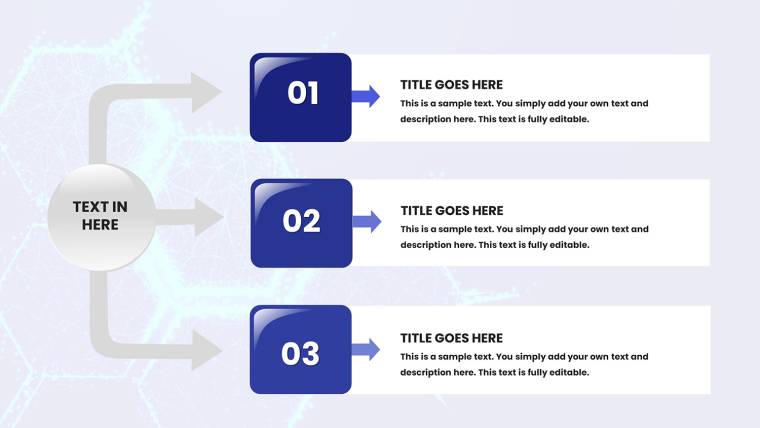
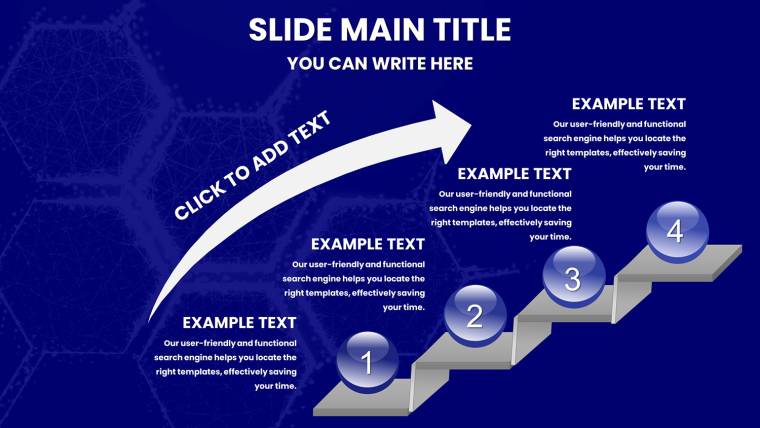
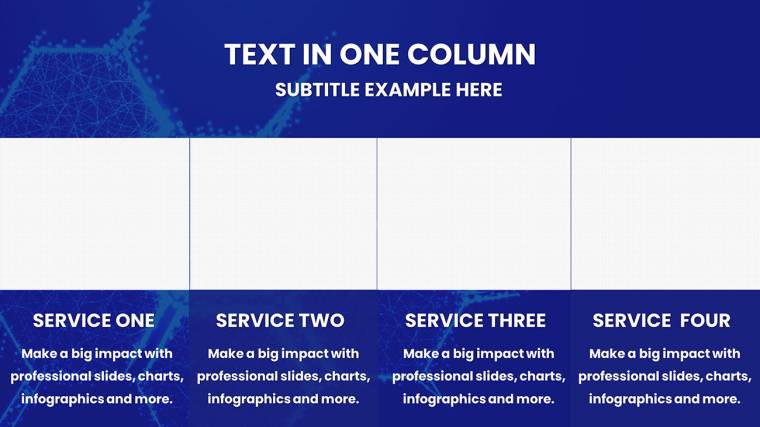
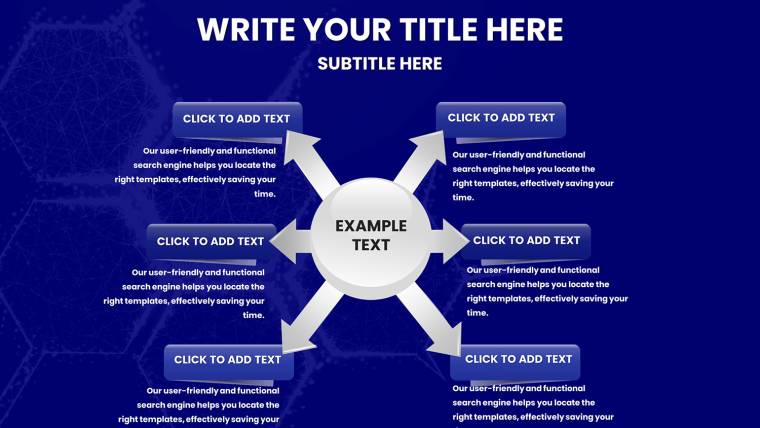
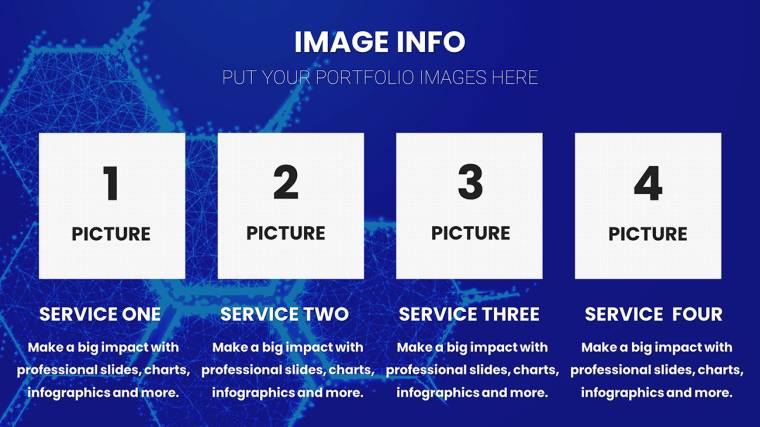
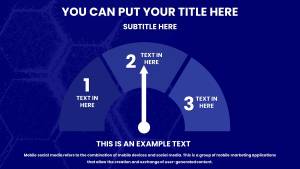
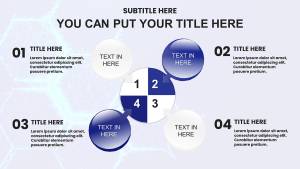
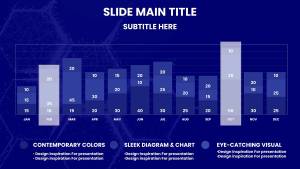
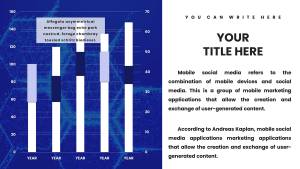
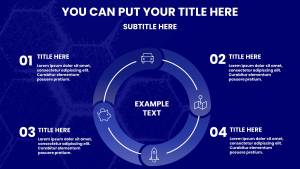
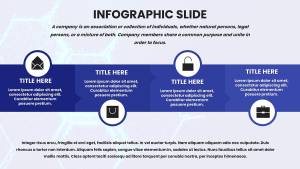
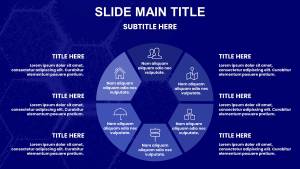
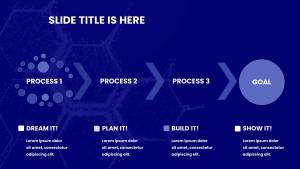
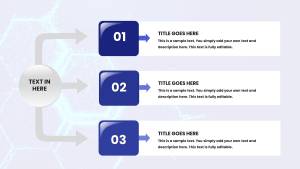
Core content shines in customizable infographics: Bar graphs for prevalence rates, timelines for treatment protocols. Each is drag-resizable, vector-sharp for retina displays. For clinical procedures, step-through diagrams illustrate sequences like surgical workflows, enhancing training sessions.
Standout Features for Healthcare Excellence
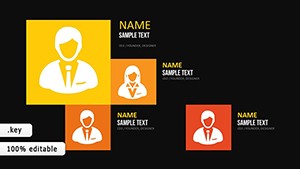
- Anatomical Illustrations: Precision-drawn by pros, editable for specifics like organ systems or cellular views.
- Data Charts Galore: Pies for demographic breakdowns, lines for vital sign tracking - all with HIPAA-minded placeholders.
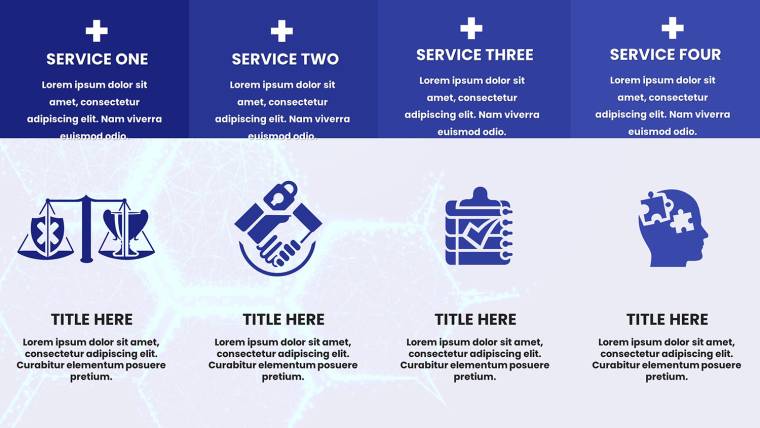
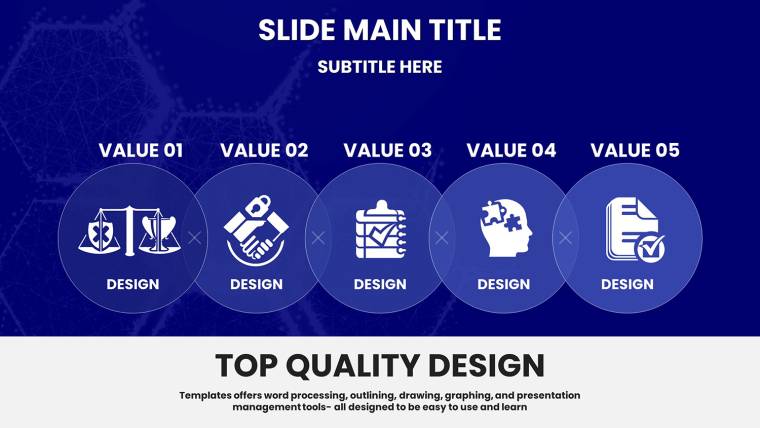
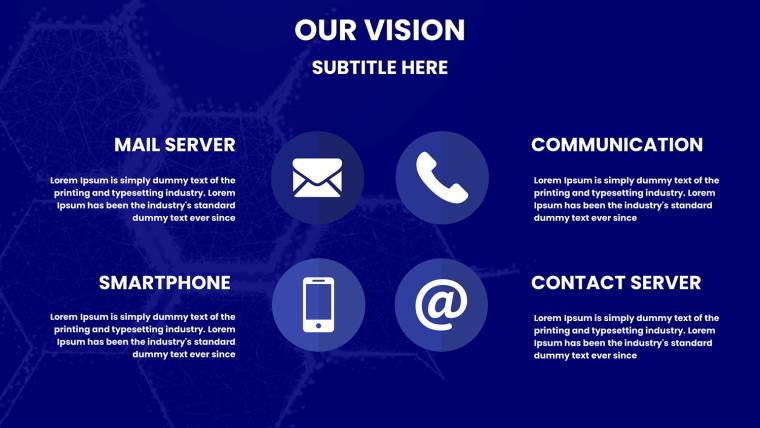
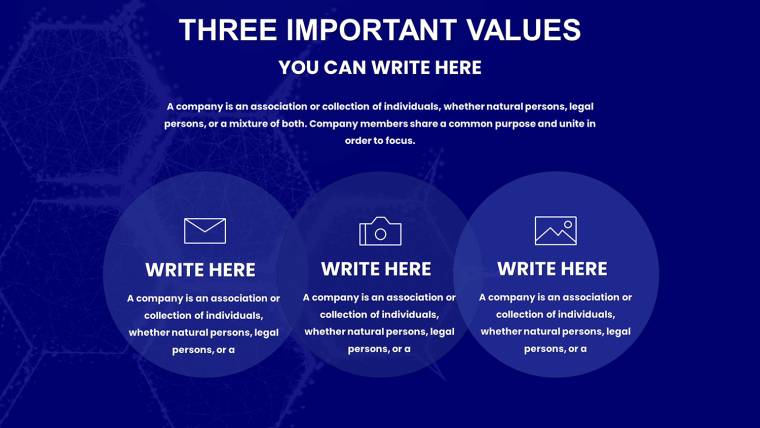
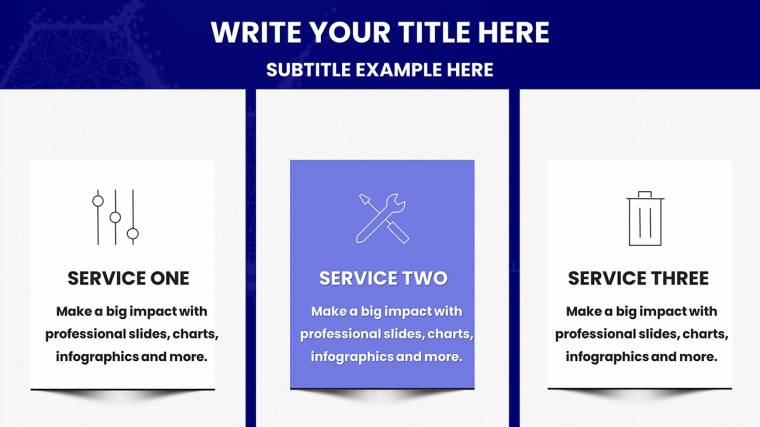
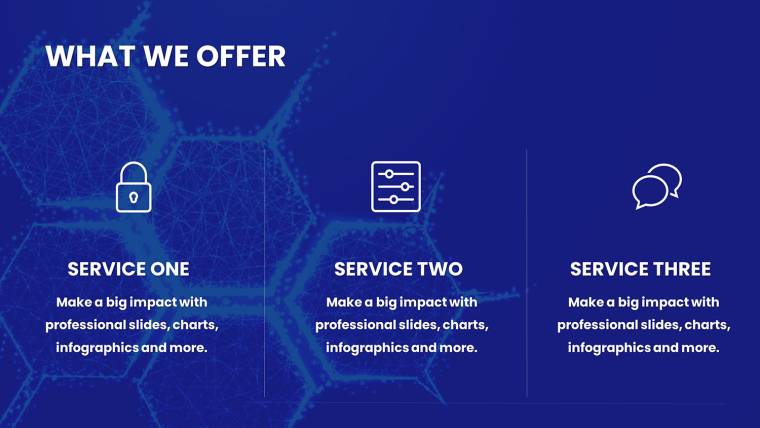
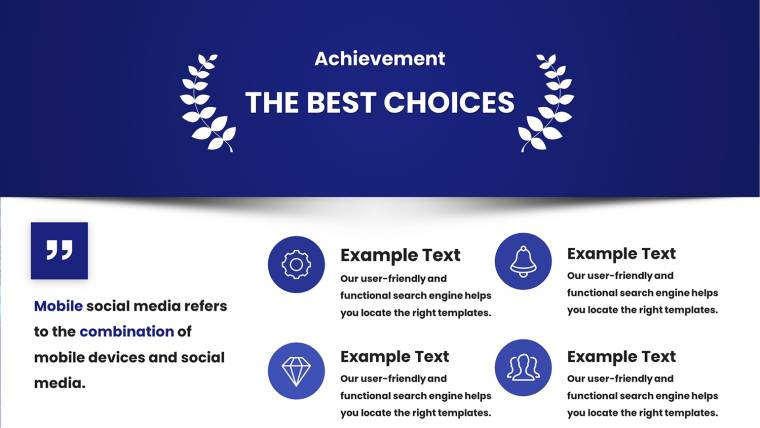
- Infographic Versatility: Visualize outcomes or risks with icons from stethoscopes to DNA helices.
- Device Compatibility: Flawless on macOS/iOS Keynote, with quick loads for rounds or telehealth.
- Branding Ease: Swap palettes to match clinic logos, maintaining consistency in patient ed materials.
These elements draw from real successes, like how Pfizer leveraged visual aids in vaccine rollouts for public buy-in. Our template amplifies this with exclusive medical motifs, underscoring your authoritative voice.
Diverse Applications in Medical and Health Tech
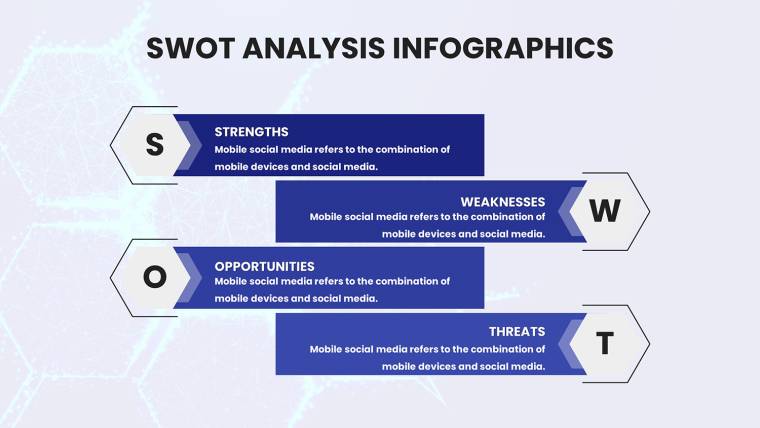
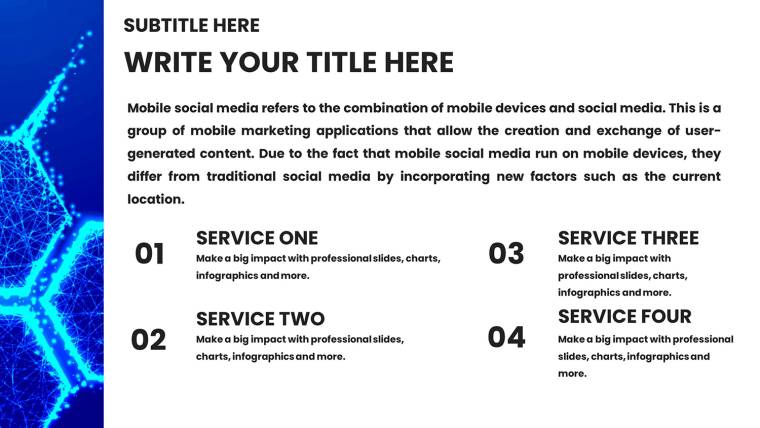
Apply it vividly: For conferences, craft comparison tables pitting therapies side-by-side, highlighting efficacy with color-coded metrics. In lectures, use pie charts to demystify disease etiologies, fostering student aha moments per active learning theories.
Product launches benefit from timeline slides mapping development phases, convincing investors with milestone visuals. Patient education? Simplify with infographics on regimens, improving adherence rates.
- Compile Your Insights: Aggregate data from EMRs or studies, ready for import.
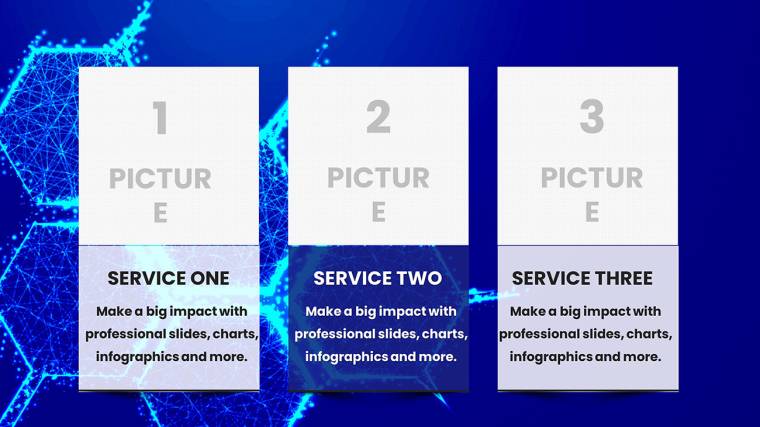
- Tailor Content: Insert images via placeholders, ensuring compliance with privacy norms.
- Enhance with Effects: Animate reveals for dramatic emphasis on key findings.
- Review for Accuracy: Share prototypes for peer validation, iterating swiftly.
- Present with Poise: Rely on polished designs to field questions adeptly.
This integrates into workflows like agile health tech dev, yielding efficiency. Versus vanilla Keynote, it offers depth in medical-specific graphics, sidestepping irrelevant fluff.
Unmatched Benefits for Medical Pros
Its edge? Expert curation for niche needs, lauded for time savings in high-stakes environments. Trustworthy edits ensure data sovereignty, with exports suiting journals or apps. Naturally incorporate LSI like "clinical outcome visualizations" for broader reach.
Multilingual support aids international symposia, while subtle CTAs like "Learn More on Slide" guide without pushiness.
Pro Tips for Impactful Medical Storytelling
Elevate further: Adhere to 5/5/5 rule (5 lines, words, slides) for brevity in time-crunched settings. Weave narratives - frame data as patient journeys using timelines. For hybrids, test audio sync on videos embedded in slides.
Steer clear of jargon overload; our clean layouts promote accessibility. Inspire from cases like Mayo Clinic`s use of charts in telemedicine, enhancing remote care. This template turns presentations into pivotal moments, advancing medical discourse.
Prepared to heal your presentation pains? Secure this medical charts template and deliver diagnoses of excellence.
Frequently Asked Questions
How customizable are the anatomical graphics?
Fully - resize, recolor, or layer them to fit your narrative, all within Keynote`s intuitive tools.
Does it work on iOS Keynote?
Yes, optimized for seamless mobile editing and presenting.
Can it handle sensitive medical data?
Absolutely, with secure placeholders; always follow HIPAA when sharing.
What if I need to add video elements?
Easy integration - embed clips for procedural demos.
Are there resources for beginners?
Included quick-start guides, plus Keynote tutorials for med-specific tips.
Supports group work?
Yes, through collaborative editing in iCloud for team-based projects.