Spleen and Blood Cell Keynote Charts for Medicine


Type: Keynote Charts template
Category: Medicine - Pharma
Sources Available: .key
Product ID: KC00962
Template incl.: 59 editable slides
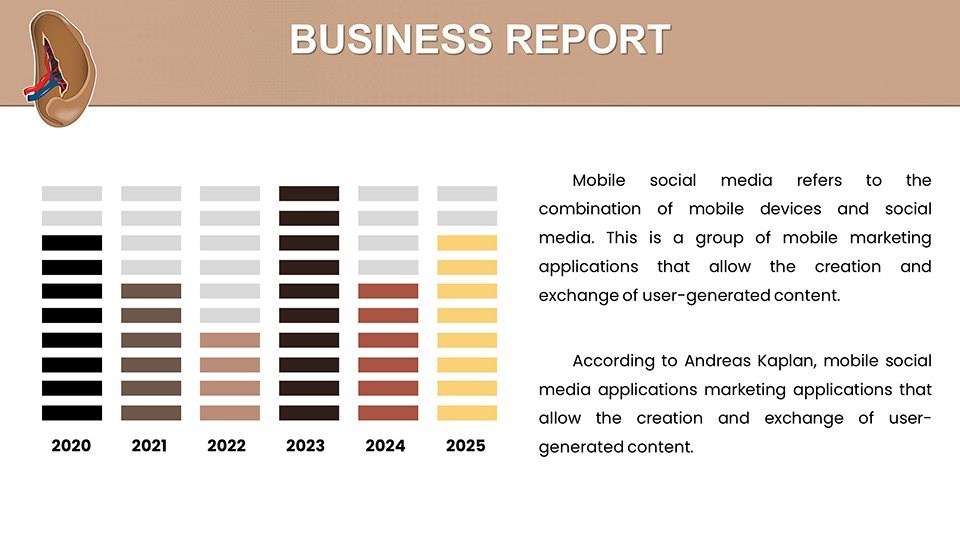
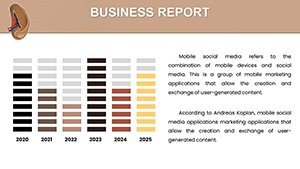
The spleen and blood cells play pivotal roles in immunity and hematopoiesis, and illustrating their complexities demands sophisticated visuals. Our Spleen and Blood Cell Keynote Charts Template offers 59 editable slides that decode these paradigms, ideal for medical practitioners, educators, and researchers. Aligned with guidelines from the American Society of Hematology (ASH), it facilitates memorable presentations on topics like splenic functions or erythrocyte maturation, blending artistry with scientific rigor.
This tool redefines medical discourse, making intricate concepts accessible through graphical aids. Keynote compatibility ensures fluid edits, positioning you to elevate patient instructions or academic orations with confidence.
The Core of Visual Facilitation in Medical Arenas
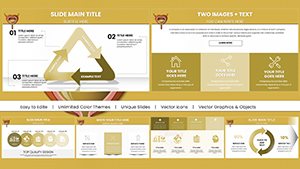
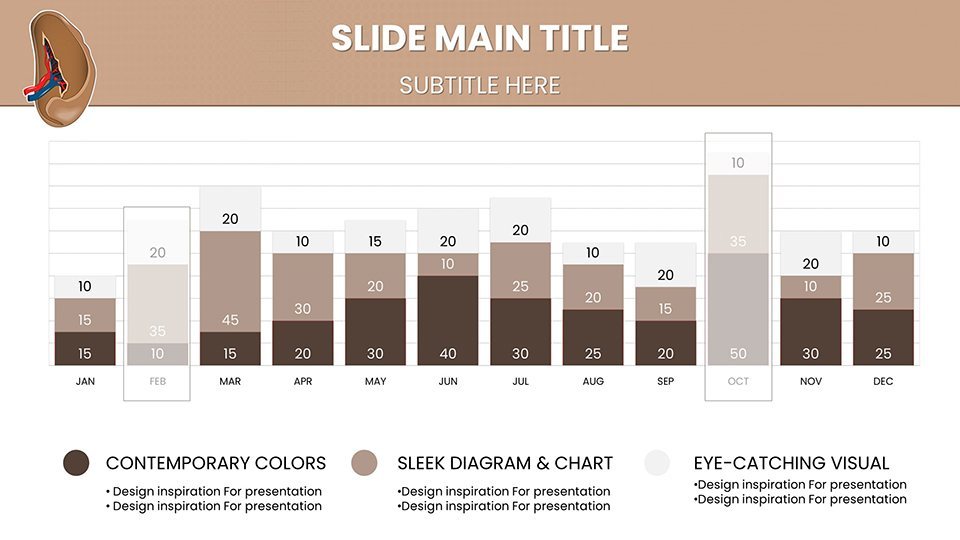
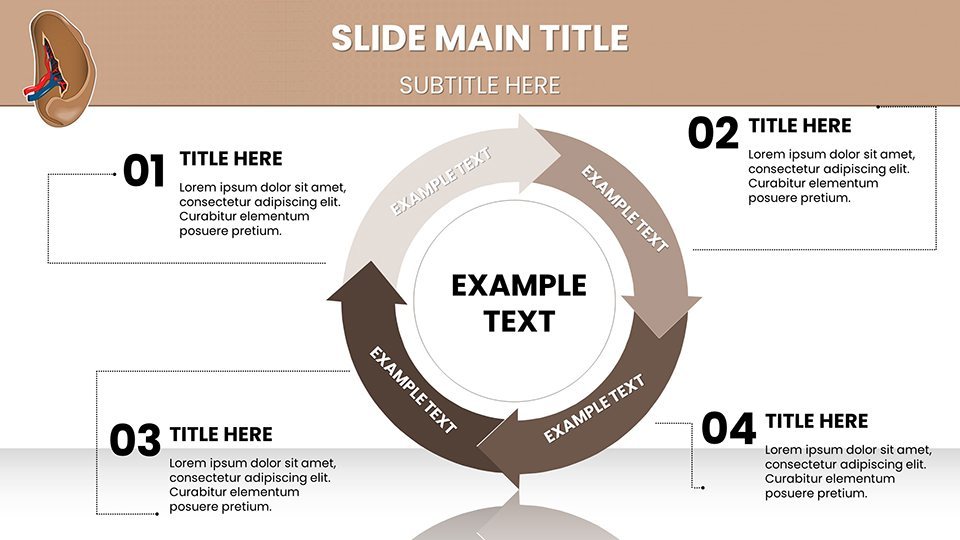
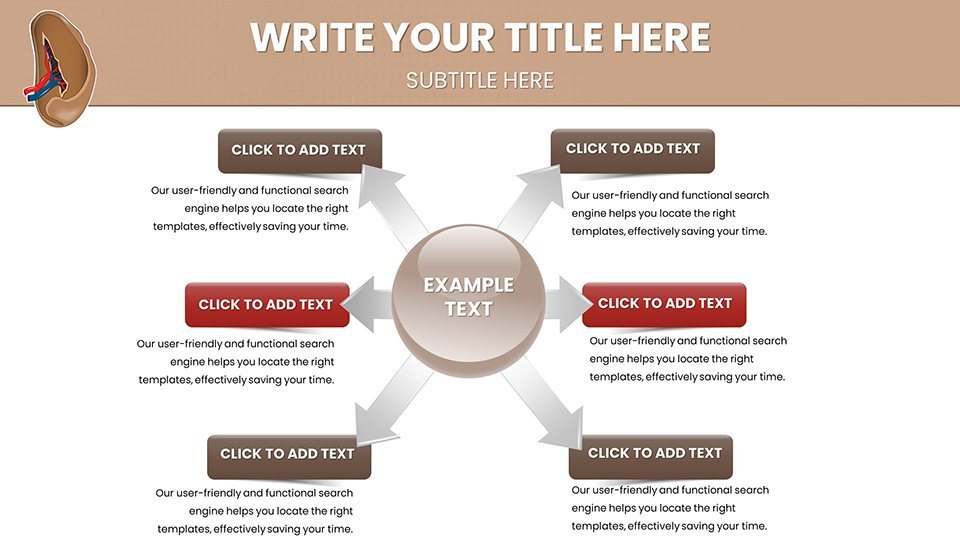
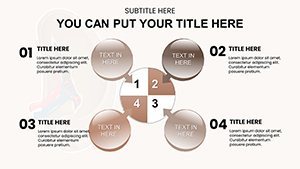
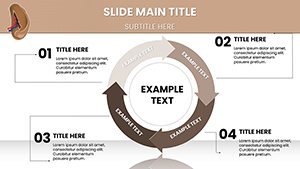
At its core, the template provides visual facilitation with diagrams transcending conventional depictions - think detailed spleen morphology illustrations or hematopoietic flowcharts. Effortless customization allows hue alterations for enriched palettes, reducing confusion in complex topics like lymph filtration.
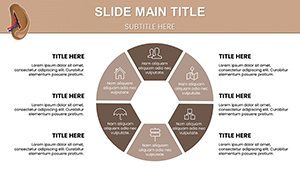
Diagram diversity includes Venn diagrams for cell interactions and tree maps for lineage hierarchies, all crafted by seasoned illustrators. This synergy of art and pedagogy amplifies discourse, with ripple effects in comprehension and retention.
Decoding the Spleen and Navigating Hematopoiesis
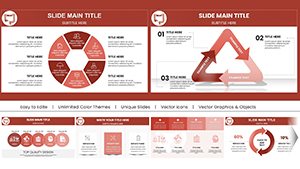
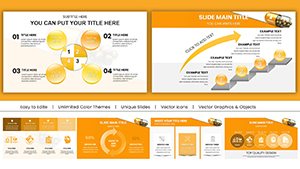
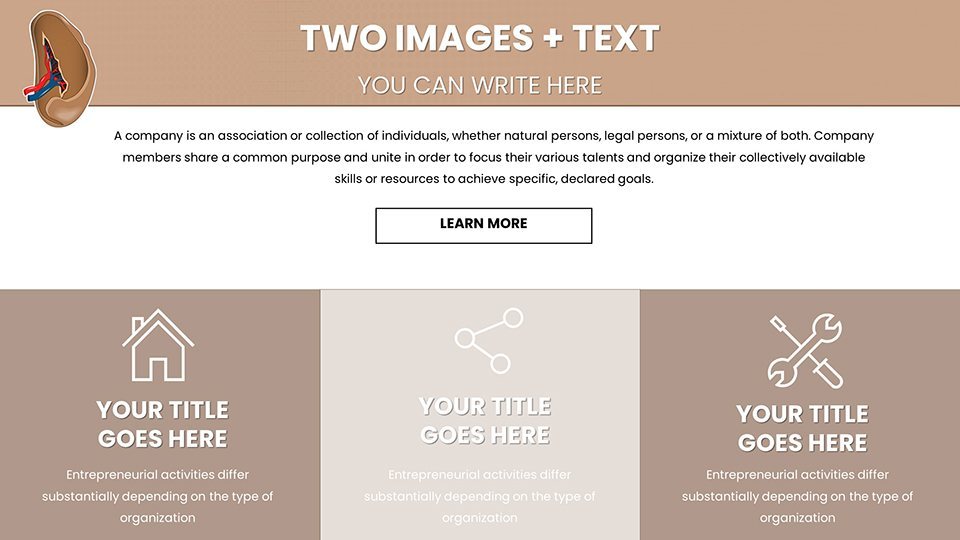
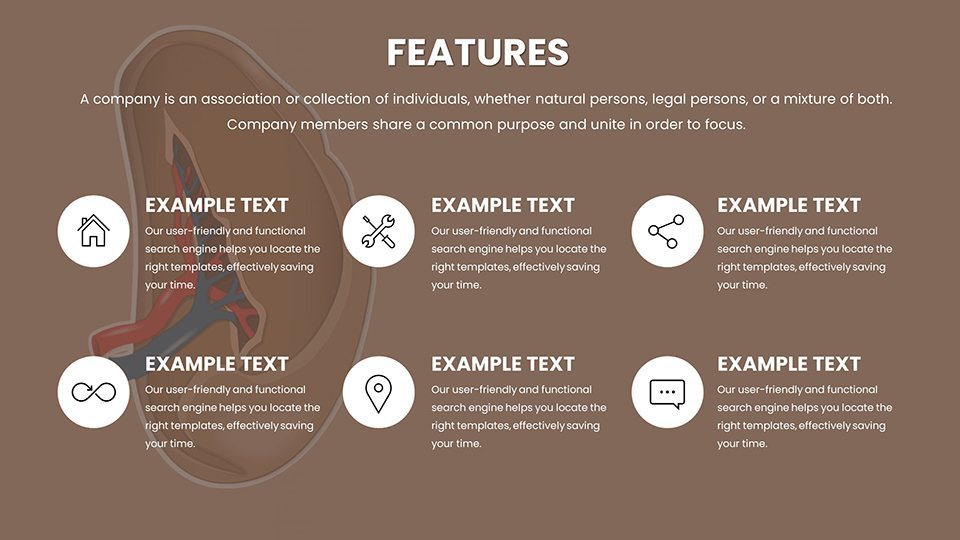
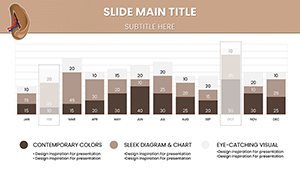
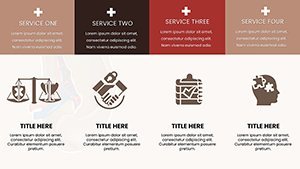
Standout features include chromatic comprehension for color-coded cells - red for erythrocytes, white for leukocytes - enhancing clarity. Tailor designs to append notes or fine-tune for audience needs, like simplifying for patients or detailing for symposia.
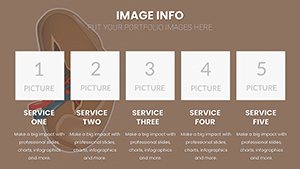
- Core Visuals: Graphical aids for accessibility.
- Spleen Focus: Beyond basic graphs.
- Hematopoiesis Navigation: Complex made simple.
- Customization: Effortless and excellent.
- Palette Artistry: Enriched for understanding.
- Synergy Nexus: Medical and pedagogical blend.
- Diversity: Versatile utility.
- Craftsmanship: Ingenious and precise.
- Elevation: Visual augmentation effects.
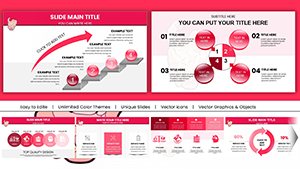
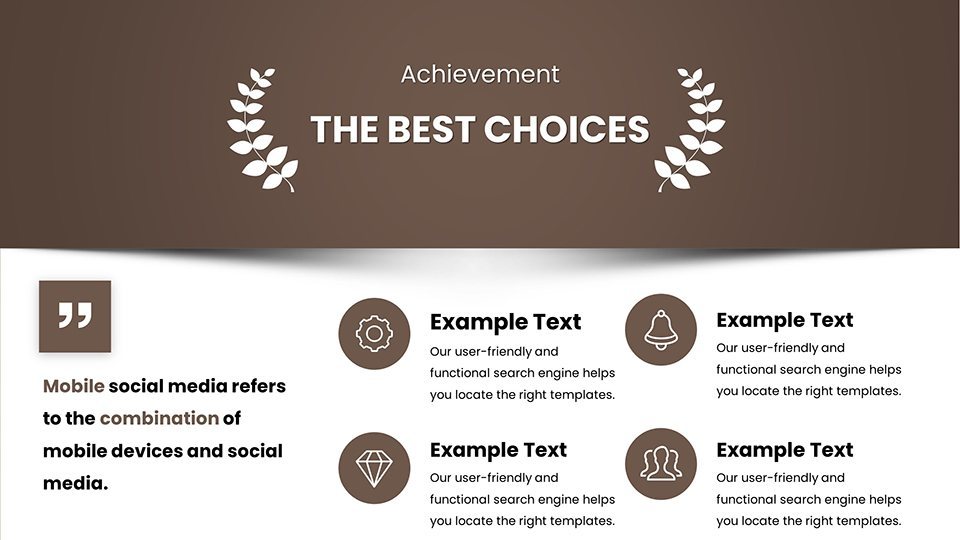
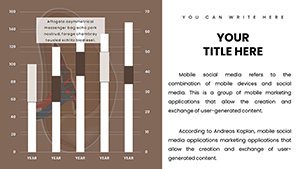
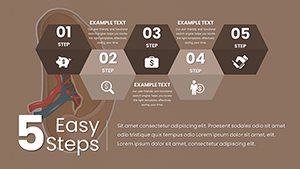
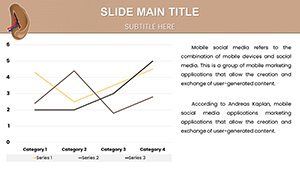
In applications, use for classroom orations with timelines of blood cell development, or patient instruction with simplified cycles. Compared to standard templates, ours offers unshackled utility with layered edits.
Who Benefits from Spleen and Blood Cell Diagrams?
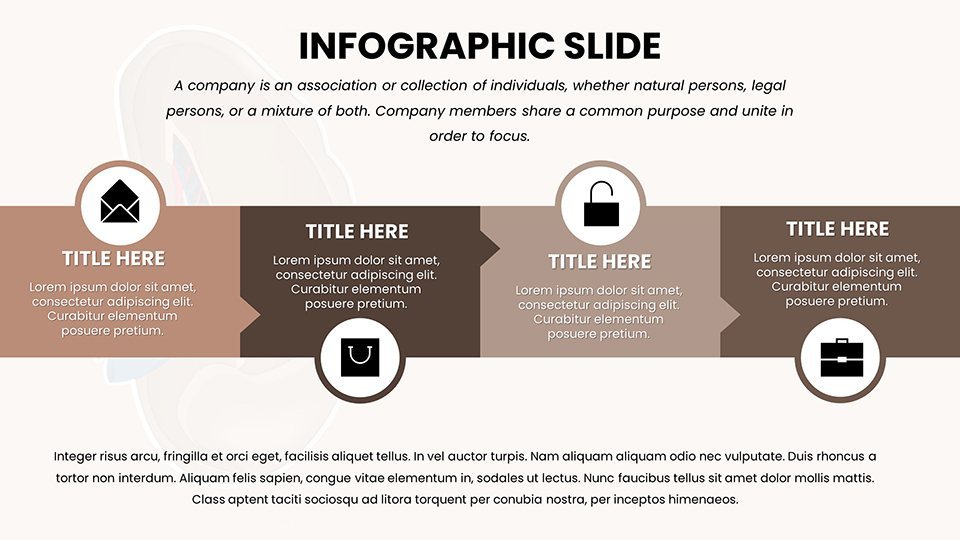
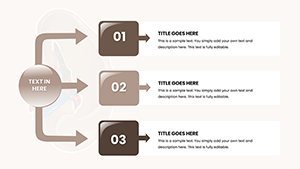
Educators forge engaging lessons, researchers present at conferences with precision charts, and clinicians instruct patients using visual narratives. Workflow: Begin with overviews, delve into specifics like pie charts on cell types, end with impacts. Tips: Integrate animations for cell movements, ensure accuracy with references, and leverage for virtual settings.
Users report heightened engagement, as visuals make narratives compelling. Address inquiries and clarify with this template - purchase today to transform your medical presentations.
Frequently Asked Questions
- How do these diagrams amplify medical narratives?
- By making complex info visual and memorable.
- Customization options available?
- Full - colors, designs, annotations.
- Utility in classroom discourse?
- High, for interactive teaching.
- Who created the diagrams?
- Seasoned medical illustrators and educators.
- How to integrate into presentations?
- Seamlessly import and edit in Keynote.