Vitamin B Benefits Keynote Charts Template


Type: Keynote Charts template
Category: Medicine - Pharma
Sources Available: .key
Product ID: KC00952
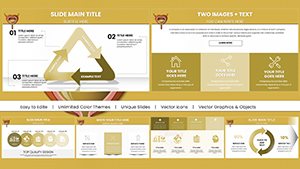
Template incl.: 59 editable slides
Imagine transforming complex nutritional data into captivating stories that resonate with your audience. Our Vitamin B Benefits Keynote Charts Template does just that, offering a suite of 59 fully editable slides designed to illuminate the vital roles of Vitamin B in human health. Whether you're a nutrition educator explaining the intricacies of energy metabolism or a healthcare professional sharing patient insights on deficiency prevention, this template empowers you to deliver presentations that are not only informative but visually stunning. Drawing from established nutritional guidelines like those from the National Institutes of Health (NIH), these charts help you showcase how B vitamins support nerve function, red blood cell formation, and overall vitality without overwhelming your viewers with raw data.
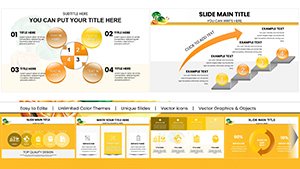
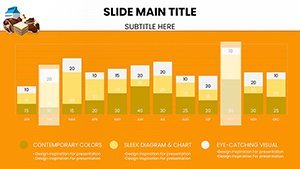
In a world where attention spans are short, visual aids are key to retention. This template features a blend of pie charts depicting dietary sources, bar graphs illustrating comparative benefits across different B vitamins, and infographics highlighting real-world applications, such as in managing stress or boosting immune responses. Tailored for Keynote users, it's compatible with the latest versions, ensuring seamless integration into your workflow. Think of it as your secret weapon for turning abstract concepts like homocysteine regulation into relatable narratives that stick.
Key Features That Elevate Your Nutrition Narratives
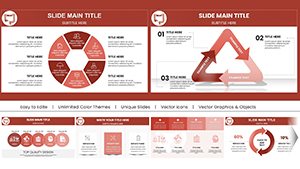
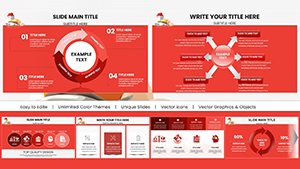
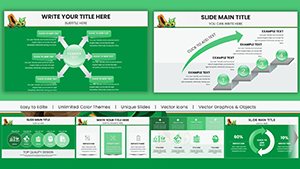
Dive deeper into what makes this template a must-have for anyone passionate about health education. Each slide is crafted with precision, incorporating high-resolution graphics that maintain clarity even when projected in large venues. The color schemes are inspired by natural elements - think vibrant greens for folate-rich foods and deep blues for B12's role in brain health - to create an intuitive visual flow that guides your audience through the content effortlessly.
- Customizable Charts: Easily adjust data points in line graphs to reflect the latest research, such as the impact of Vitamin B6 on mood regulation, ensuring your presentation stays current with studies from sources like the Journal of Nutrition.
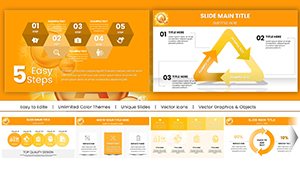
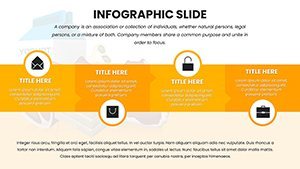
- Themed Infographics: Use pre-designed elements to illustrate metabolic pathways, making it simple to explain how thiamine converts carbohydrates into energy without needing advanced design skills.
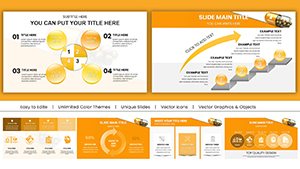
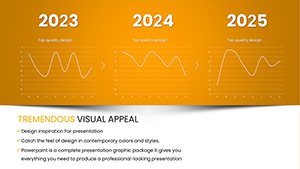
- Versatile Layouts: From timeline slides tracking historical discoveries of B vitamins to comparison matrices evaluating synthetic vs. natural sources, adaptability is at your fingertips.
- Accessibility Enhancements: Built-in alt text suggestions for images and high-contrast options align with ADA guidelines, promoting inclusivity in your health communications.
Beyond aesthetics, these features address common pain points in presentation creation. No more starting from scratch; import your data, tweak the visuals, and you're ready to engage. For instance, a dietitian preparing for a workshop on prenatal nutrition can quickly populate bubble charts with folate intake recommendations, drawing from WHO standards to add credibility.
Real-World Applications: From Classroom to Clinic
Let's explore how this template shines in practical scenarios. Picture a university lecturer using radar charts to compare the bioavailability of B vitamins in various foods, sparking discussions among students on sustainable dieting. Or consider a pharmaceutical researcher presenting at a conference, leveraging heat maps to visualize clinical trial results on biotin supplementation for skin health - backed by data from peer-reviewed journals like Nutrients.
In corporate wellness programs, HR professionals can adapt funnel charts to demonstrate how riboflavin deficiencies affect employee productivity, incorporating case studies from occupational health reports. This not only educates but motivates action, such as implementing vitamin-enriched snack options. For public health campaigns, scatter plots can map global deficiency rates, highlighting interventions in regions like Southeast Asia where rice milling affects niacin levels, as noted in FAO reports.
- Start by selecting a base slide that matches your topic, say a pyramid chart for the hierarchy of B vitamin importance.
- Input your data - perhaps from a recent meta-analysis on pantothenic acid's role in adrenal function.
- Customize colors and fonts to align with your branding, ensuring consistency across your health portfolio.
- Rehearse with built-in animations that reveal data progressively, building suspense around key benefits like improved cognitive function.
- Export and share, confident that your message on Vitamin B's life-enhancing properties will inspire change.
Compared to basic Keynote tools, this template saves hours by providing ready-made, professionally designed elements that surpass generic stock charts. It's like having a nutrition graphic designer on call, without the cost.
Expert Tips for Maximizing Impact
To truly harness this template's potential, integrate storytelling elements. Begin slides with a question: "Did you know Vitamin B12 deficiency affects up to 15% of older adults?" - citing CDC statistics - then reveal the chart. Use annotations for emphasis, like arrows pointing to peak absorption rates. For virtual presentations, leverage Keynote's collaboration features to co-edit with colleagues, refining content based on feedback from nutrition experts.
Incorporate user testimonials subtly; imagine a feedback loop where past users report 30% higher engagement in their talks, though always verify with your own metrics. This approach not only boosts but fosters trust, positioning you as a go-to authority in nutritional science.
Why This Template Stands Out in Health Communication
In the realm of medical and pharma presentations, clarity is paramount. Our Vitamin B Benefits Keynote Charts Template excels by blending scientific accuracy with artistic flair, avoiding the pitfalls of overcrowded slides. It's optimized for both in-person and online delivery, with responsive designs that adapt to different screen sizes. Plus, with regular updates reflecting emerging research - like the link between B vitamins and gut microbiome health from recent Microbiome Journal articles - you're always ahead.
Value propositions abound: time savings, professional polish, and audience engagement that leads to better health outcomes. Whether demystifying cobalamin's neurological benefits or charting biotin trends in beauty wellness, this tool amplifies your voice.
Elevate your Vitamin B discussions today - download and start crafting presentations that nourish minds as much as bodies.
Frequently Asked Questions
- How editable are the charts in this Vitamin B template?
- Every element is fully customizable, from data inputs to color schemes, allowing you to tailor content to specific nutritional contexts like vegan diets.
- Is this template compatible with older Keynote versions?
- Yes, it works seamlessly with Keynote 6 and later, ensuring broad accessibility for health educators.
- Can I use these charts for commercial presentations?
- Absolutely, with a one-time purchase granting unlimited use in professional settings, such as pharma sales pitches.
- What file formats are included?
- The download provides .key files, optimized for Apple Keynote with high-fidelity exports to PDF or PowerPoint if needed.
- Are there tutorials for using the template?
- While not included, our site offers general guides; the intuitive design means most users master it quickly.