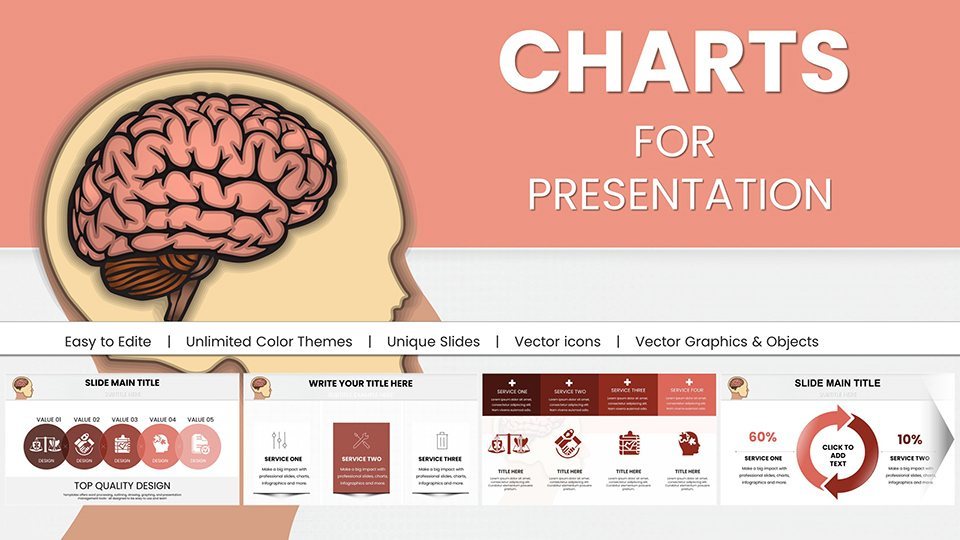
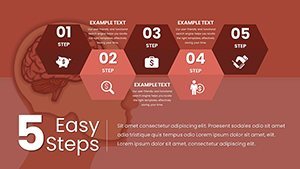
Brain Five Senses Keynote Charts Template


Type: Keynote Charts template
Category: Medicine - Pharma
Sources Available: .key
Product ID: KC00948
Template incl.: 59 editable slides
Unlock the mysteries of human perception with our Brain Five Senses Keynote Charts Template, a dynamic collection of 59 editable slides that bring sensory neuroscience to life. Perfect for psychologists, educators, or corporate trainers exploring how sight, sound, touch, taste, and smell shape our world, this template turns intricate brain functions into accessible visuals. Inspired by foundational works like those from the American Psychological Association (APA), it helps you illustrate synaptic pathways and sensory integration without drowning in technical jargon, making your talks both enlightening and entertaining.
Ever wondered how to make a lecture on olfactory processing pop? This template's got you covered with interactive diagrams that evolve as you present, fostering deeper understanding. Compatible with Keynote's collaborative tools, it's a breeze to refine with team input, ensuring your message on multisensory experiences resonates across audiences.
Standout Features for Sensory Storytelling
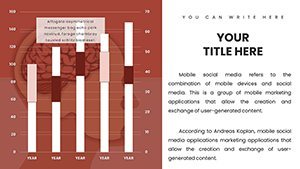
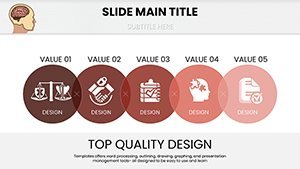
At the heart of this template are features engineered for clarity and creativity. High-definition illustrations of brain regions like the thalamus and cortex provide a canvas for your data, with color-coded schemes that differentiate senses - vibrant reds for vision, soothing blues for audition - to enhance cognitive mapping.
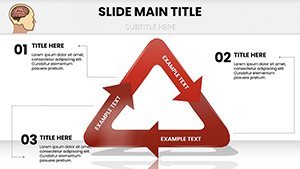
- Interactive Diagrams: Drag-and-drop elements to simulate sensory pathways, ideal for demonstrating cross-modal effects as seen in studies from Nature Neuroscience.
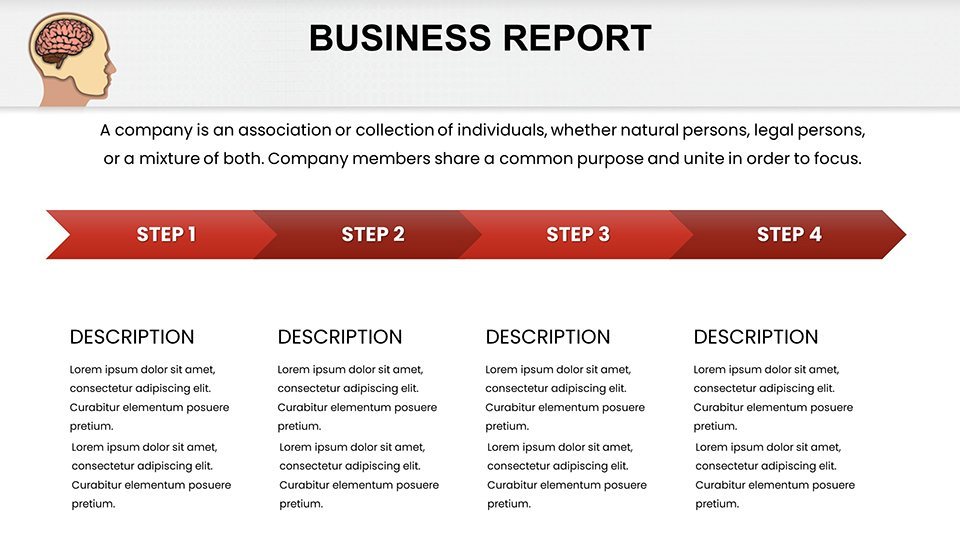
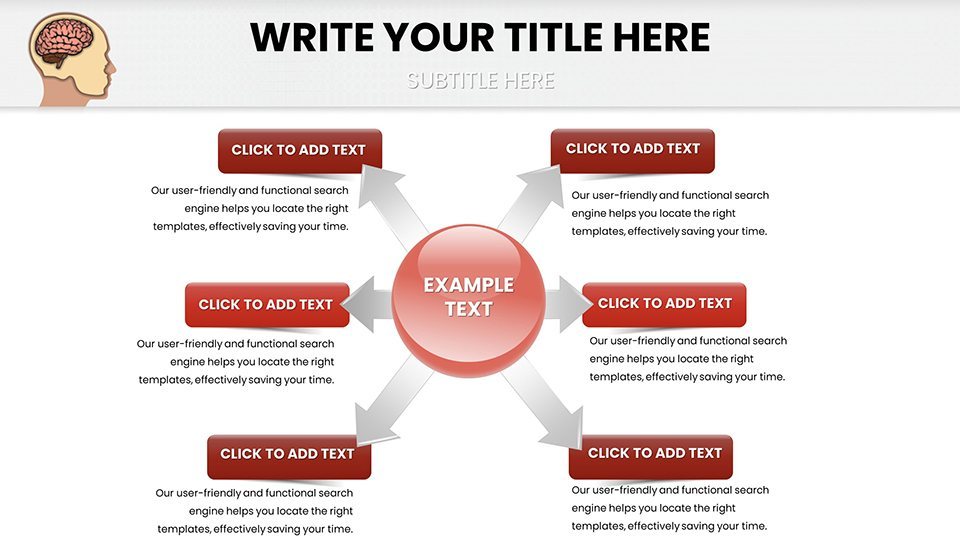
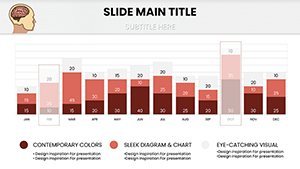
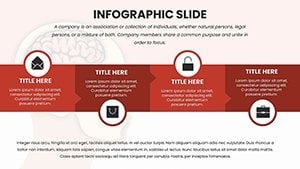
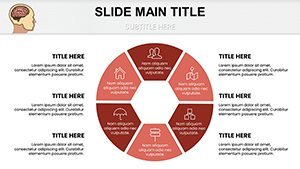
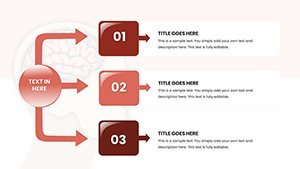
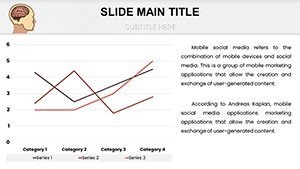
- Diverse Chart Types: From Venn diagrams overlapping sensory inputs to flowcharts tracing neural signals, variety keeps your narrative fresh.
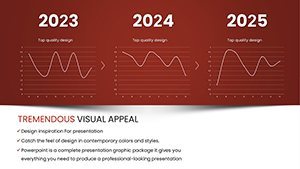
- Animation Ready: Built-in transitions reveal layers, like peeling back the brain's response to tactile stimuli, aligning with UX best practices.
- Branding Flexibility: Swap palettes to match institutional colors, incorporating logos seamlessly for professional polish.
These tools tackle common hurdles, like visualizing abstract concepts such as synesthesia, by providing pre-built models you can populate with data from sources like the Sensory Processing Disorder Foundation.
Practical Use Cases: Engaging Minds Across Fields
Envision a school teacher using radial charts to map taste bud distributions, sparking student curiosity about flavor profiles. Or a marketing expert at a conference employing heat maps to show how scents influence consumer behavior, backed by insights from the Journal of Consumer Research.
In therapy sessions, occupational therapists can adapt tree diagrams to outline sensory integration therapies, drawing from evidence-based practices in the American Journal of Occupational Therapy. For tech innovators, Gantt charts track development timelines for VR sensory simulations, highlighting milestones in haptic feedback advancements.
- Choose a sensory-focused slide, such as a bubble chart for auditory frequencies.
- Integrate your research data, perhaps on proprioception from recent kinesiology studies.
- Refine visuals with Keynote's shape tools, adding annotations for key brain areas.
- Test animations to ensure smooth reveals of complex interactions like audiovisual integration.
- Present confidently, knowing your slides support claims with visual evidence.
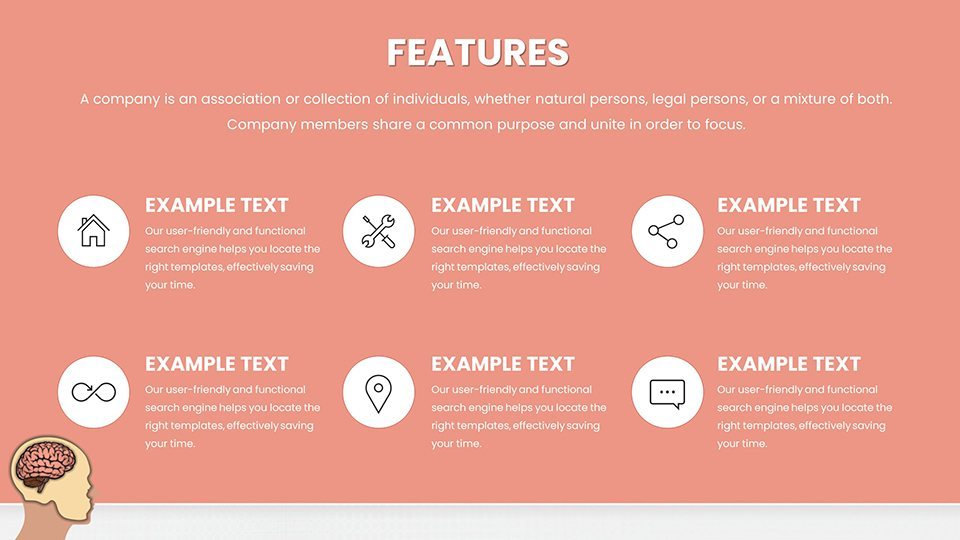
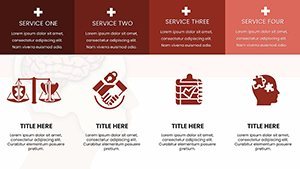
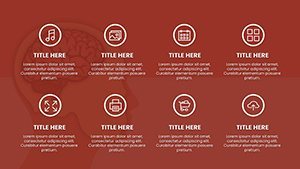
Unlike standard Keynote defaults, this template offers specialized sensory-themed icons, elevating your content beyond basic bullet points and fostering memorable takeaways.
Pro Tips to Amplify Sensory Presentations
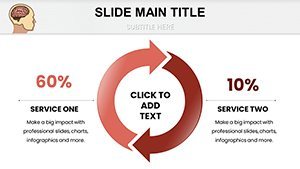
Elevate your delivery by embedding real-life analogies: Compare the vestibular system to a gyroscope, using donut charts to show balance contributions. Cite credible sources like NIH's sensory research to bolster authority. For hybrid events, optimize for screen sharing, ensuring legibility on mobile devices.
Encourage interactivity - pose riddles like "How does touch affect emotion?" before unveiling related graphs. This not only engages but builds trust, showcasing your expertise in cognitive science.
The Edge in Cognitive Communication
What sets this template apart is its focus on holistic sensory education, blending art and science for presentations that stimulate thought. Updated with trends like neuroplasticity from Brain journal articles, it keeps you relevant in fast-evolving fields.
Benefits include streamlined prep, heightened engagement, and stronger retention - imagine audiences recalling your talk on gustatory pathways weeks later. It's an investment in clearer communication.
Step into a world of sensory exploration - secure your template now and sense the difference in your presentations.
Frequently Asked Questions
- How customizable are the sensory diagrams?
- Fully editable, allowing adjustments to reflect specific brain studies or personal branding.
- Does it support Keynote's latest features?
- Yes, compatible with Keynote 11+, including magic move for seamless transitions.
- Ideal for non-experts?
- Absolutely, with intuitive interfaces that simplify complex neuroscience for broad audiences.
- Can I export to other formats?
- Easily export to PDF or video, maintaining quality for diverse sharing needs.
- Are there sensory-specific icons included?
- Yes, a library of icons for each sense enhances visual storytelling.
- What if I need more slides?
- The template's modular design lets you duplicate and adapt as needed.