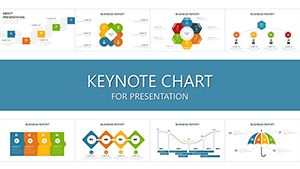
Sphere Financial Risks Keynote Charts: Safeguard Your Future


Type: Keynote Charts template
Category: Spheres
Sources Available: .key
Product ID: KC00859
Template incl.: 21 editable slides
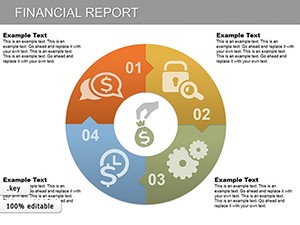
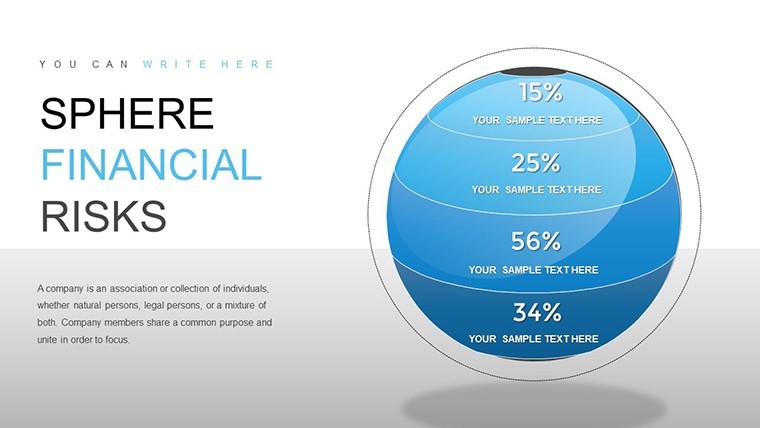
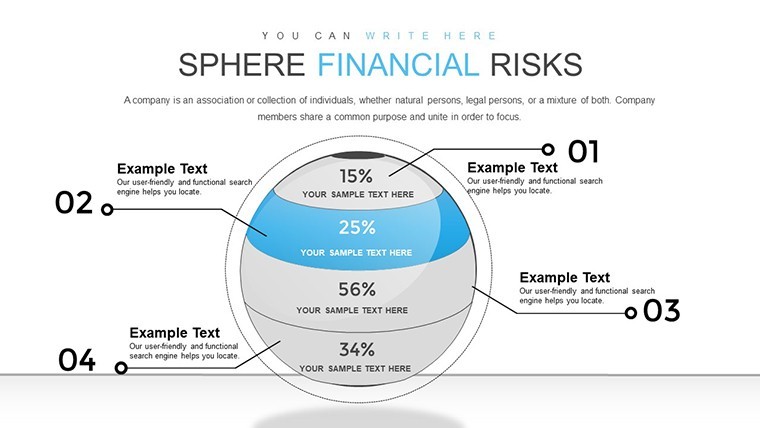
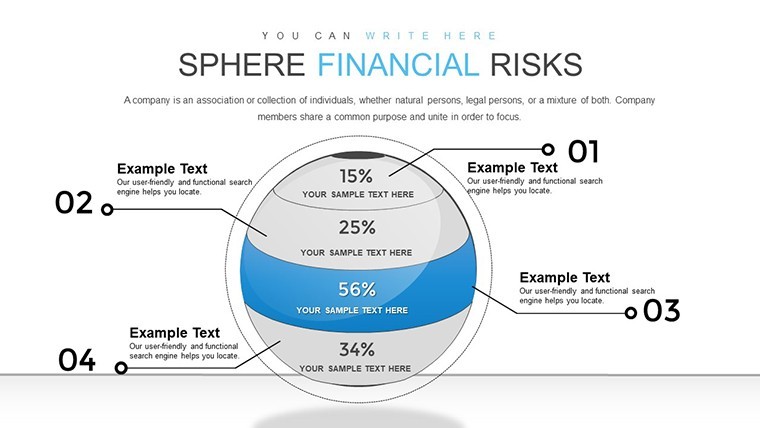
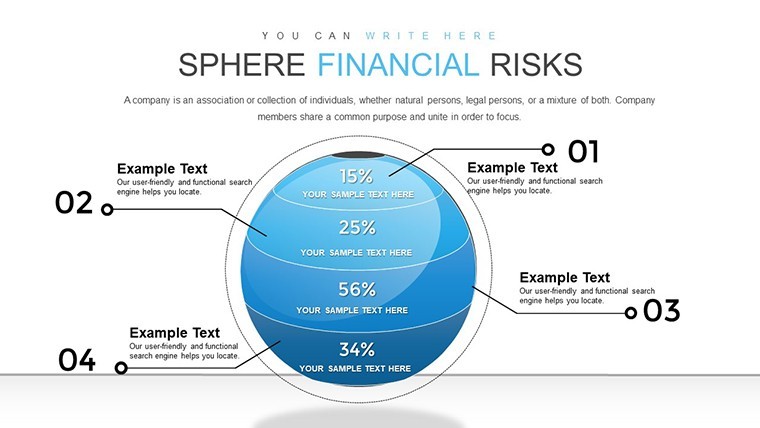
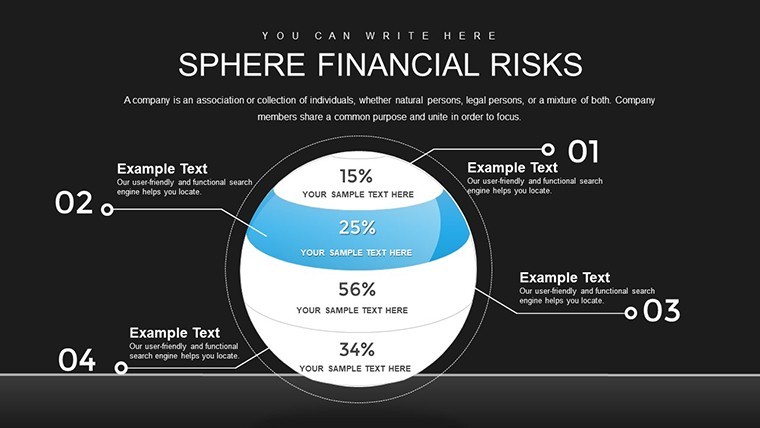
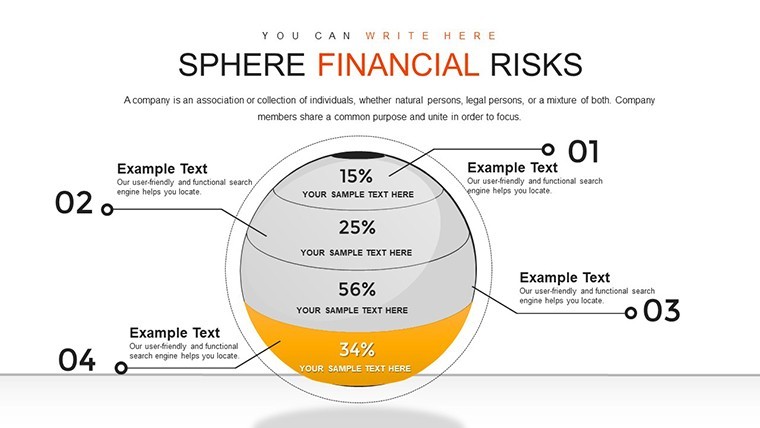
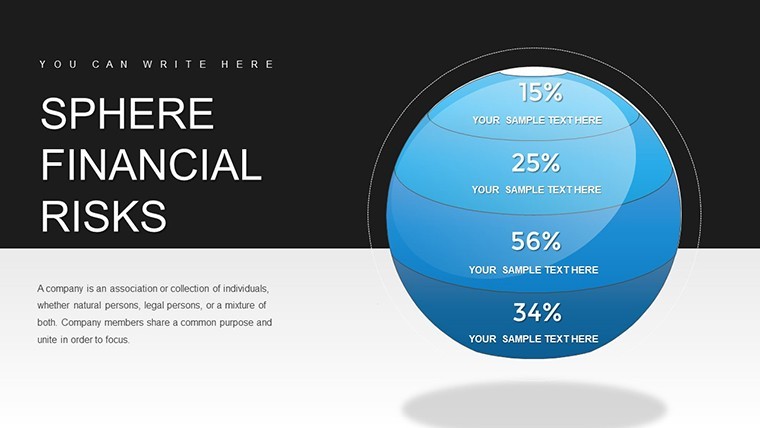
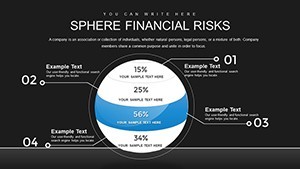
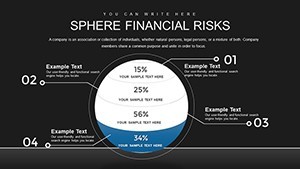
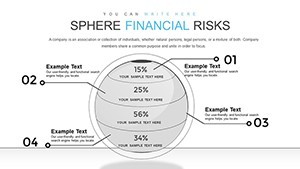
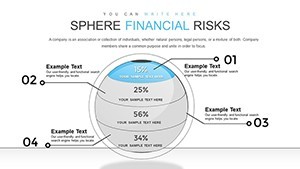
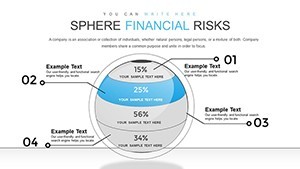
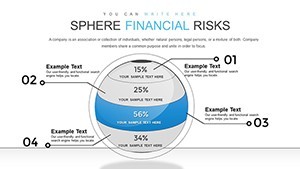
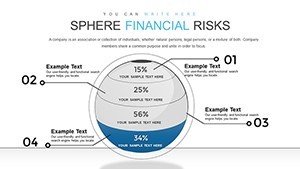
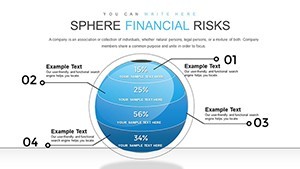
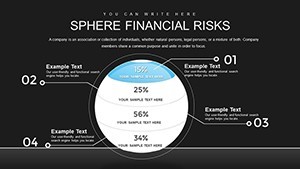
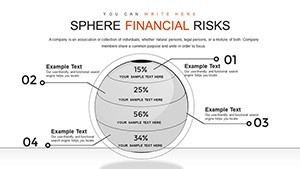
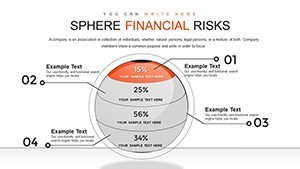
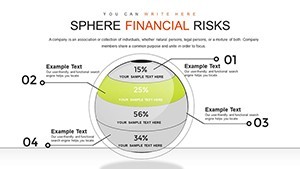
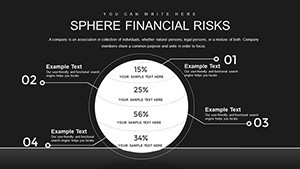
Financial risks lurk in every business corner, from volatile markets to operational hiccups, potentially derailing even the sturdiest enterprises. Our Sphere Financial Risks Keynote Charts template, equipped with 21 editable slides, acts as your vigilant guardian. Crafted for finance professionals, risk managers, and executives, it demystifies threats through spherical diagrams that encapsulate interconnected risks. Drawing from frameworks like those from the CFA Institute, this tool helps identify, assess, and mitigate dangers across categories. Visualize market fluctuations in equity prices or foreign exchanges, credit defaults, liquidity shortfalls, and more - all in one cohesive package. Benefits? Proactive strategies that avert failures, as evidenced by post-2008 financial reforms emphasizing risk visualization. Whether in banking charting regulatory compliance or in startups mapping funding risks, these charts integrate into planning sessions, enhancing decision-making with clear, spherical representations that highlight spheres of influence and overlap.
Decoding Financial Risks Through Innovative Charts
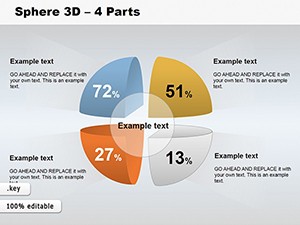
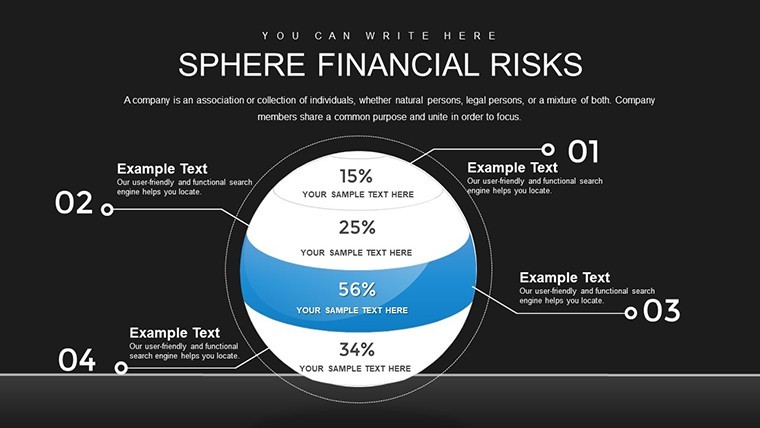
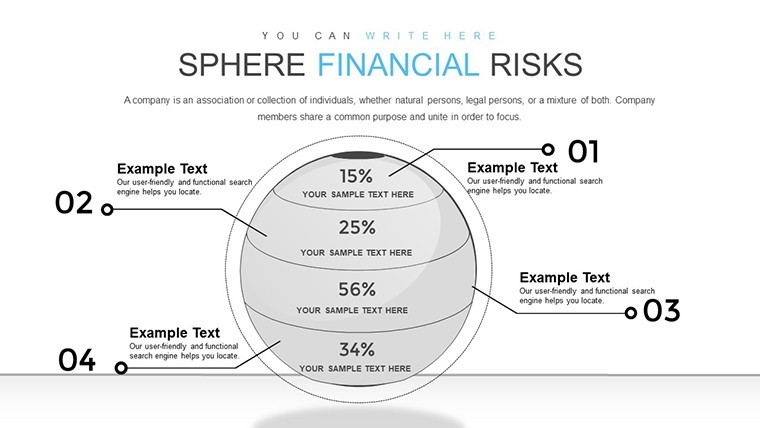
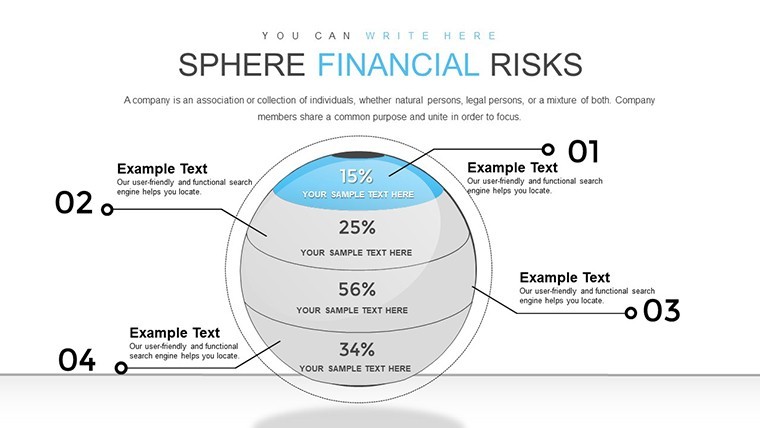
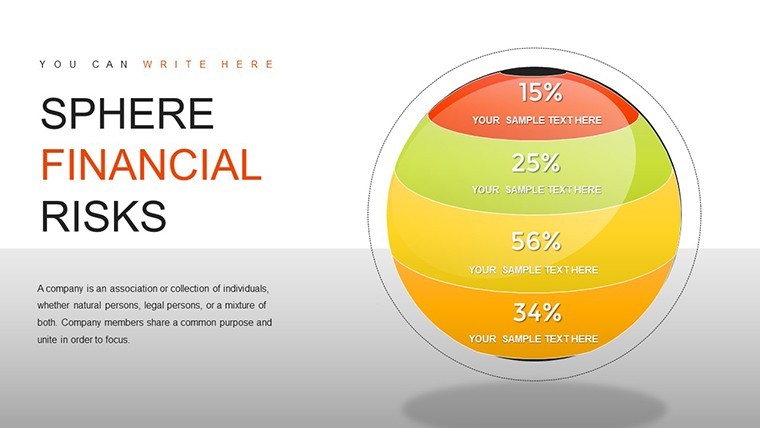
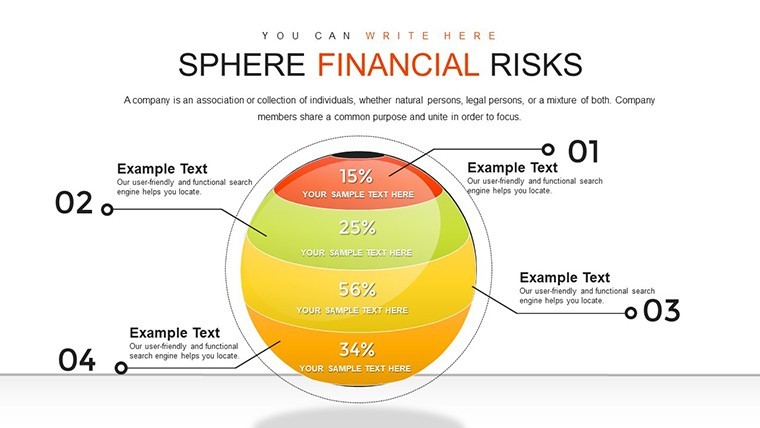
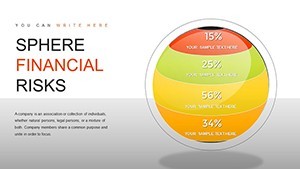
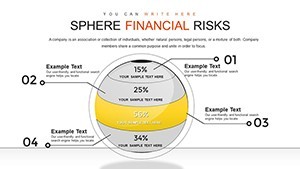
Spherical designs offer a 360-degree view, perfect for multifaceted risks where traditional linear charts fall short. This template's slides provide detailed breakdowns, allowing you to zoom into specifics like interest rate volatility or counterparty exposures. Key advantages include fostered awareness, enabling teams to develop contingency plans that reduce potential losses by up to 25%, per Deloitte insights. Customize spheres with data labels, gradients for severity, and connectors for interdependencies.
Highlight Features for Risk Management Excellence
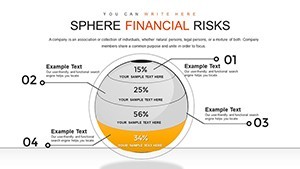
- 21 Specialized Slides: Dedicated to market, credit, liquidity, operational, legal, and reputational risks.
- Editable Spheres: Resize, recolor, and annotate for personalized risk profiles.
- Integrated Graphics: Icons representing risk types for intuitive understanding.
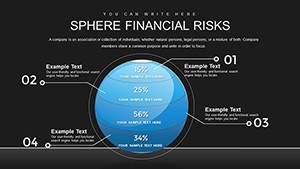
- Animation Capabilities: Rotate spheres or fade in details for engaging narratives.
- Data Compatibility: Link to spreadsheets for real-time updates.
These elements make complex risk assessment accessible and actionable.
Industry-Specific Scenarios and Implementations
In investment firms, use spheres to model portfolio risks, overlapping equity and commodity exposures. For corporations, diagram operational pitfalls like system failures in supply chains. A real-world example: JPMorgan's risk management post-crisis utilized similar visuals to strengthen resilience. Apply in urban planning firms assessing project funding risks or in nonprofits evaluating donor dependencies. Workflow tip: Import risk data from tools like Excel, visualize in Keynote, then export for reports - promoting compliance with standards like COSO frameworks.
Strategic Risk Mitigation: Step-by-Step
- Identify Risks: Catalog threats using category-specific slides.
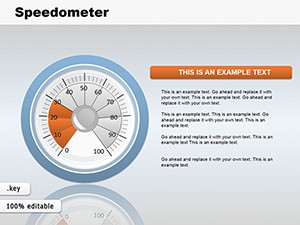
- Assess Impact: Rate severity with color-coded spheres.
- Map Interconnections: Connect spheres to show cascading effects.
- Devise Strategies: Annotate mitigation tactics.
- Monitor and Update: Use animations for ongoing reviews.
- Communicate: Present to stakeholders for buy-in.
This process aligns with enterprise risk management best practices.
Elevating Beyond Basic Risk Tools
Standard charts miss the holistic view; this template's spheres capture nuances, cutting analysis time significantly. Aligned with expert sources like the Financial Stability Board, it ensures credibility. Incorporate LSI such as "risk sphere modeling" for enhanced visibility.
Fortify your defenses - acquire this Sphere Financial Risks template today and navigate uncertainties with confidence.
Frequently Asked Questions
What risk categories are covered?
Market, credit, liquidity, operational, legal, and reputational, with detailed sub-types.
How customizable are the spheres?
Fully, including size, color, and connections for tailored visualizations.
Suitable for which sectors?
Finance, corporate, startups, and more focused on risk management.
Can I add real-time data?
Yes, via Keynote's data linking features.
Why spheres over traditional charts?
They provide a comprehensive, interconnected view of risks.