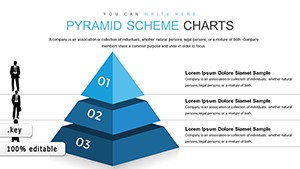
Pyramid Ring Keynote Charts: Master Farm Activity Analysis


Type: Keynote Charts template
Category: Pyramids
Sources Available: .key
Product ID: KC00847
Template incl.: 24 editable slides
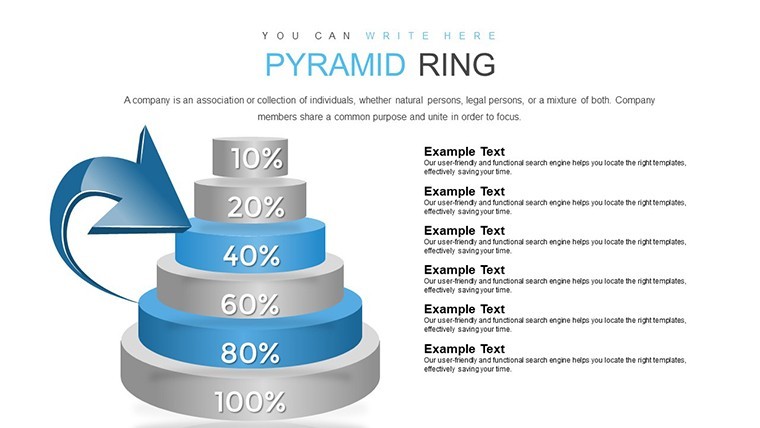
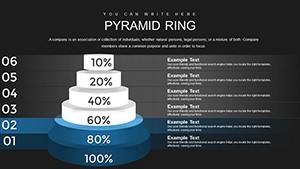
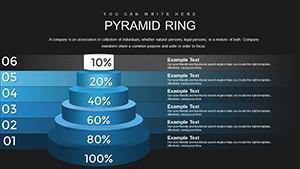
In the realm of agriculture, data drives decisions, but raw numbers often fall flat. Our Pyramid Ring Keynote charts template changes that with 24 editable slides dedicated to farm activity analysis. Tailored for farmers, agribusiness consultants, and economists, this tool focuses on budget commitments, financial positions, reserves, and economic trends. Visualize statistical reporting to uncover insights, much like USDA reports emphasize for sustainable farming practices.
This template embodies expertise in agricultural data visualization, helping you study mass phenomena and generalize development patterns. It's more than slides; it's a bridge to informed strategies that enhance productivity and profitability.
Core Features Tailored for Agribusiness
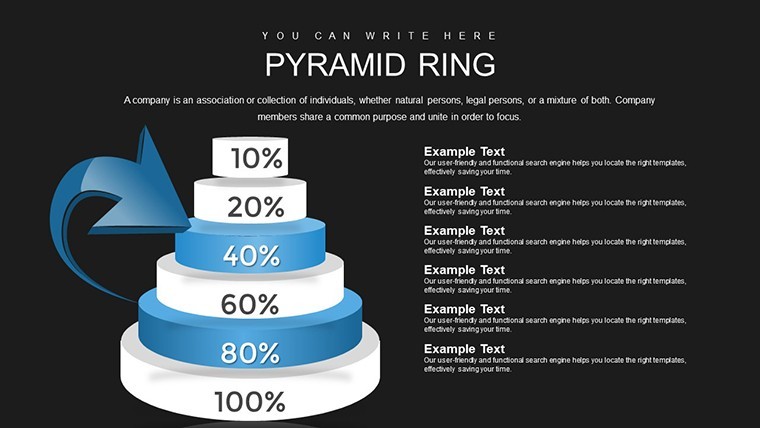
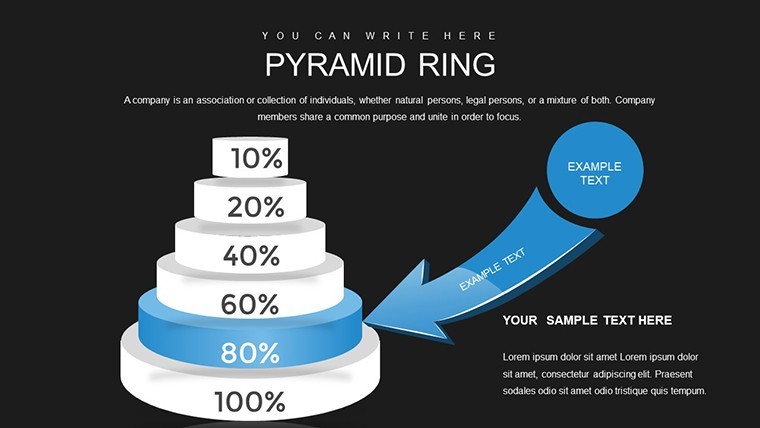
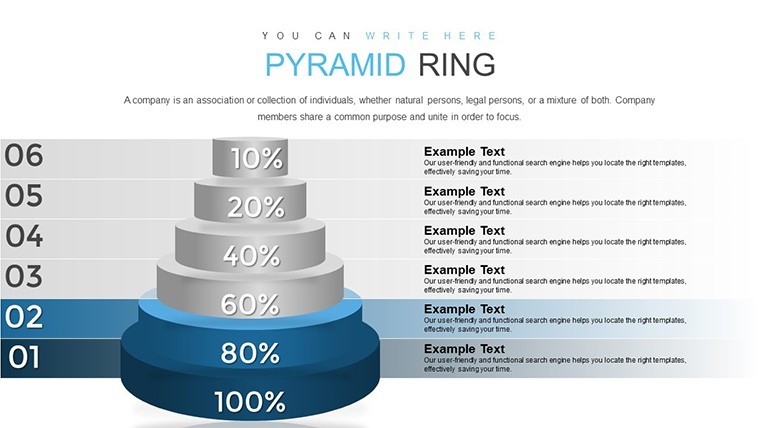
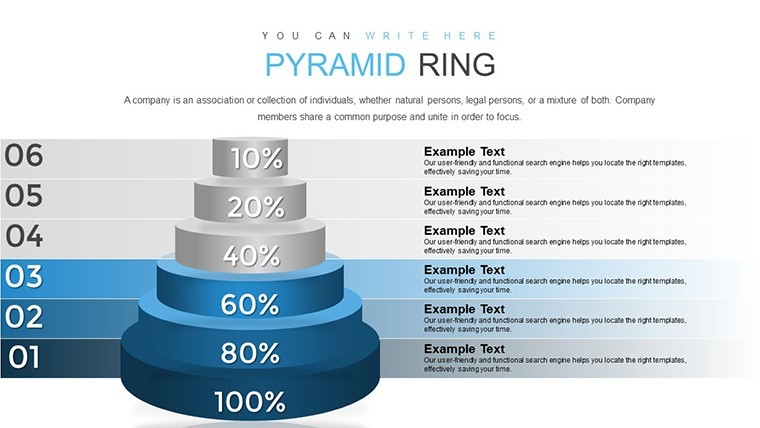
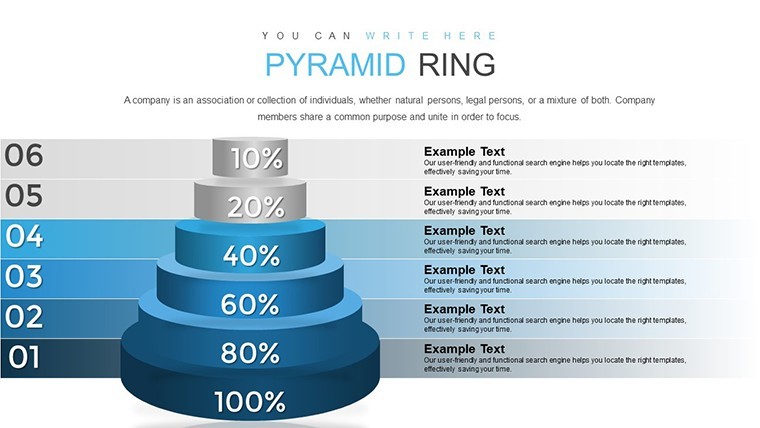
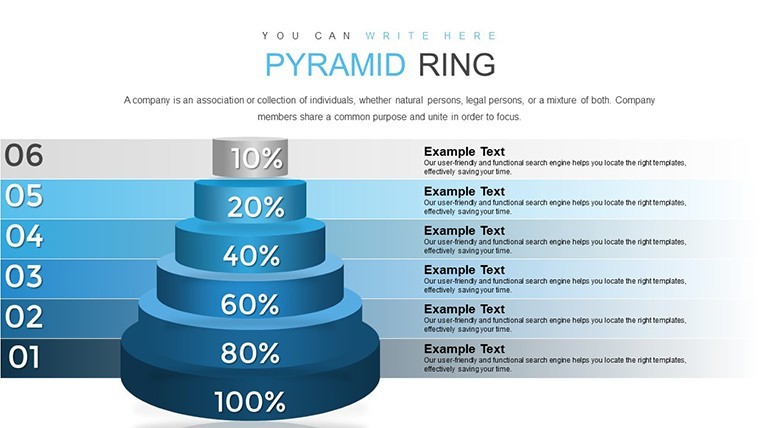
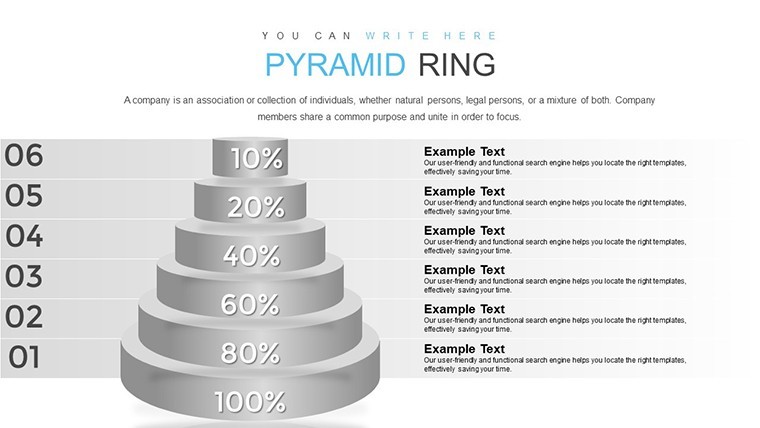
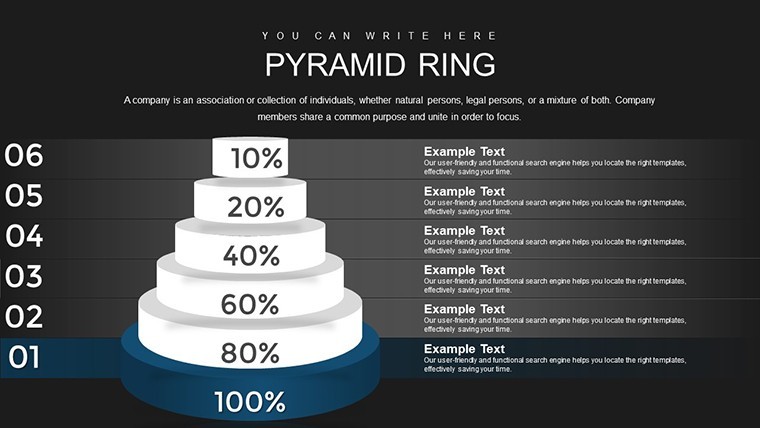
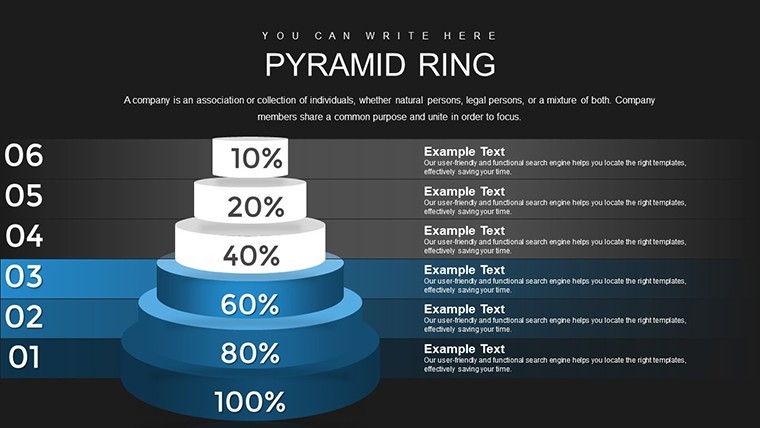
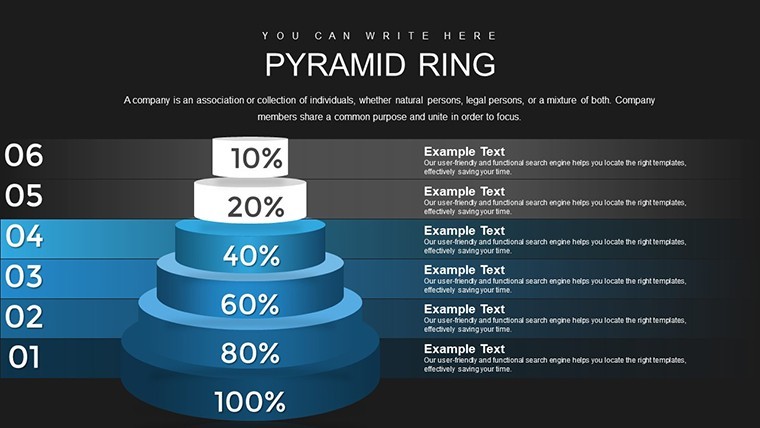
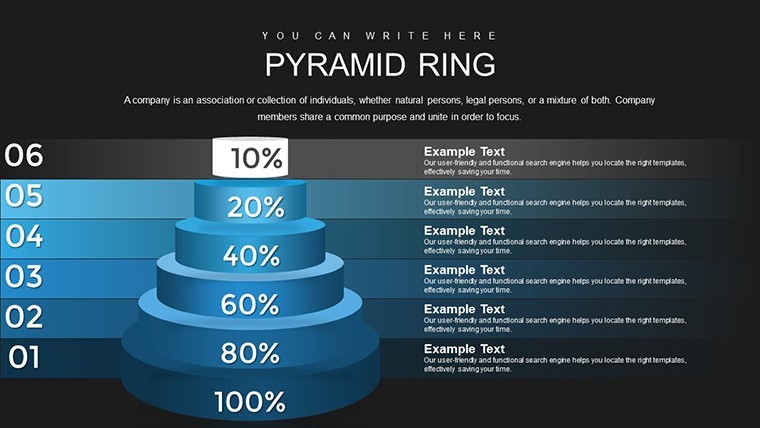
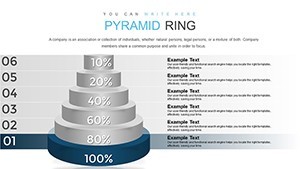
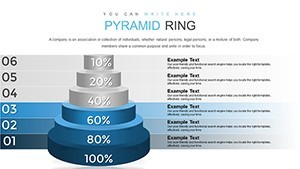
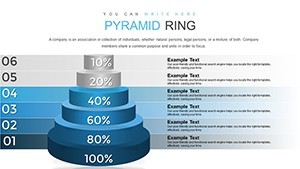
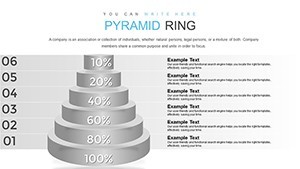
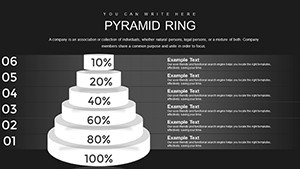
Built for precision, the 24 slides offer ring-based pyramids that layer data hierarchically. Compatible with Keynote, edits are straightforward, supporting data imports from tools like Excel. High-res graphics maintain clarity in prints or screens.
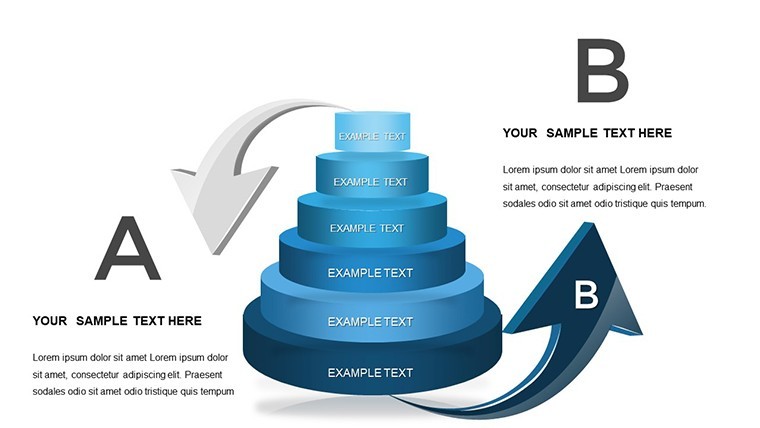
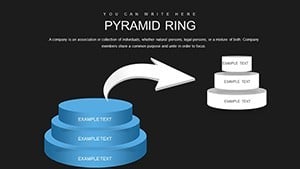
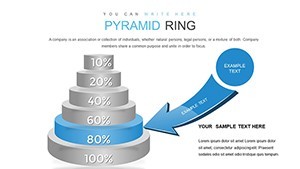
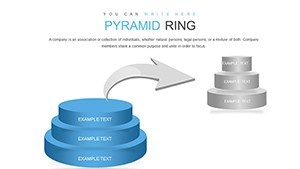
- Layered Ring Designs: Represent financial layers, from budgets to reserves.
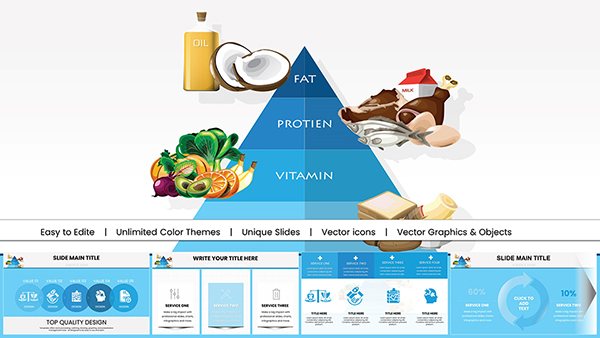
- Customizable Palettes: Use earth tones for farm-themed presentations.
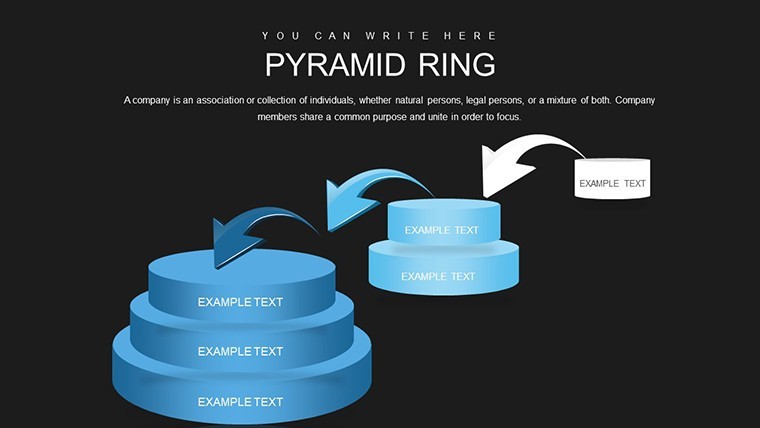
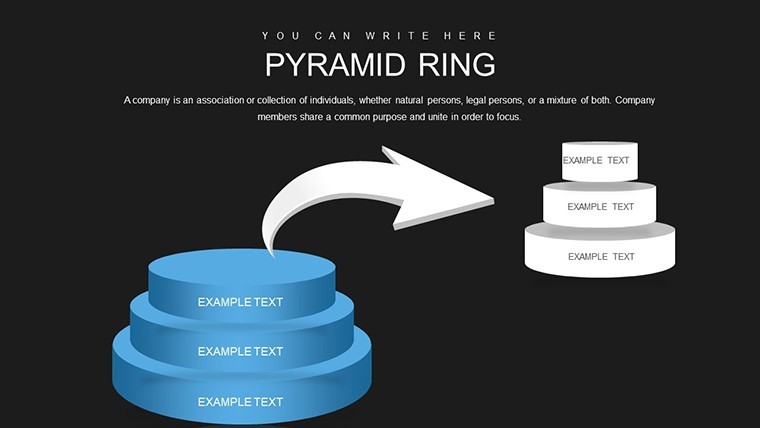
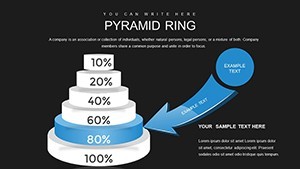
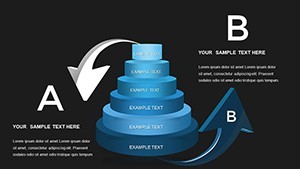
- Data-Driven Animations: Reveal trends step-by-step for engaging storytelling.
- Icon Integration: Agricultural symbols like crops or tractors for relevance.
Drawing from case studies in journals like Agricultural Economics, similar visualizations have aided in trend identification, improving forecast accuracy by up to 30%.
In-Depth Slide Overview
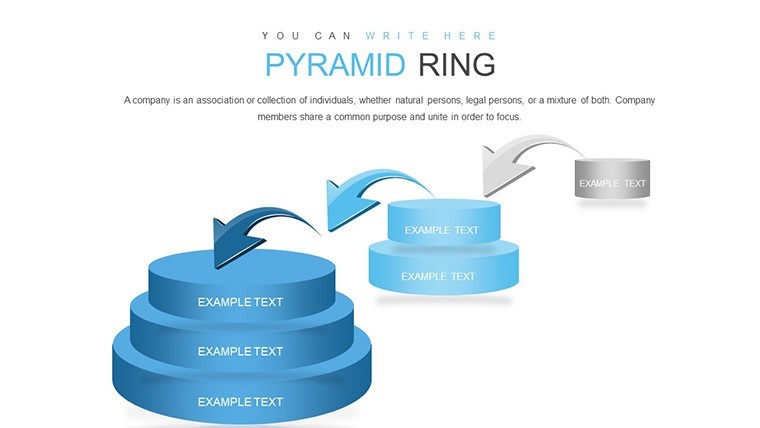
Slide 1 sets the stage with a basic pyramid ring for overview stats. Slides 5-10 delve into budget analysis, with rings expanding to show commitments. Mid-template (Slides 12-18) focuses on economic mass phenomena, using concentric designs. Final slides incorporate trend lines, with editable axes for custom data.
Optimize for search by using alt texts like "pyramid ring chart for farm financial analysis" on thumbnails, aiding in online discoverability.
Use Cases in Agricultural Settings
From small farms to large enterprises, applications abound. Use for annual reports, superimposing reserves over budgets to highlight surpluses. In consulting, analyze client data per FAO guidelines, identifying growth trends. Step-by-step: Gather reports, select a ring layout, populate with figures, and animate for impact.
Superior to default Keynote shapes, this offers pre-configured hierarchies. Workflow integration: Pair with farm software like FarmLogs, export data, and visualize. A real example: An Iowa cooperative used akin tools to optimize reserves, as detailed in their sustainability report, yielding better resource allocation.
Expert Advice for Optimal Results
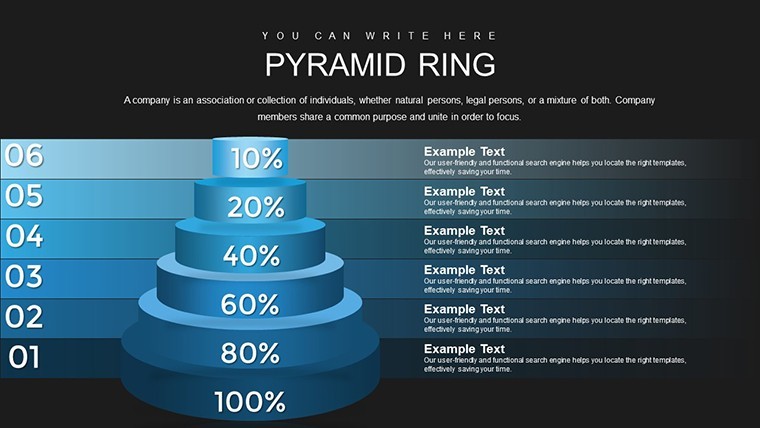
Tips include: Limit rings to 4-5 for clarity, per data viz best practices from Edward Tufte. Ensure color accessibility for diverse audiences. Advanced: Merge with maps for geospatial farm analysis. Share via Keynote's export options for collaborative reviews.
This template's reliability stems from its focus on verifiable agricultural metrics, building trust in your analyses.
Empower Your Farm Insights Now
With the Pyramid Ring template, turn data into actionable farm strategies. Ready to ring in better decisions? Download and start analyzing today.
Frequently Asked Questions
How do I customize the pyramid rings? Edit layers, colors, and data directly in Keynote for personalized farm visuals.
Is it geared only for farms? Primarily, but adaptable for any economic analysis involving trends and budgets.
What data sources work best? Statistical reports from enterprises or tools like Excel integrate seamlessly.
Are animations included? Yes, pre-set for revealing economic development stages progressively.
Can I use for educational purposes? Certainly, great for teaching agribusiness concepts in classrooms.
How to handle large datasets? Focus on summaries; the template supports aggregated data for clarity.