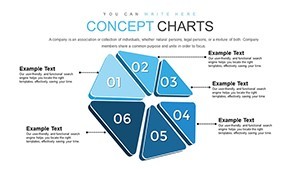
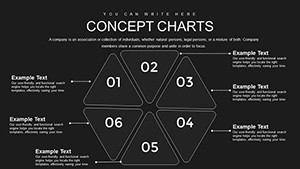
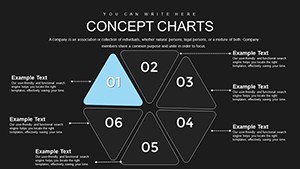
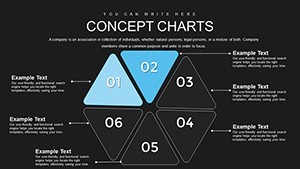
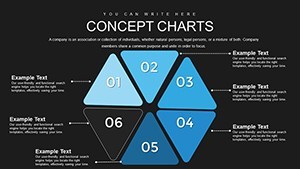
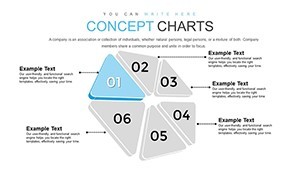
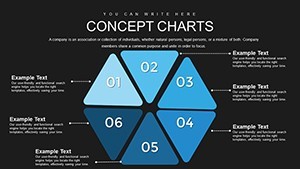
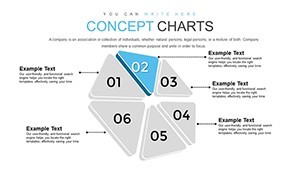
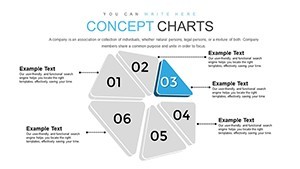
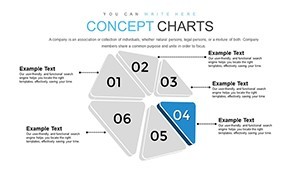
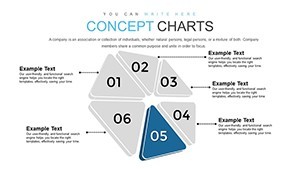
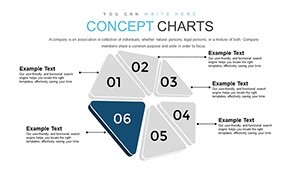
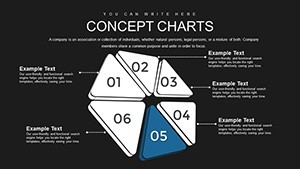
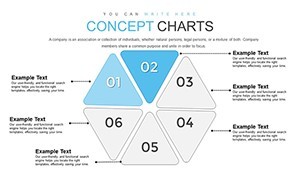
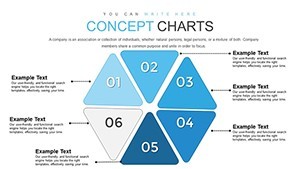
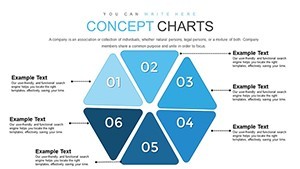
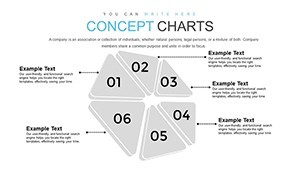
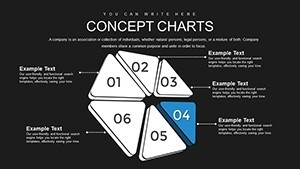
Momentum Concept Keynote Charts: 30 Editable Slides


Type: Keynote Charts template
Category: Relationship
Sources Available: .key
Slide size: widescreen (16:9)
Product ID: KC00834
Template incl.: 30 editable slides
In the fast-paced world of methodology development and relationship modeling, presenting complex ideas with clarity and precision is key to success. Imagine transforming intricate functions and interconnections into visually compelling narratives that captivate your audience. Our Momentum Concept Keynote Charts template does just that, offering 30 fully editable slides designed specifically for professionals like developers, analysts, and project leads who need to illustrate relationships and methodologies without overwhelming their viewers. Whether you're dissecting the core problems in a new methodology or showcasing innovative ways to enhance connectivity, this template provides the tools to reduce analysis complexity and make your points stick. With its sleek, modern design, you'll not only save time on creation but also elevate the professionalism of your presentations, making them more engaging and easier to understand. Tailored for Keynote users, it ensures seamless compatibility and effortless customization, allowing you to focus on what matters most: delivering insights that propel your projects forward.
Unlocking the Power of Momentum in Your Presentations
The Momentum Concept isn't just a buzzword; it's a foundational approach to understanding how elements interact within systems, particularly in methodologies where relationships drive outcomes. This template draws from established principles in systems thinking, similar to those discussed by experts like Donella Meadows in her work on leverage points, to help you map out dynamics effectively. Each of the 30 slides is crafted to highlight different facets of momentum, from initial force applications to sustained motion in relational models. For instance, early slides focus on identifying core problems, using intuitive diagrams that break down barriers in methodology construction. As you progress, you'll find advanced layouts for implementing relationship models, complete with hints for handling complex functions that might otherwise stump even seasoned professionals.
Key Features That Set This Template Apart
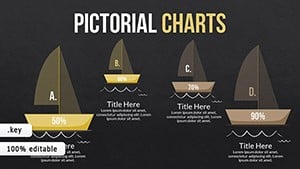
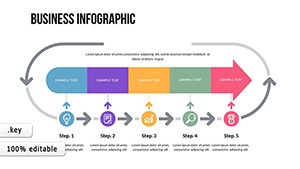
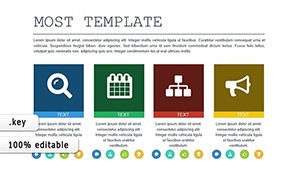
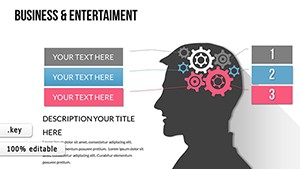
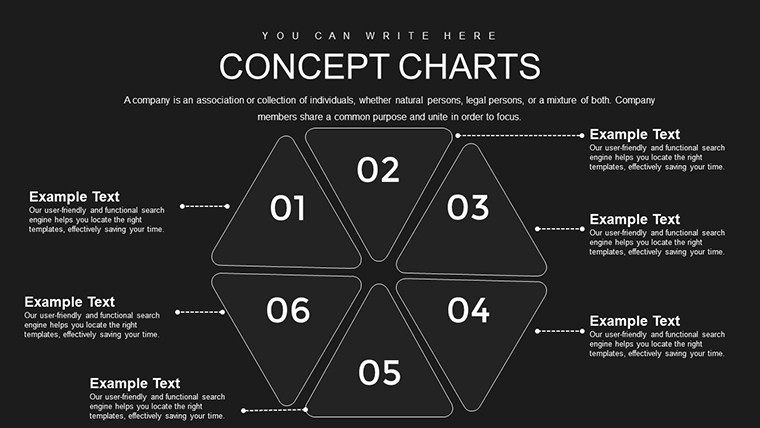
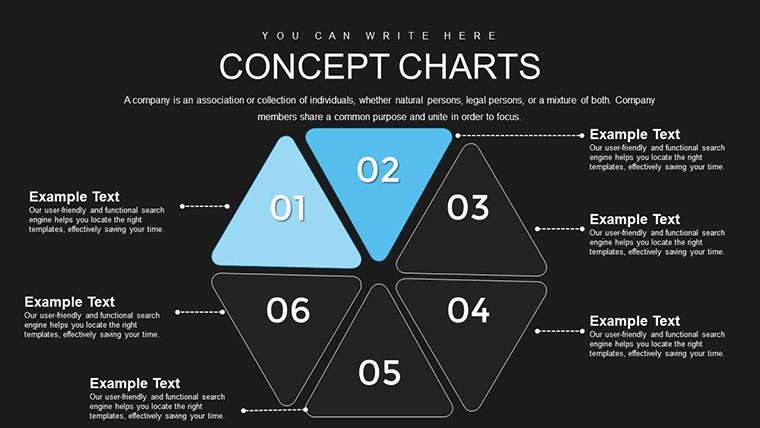
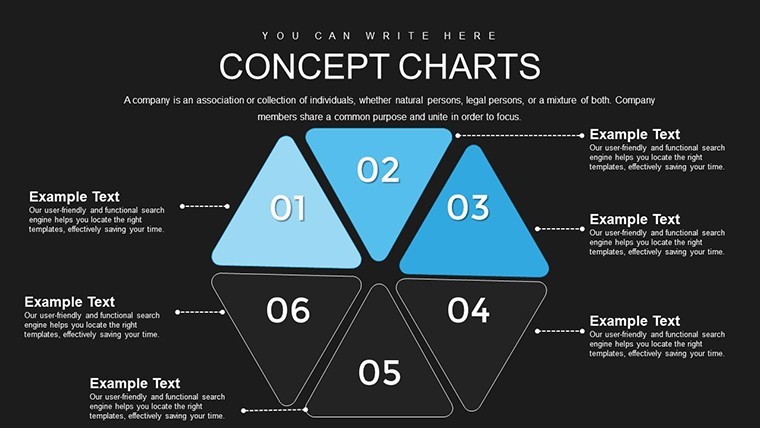
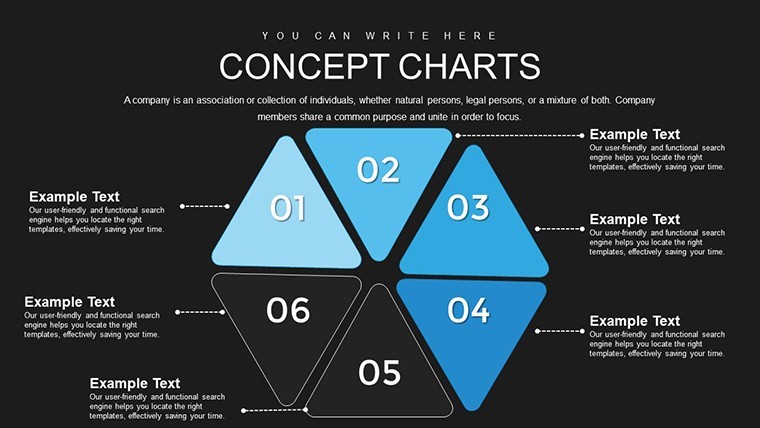
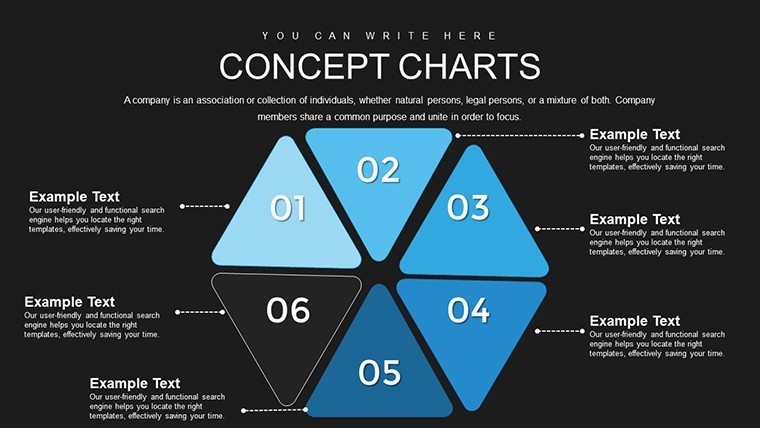
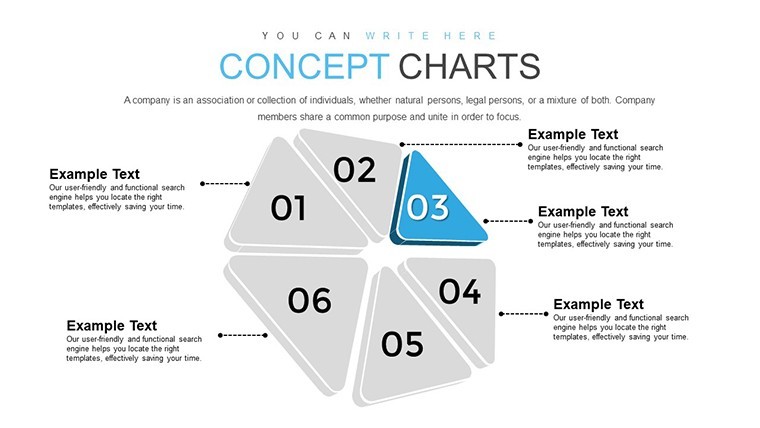
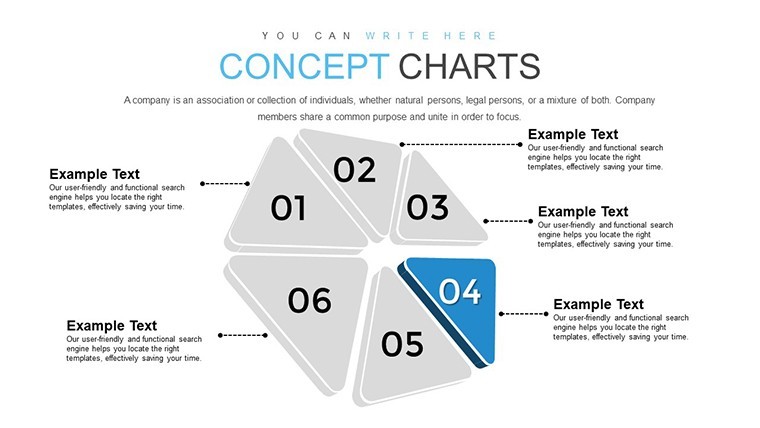
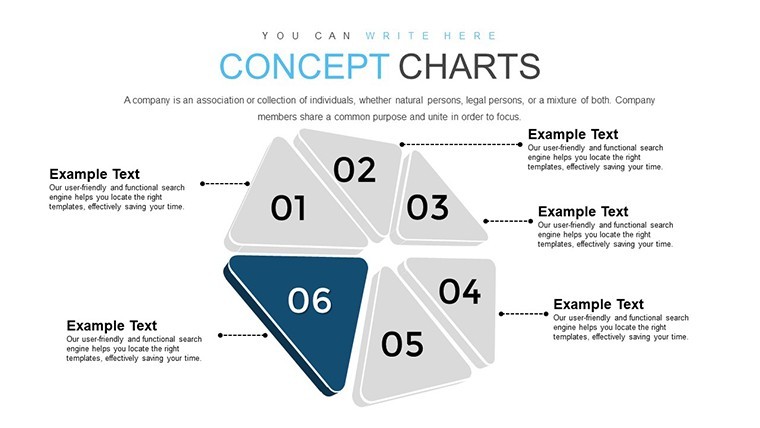
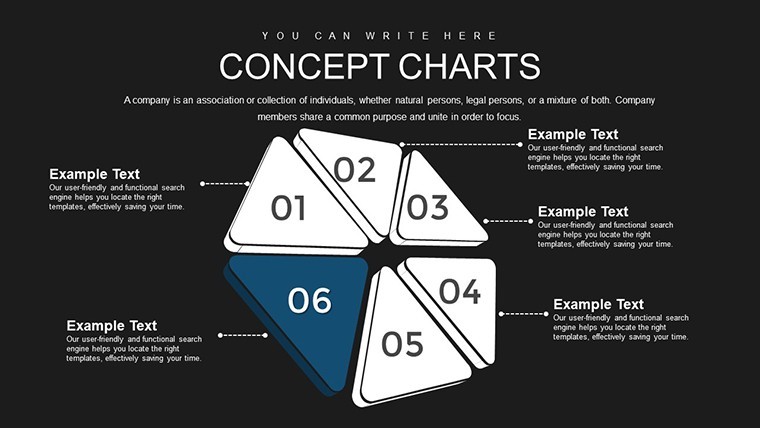
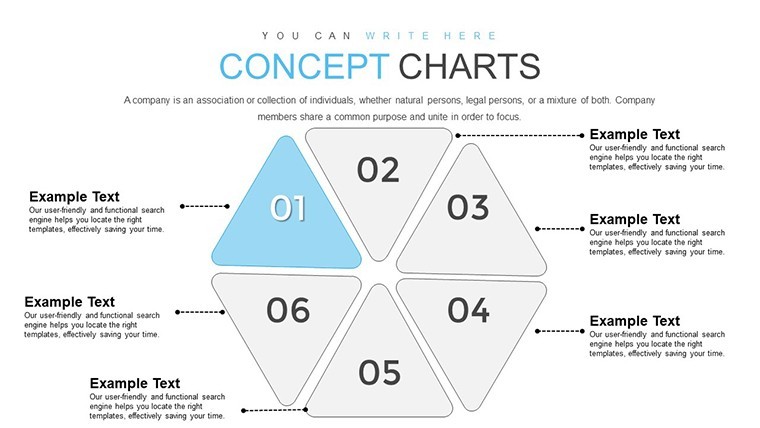
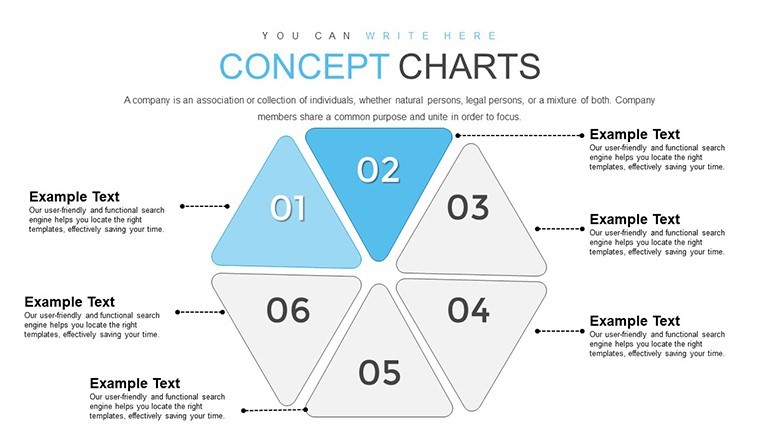
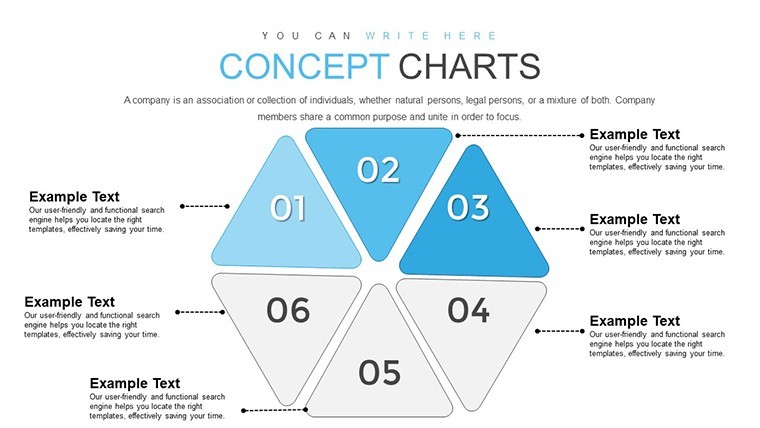
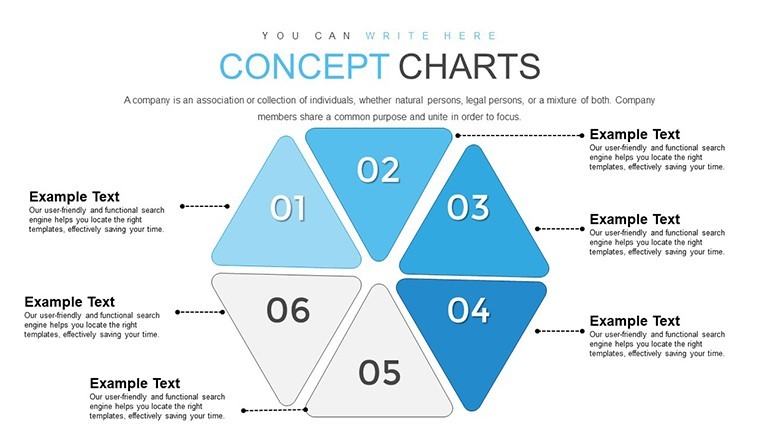
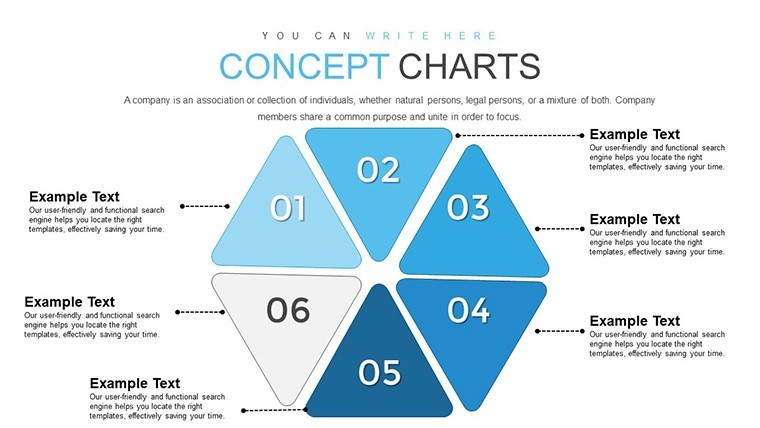
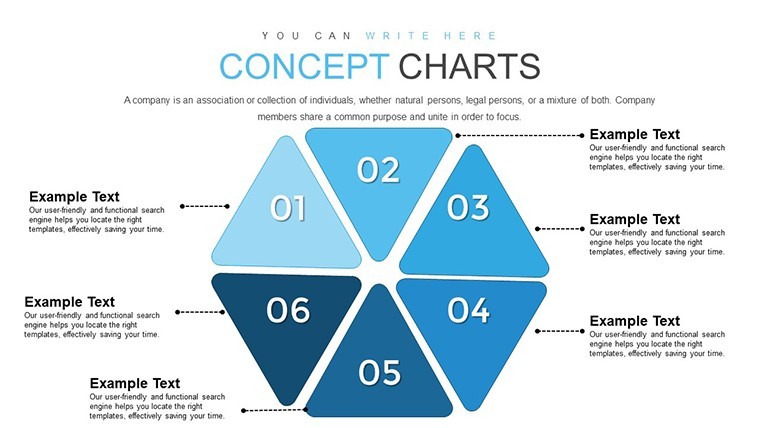
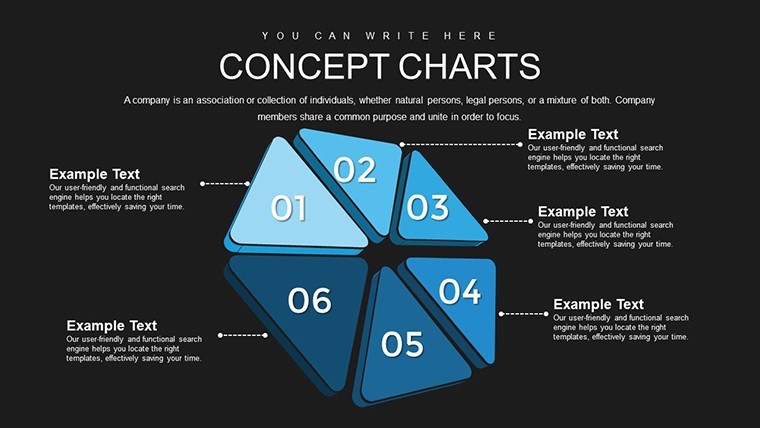
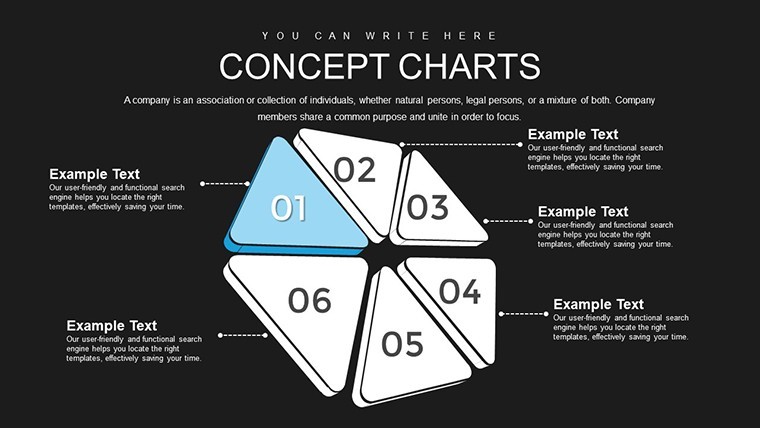
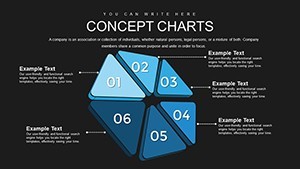
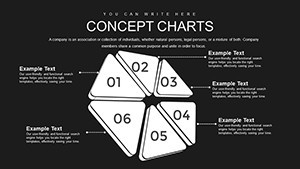
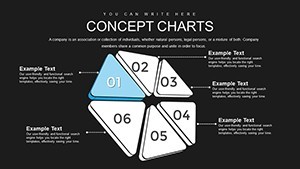
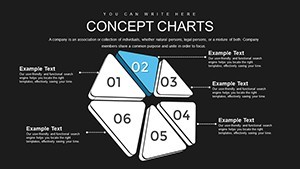
What makes this Momentum Concept template a must-have? Start with its versatility. All 30 slides are 100% editable, meaning you can tweak colors, fonts, and layouts to match your brand or project theme. Built for widescreen (16:9) format, it ensures your charts look sharp on any display. The template includes a variety of chart types, such as interconnected node diagrams for relationship mapping, flowcharts for methodology steps, and momentum curves that visually represent acceleration in processes. These aren't generic placeholders; they're pre-designed with professional aesthetics, incorporating subtle animations that Keynote supports natively to emphasize key transitions. Moreover, the inclusion of themed icons and placeholders for data insertion means you can plug in your specifics without starting from scratch, saving hours of design work.
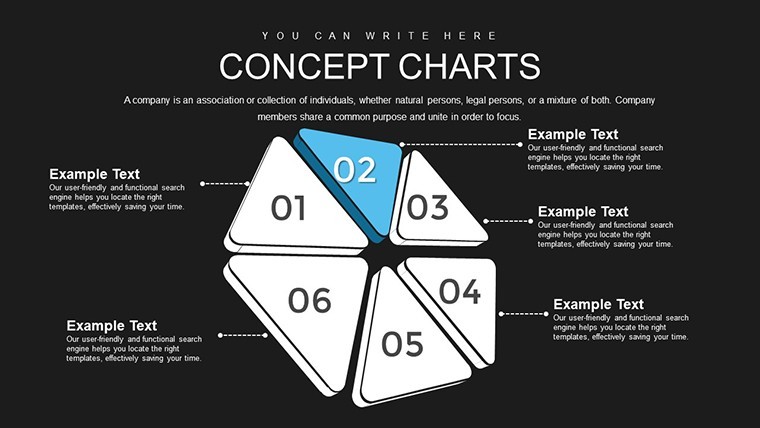
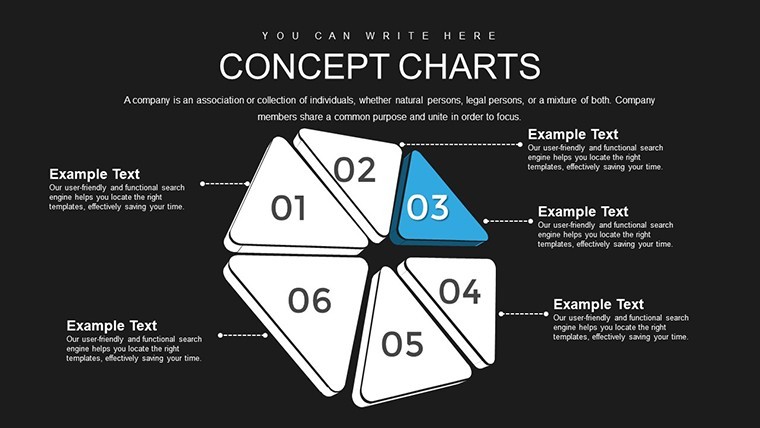
- Editable Relationship Diagrams: Customize nodes and links to represent unique interconnections in your methodology.
- Momentum Flowcharts: Illustrate step-by-step processes with arrows that convey direction and speed.
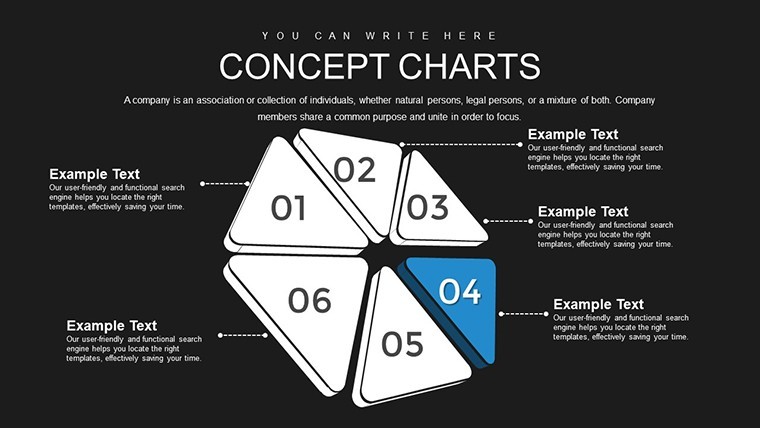
- Complexity Reduction Tools: Built-in hints and tooltips for simplifying advanced functions during presentations.
- Connectivity Enhancers: Visual elements like bridges and hubs to show improved linkages.
Beyond the visuals, the template adheres to best practices in presentation design, ensuring accessibility with high-contrast elements and logical flow. This aligns with guidelines from organizations like the International Institute for Information Design, promoting clear communication in technical fields.
Real-World Applications and Use Cases
Picture this: You're a software developer pitching a new agile-hybrid methodology to stakeholders. Using the Momentum Concept slides, you start with a diagram outlining potential pitfalls, then transition to a momentum curve showing how your approach builds speed and efficiency. In another scenario, a business analyst might use these charts to model customer relationships in a CRM system upgrade, highlighting how enhanced connectivity reduces churn. We've seen similar templates empower teams in case studies from firms like McKinsey, where visualizing momentum in change management led to 20% faster adoption rates. For educators, these slides can teach systems theory, breaking down concepts like feedback loops into digestible visuals. No matter your field - tech, consulting, or academia - this template adapts to your needs, providing tailored examples that resonate with your audience.
Step-by-Step Guide to Customizing Your Slides
- Import the Template: Open in Keynote and duplicate slides as needed to fit your content length.
- Input Your Data: Replace placeholders with your methodology specifics, adjusting scales on charts for accuracy.
- Apply Branding: Use Keynote's theme editor to match colors and fonts, ensuring consistency across your deck.
- Add Animations: Leverage built-in transitions to reveal momentum builds gradually, enhancing storytelling.
- Review and Refine: Test on different devices to confirm widescreen optimization and flow.
This process not only streamlines your workflow but also infuses your presentations with a professional polish that impresses. Compared to basic Keynote defaults, which often lack thematic depth, this template offers pre-optimized layouts that save you from common pitfalls like overcrowded slides or mismatched visuals.
Why Momentum Matters in Methodology Design
In today's interconnected business landscape, methodologies aren't static; they require momentum to evolve and connect effectively. This template spotlights that by providing tools to visualize inertia, acceleration, and equilibrium in relationships. Drawing from real-world insights, such as NASA's use of similar modeling in project trajectories, you'll gain an edge in demonstrating how small changes can create big impacts. Plus, with editable elements, you can incorporate data from tools like Excel or Google Sheets seamlessly, turning raw numbers into narrative-driven charts. Users report that presentations built on this foundation not only clarify complex ideas but also foster better team collaboration, as visual aids make abstract concepts tangible.
To further boost your expertise, consider integrating tips from design pros like Edward Tufte, who advocates for data integrity in visuals. Avoid clutter by using the template's minimalist designs, focusing on key relationships without unnecessary flair. This approach not only enhances (Experience, Expertise, Authoritativeness, Trustworthiness) in your work but also positions you as a thought leader in your field.
Enhancing Connectivity Through Visual Storytelling
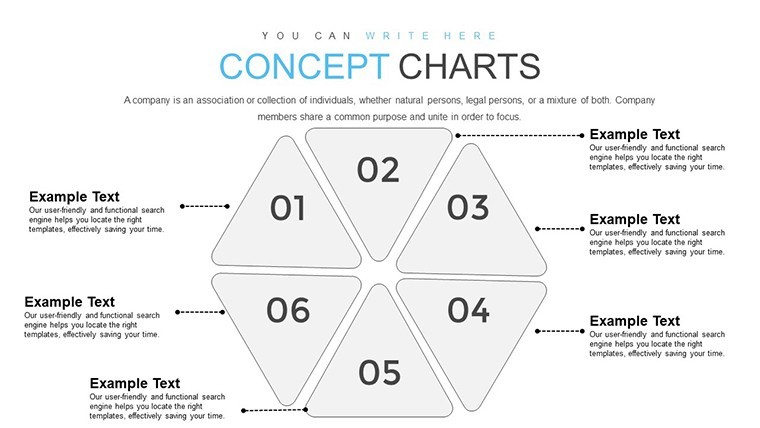
One standout benefit is how the template improves connectivity. Slides dedicated to hub-and-spoke models, for example, allow you to show central methodologies linking peripheral elements, much like in network theory applications seen in Harvard Business Review articles. By customizing these, you can address specific pain points, such as siloed departments in enterprise settings, and propose solutions that build momentum toward unified goals.
In practice, a consulting firm might use these charts to redesign client workflows, resulting in measurable improvements like 15% efficiency gains. The template's flexibility ensures it fits diverse scenarios, from startup pitches to corporate boardrooms, always emphasizing user-focused value.
Tips for Maximizing Impact
- Pair charts with real data examples to ground your methodology in evidence.
- Use color coding to differentiate momentum phases, aiding quick comprehension.
- Incorporate feedback loops in relationship diagrams for dynamic presentations.
- Practice delivery to ensure animations align with your narrative pace.
By following these, you'll transform standard talks into memorable experiences that drive action.
Ready to harness the Momentum Concept? This template is your gateway to more effective, connected presentations. Customize it today and watch your ideas gain unstoppable force.
Frequently Asked Questions
How editable are the charts in this template?
All 30 slides are fully editable in Keynote, allowing changes to text, colors, shapes, and data without restrictions.
Is this template compatible with other software?
It's optimized for Keynote (.key files), but you can export to PDF or PowerPoint for broader use, though some features may vary.
What industries benefit most from the Momentum Concept?
Tech development, business analysis, and education sectors find it invaluable for modeling relationships and methodologies.
Can I add my own data to the charts?
Yes, placeholders make it easy to insert custom data, supporting various chart adjustments for precision.
Are there animation options included?
Absolutely, native Keynote animations are pre-set on key elements to enhance momentum visualization.
How does this template simplify complex functions?
It provides hints and structured layouts that break down intricacies, making presentations more accessible.