Life Cycle Analysis Keynote Charts for Managers


Type: Keynote Charts template
Category: Cycle, Business Models
Sources Available: .key
Slide size: widescreen (16:9)
Product ID: KC00832
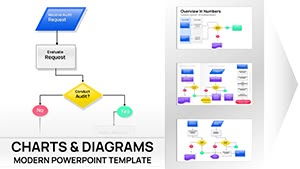
Template incl.: 24 editable slides
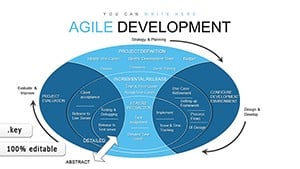
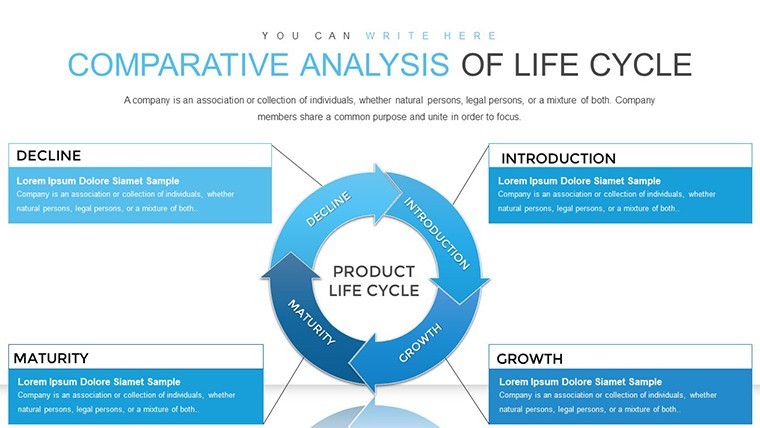
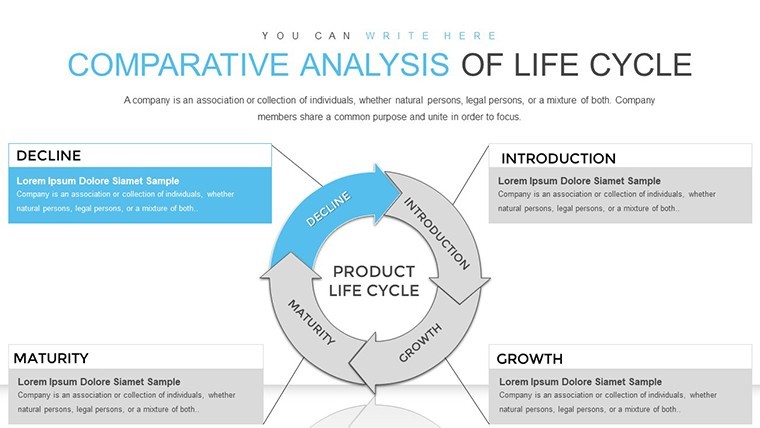
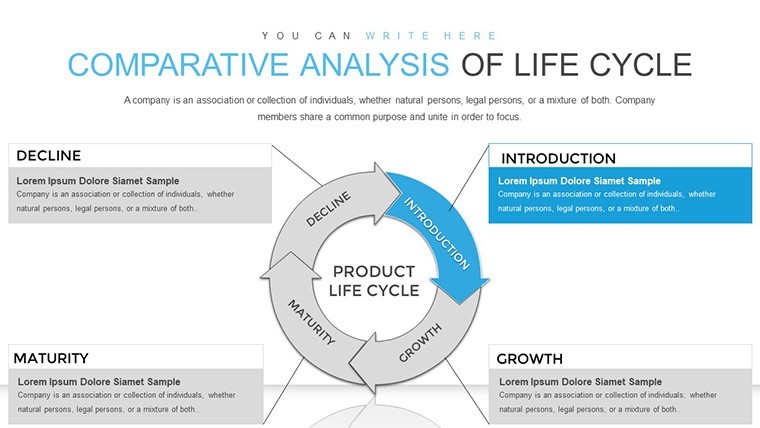
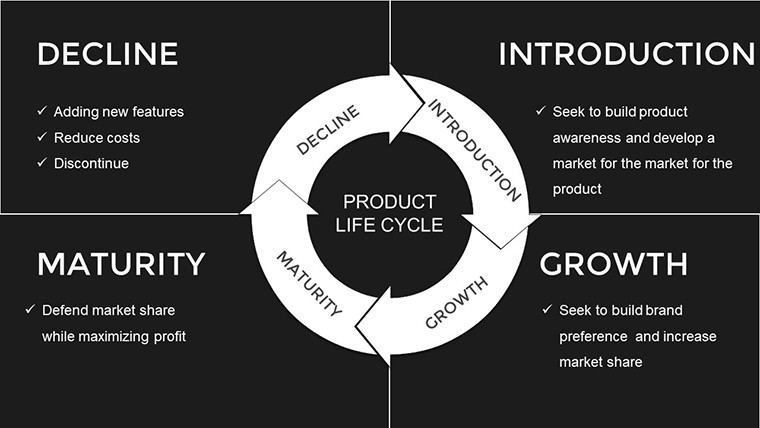
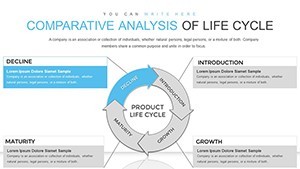
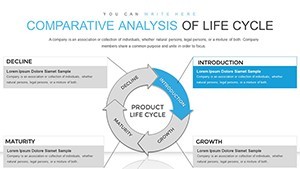
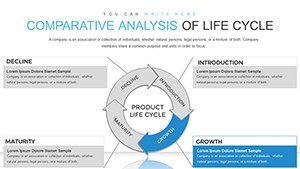
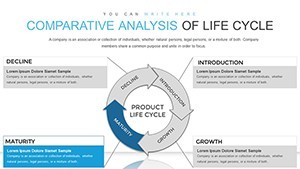
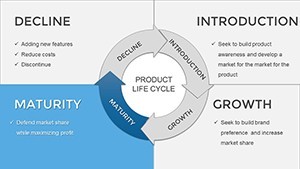
Managing organizational growth requires a keen understanding of life cycles - from inception to maturity and beyond. Our Comparative Analysis of Life Cycle Keynote Charts template equips managers with 24 editable slides to demystify these stages, highlighting how management functions evolve with company development. Designed for business leaders, consultants, and educators, this tool transforms abstract theories into vivid visuals, fostering better decision-making. Whether you're analyzing a startup's rapid expansion or a mature firm's renewal strategies, these charts provide clarity, reducing complexity for both study and application. Compatible with Keynote's intuitive interface, it allows quick customizations, ensuring your presentations are not just informative but transformative. Embrace this resource to spotlight differences in leadership approaches across phases, drawing from established models like those in Adizes' corporate life cycle theory, and propel your team toward sustained success.
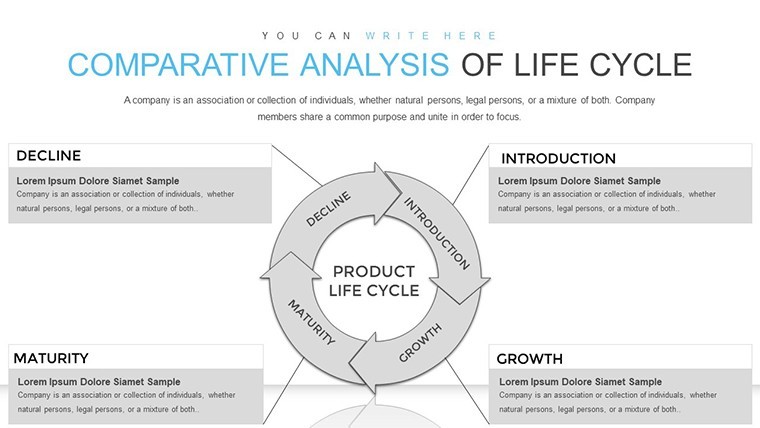
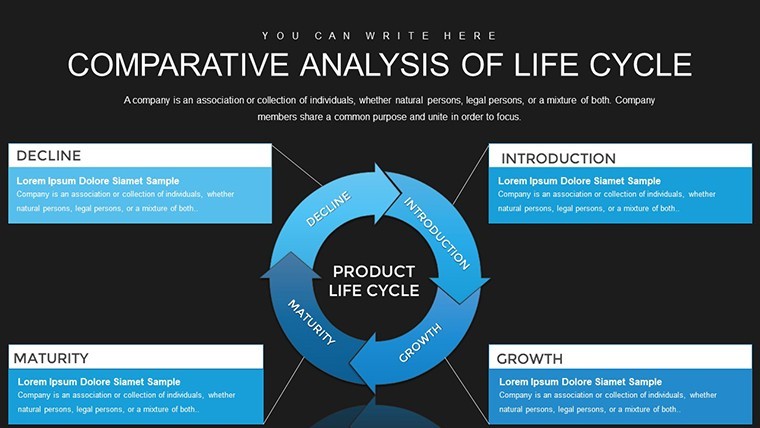
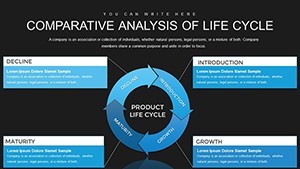
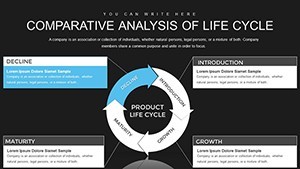
Exploring Organizational Life Cycles with Precision
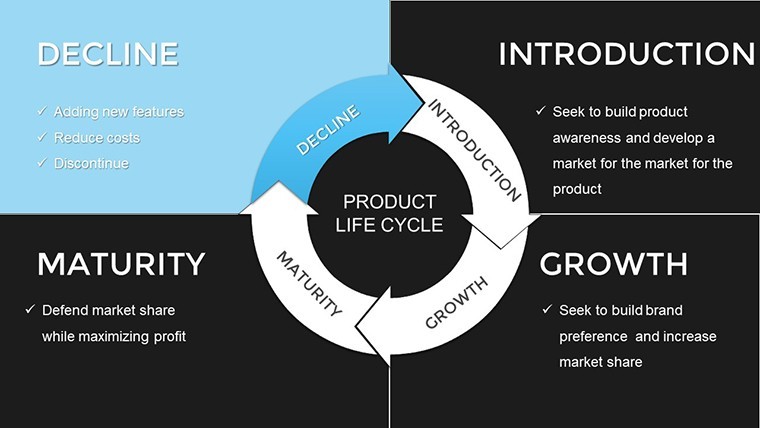
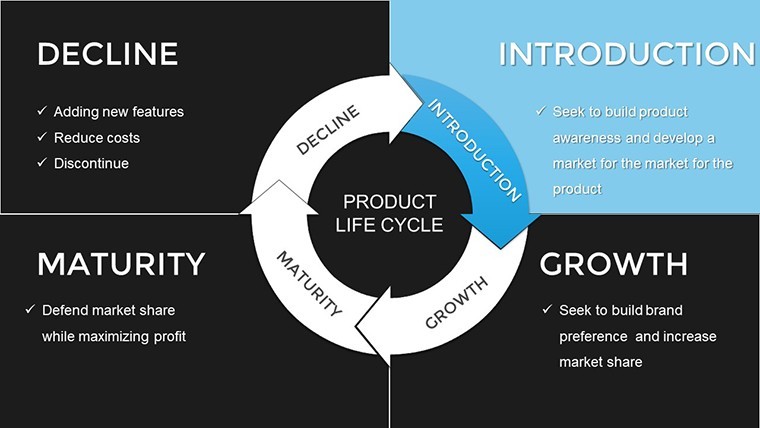
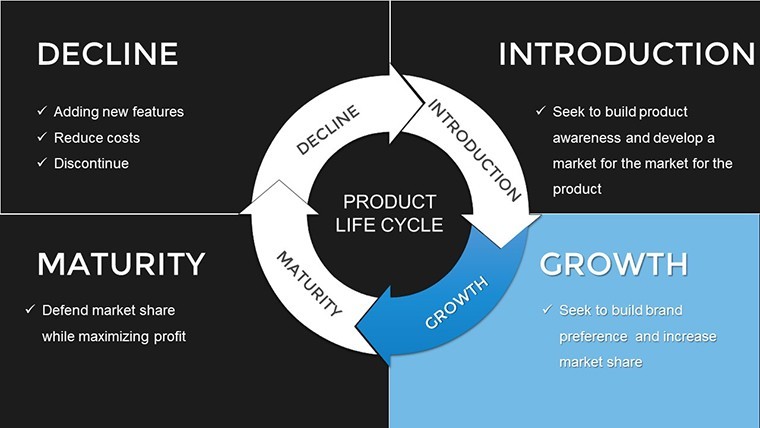
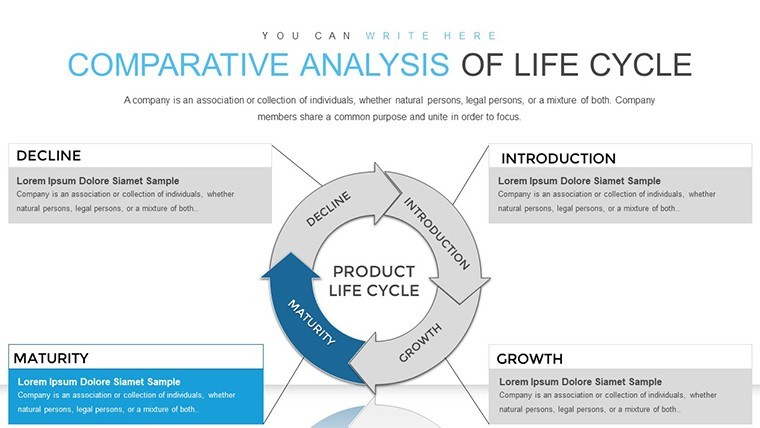
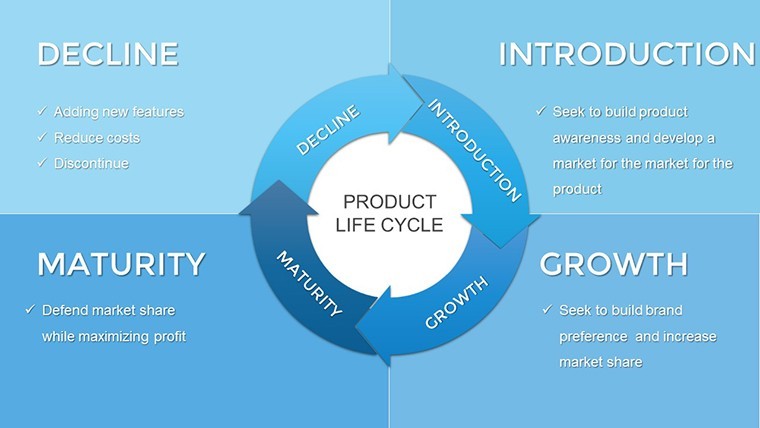
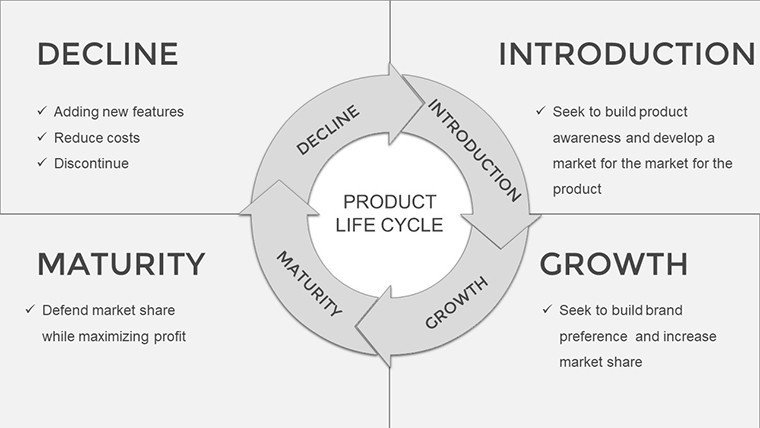
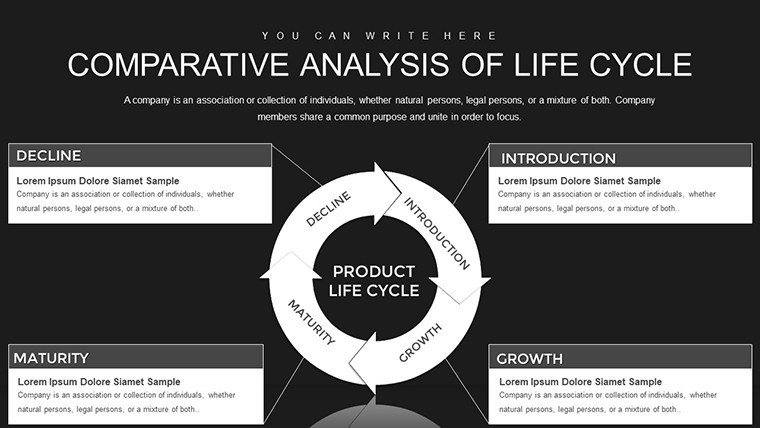
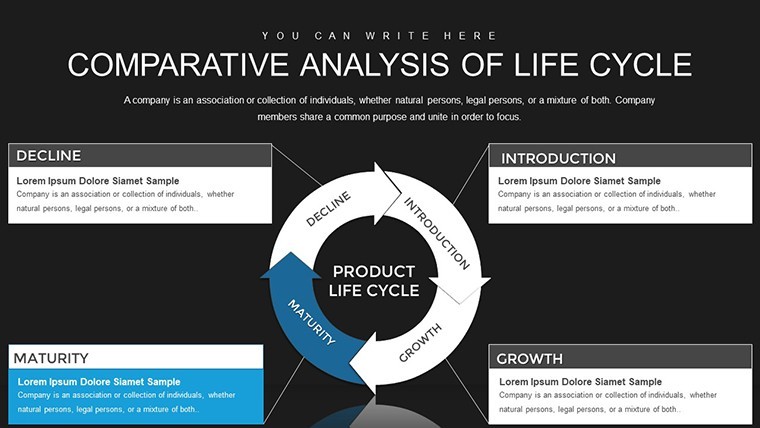
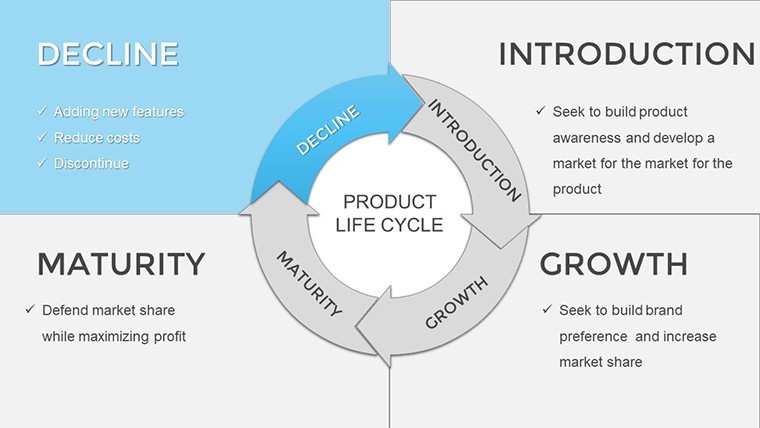
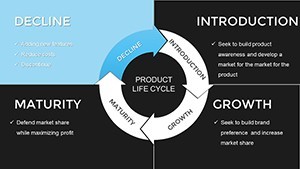
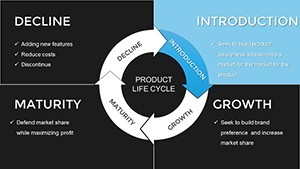
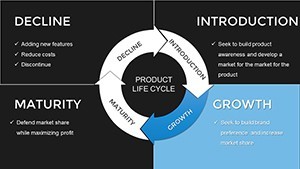
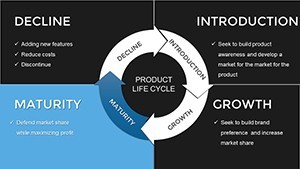
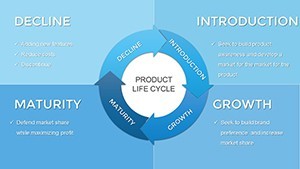
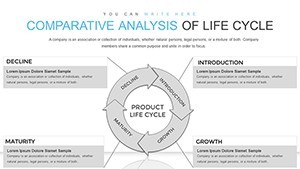
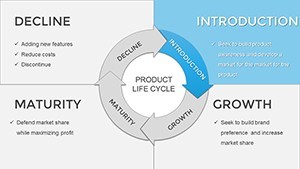
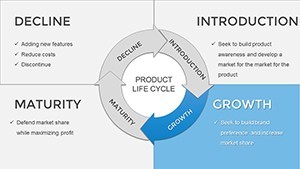
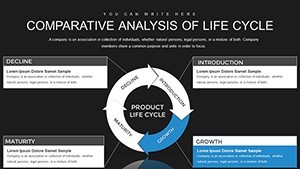
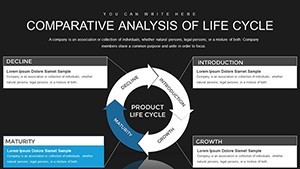
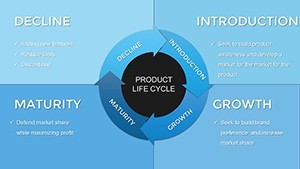
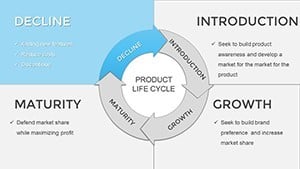
Life cycles in business mirror biological processes, with distinct phases demanding tailored management. This template delves into comparative analyses, using cycle diagrams and timelines to map out infancy, growth, maturity, and decline. Managers can use it to demonstrate how functions like planning and control shift - more hands-on in early stages, strategic in later ones. With 24 slides, it covers comprehensive overviews to granular comparisons, all editable for your context.
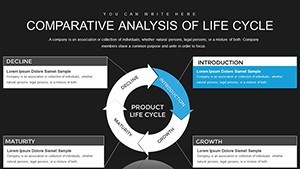
Standout Features for Managerial Insight
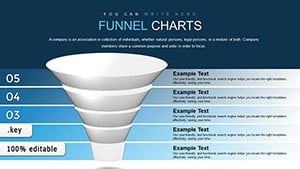
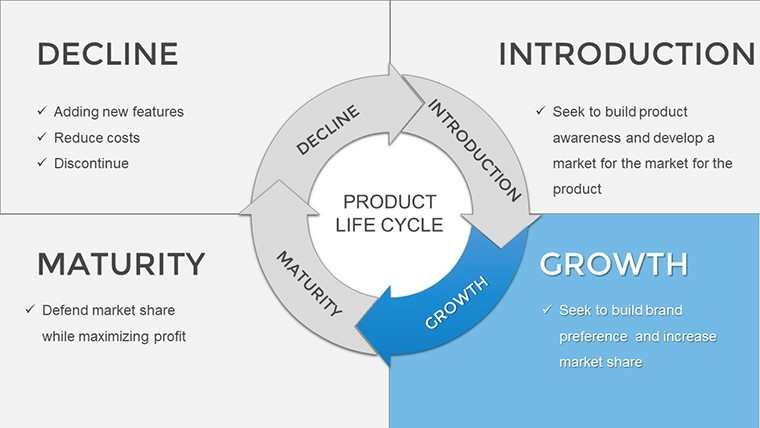
Each slide is built for impact, featuring widescreen layouts and full editability in text, colors, and shapes. Include cycle wheels for phase overviews, line charts for growth trajectories, and bar graphs for function comparisons. These elements incorporate best practices from management gurus like Ichak Adizes, ensuring authoritative visuals.
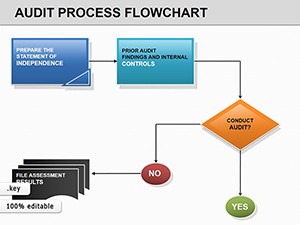
- Cycle Diagrams: Circular layouts to illustrate recurring phases seamlessly.
- Comparative Bars: Side-by-side views of management functions across stages.
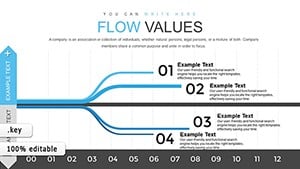
- Timeline Integrations: Linear progressions for historical or projected analyses.
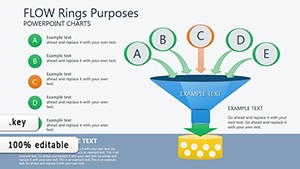
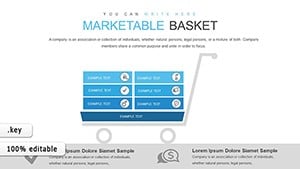
- Data Placeholders: Easy insertion of metrics like revenue growth or employee turnover.
This design promotes trustworthiness by focusing on data integrity, aligning with PMI (Project Management Institute) standards for clear reporting.
Practical Applications in Management Practice
Envision a mid-level manager reviewing team performance: Use cycle slides to pinpoint current phase and adjust strategies accordingly. Consultants might compare client life cycles against industry benchmarks, revealing opportunities for intervention. In academia, professors employ these for case studies, such as Kodak's decline versus Netflix's renewal. Real examples abound - a tech firm used similar visuals to navigate from startup chaos to structured growth, boosting efficiency by 30%. Unlike basic charts, this template offers depth for nuanced discussions, aiding in crisis avoidance and opportunity seizure.
Step-by-Step Customization for Your Needs
- Assess Your Cycle: Identify your organization's phase to select relevant slides.
- Add Specifics: Input data on functions like HR or finance adaptations.
- Visual Tweaks: Modify colors to denote phase transitions, enhancing readability.
- Enhance with Notes: Add speaker notes for deeper explanations during delivery.
- Finalize Review: Ensure logical flow from introduction to comparative insights.
This workflow integrates into tools like SWOT analyses, making it a versatile addition to your managerial toolkit.
Crafting Authoritative Business Narratives
Authority in management comes from insightful analysis, and this template delivers by enabling evidence-based presentations. Incorporate LSI elements like "business maturity models" naturally, appealing to search-savvy users. Reference studies from McKinsey on life cycle management to bolster claims, showing how proactive phase recognition leads to longevity. Managers report heightened team alignment post-use, as visuals make abstract evolutions concrete.
For enterprise leaders, customizing with company data turns generic cycles into personalized roadmaps, fostering strategic agility in volatile markets.
Visualizing Change for Better Outcomes
Visuals accelerate understanding; Gartner research indicates they improve decision speed by 20%. Here, comparative charts highlight function shifts, like delegation increasing in maturity, helping managers adapt leadership styles effectively.
Expert Tips for Life Cycle Mastery
- Combine with KPIs for quantifiable phase tracking.
- Use animations to reveal stage progressions dynamically.
- Integrate feedback mechanisms in slides for interactive sessions.
- Compare multiple cycles for industry benchmarking.
Inspired by thought leaders like Peter Drucker, these tips ensure your analyses are proactive and impactful.
Step up your management game with this template. Download now and chart a course for organizational excellence.
Frequently Asked Questions
How do life cycles differ across industries?
They vary by pace and emphasis, with tech cycles faster than manufacturing, but core phases remain similar.
Are the slides fully customizable?
Yes, edit everything from layouts to data in Keynote for tailored fits.
What management functions are covered?
Planning, organizing, leading, and controlling, shown evolving through phases.
Can I use this for training purposes?
Absolutely, it's ideal for workshops on organizational development.
Does it include comparative tools?
Yes, side-by-side charts for analyzing multiple cycles or functions.
How does it simplify complex processes?
Through visual breakdowns and hints that make stages accessible.