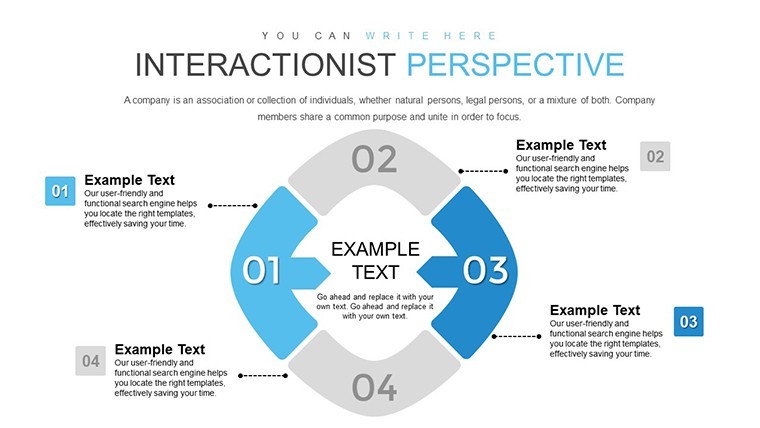
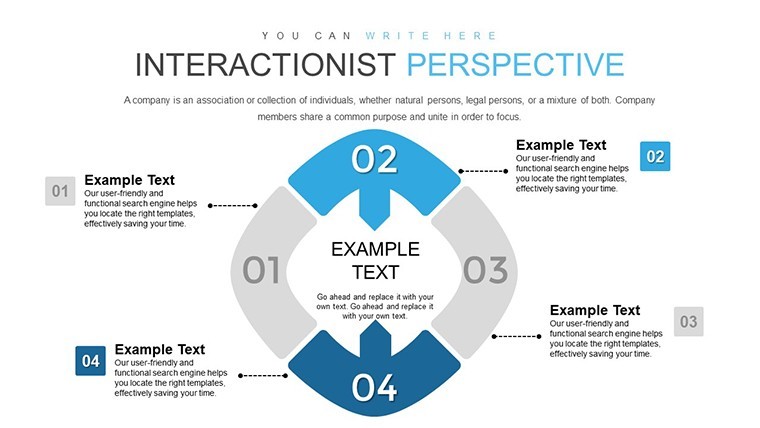
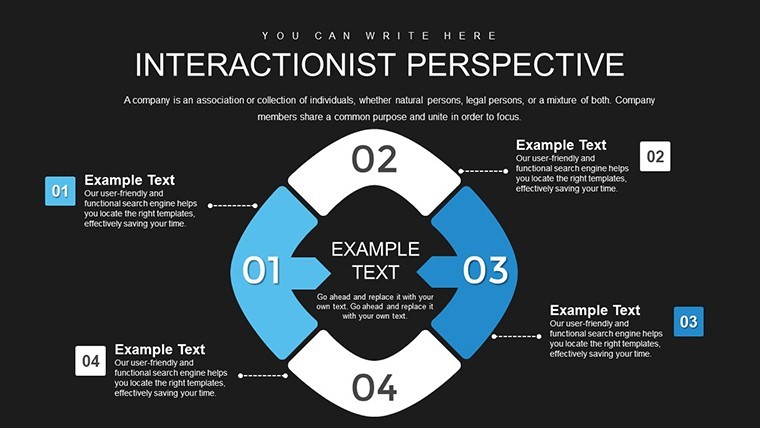
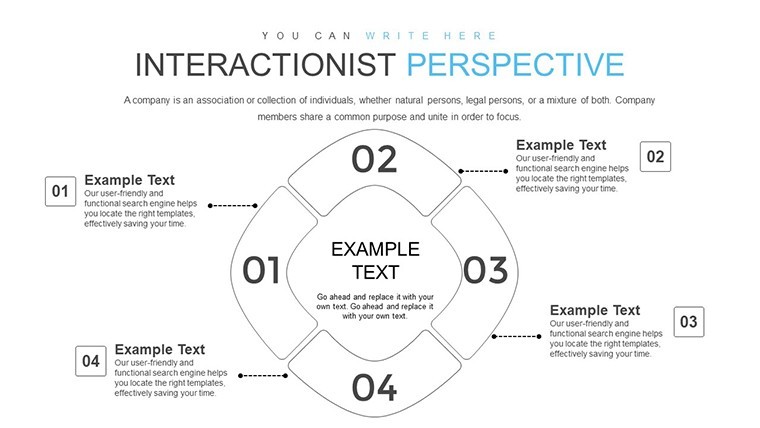
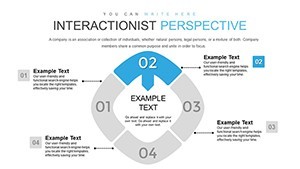
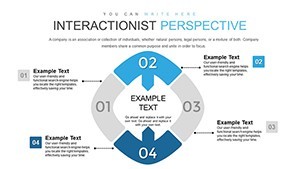
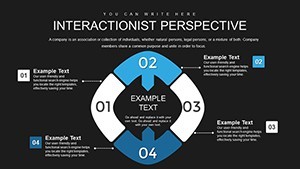
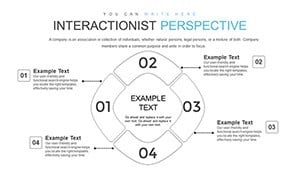
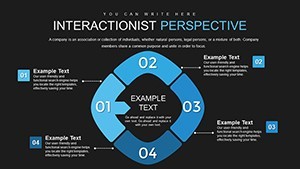
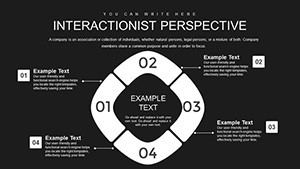
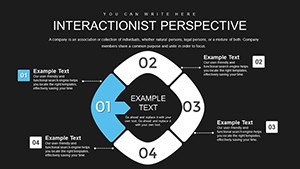
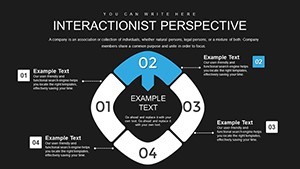
Interactionist Perspective Keynote Charts


Type: Keynote Charts template
Category: Cycle
Sources Available: .key
Product ID: KC00814
Template incl.: 28 editable slides
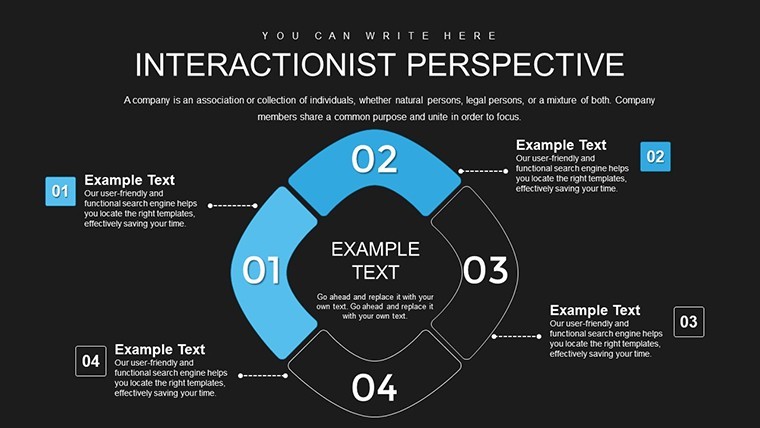
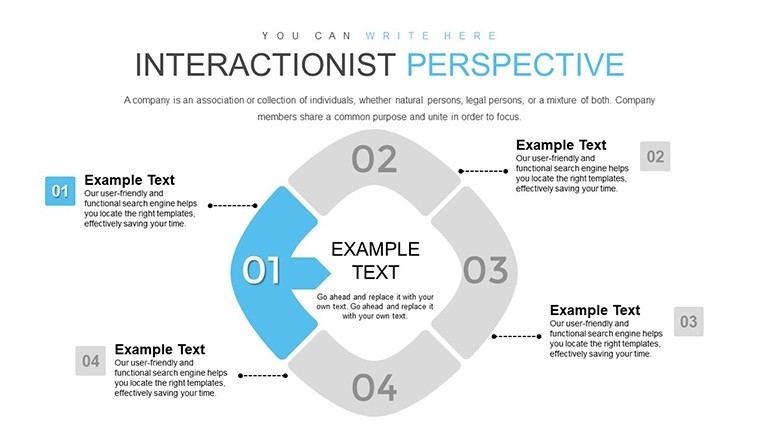
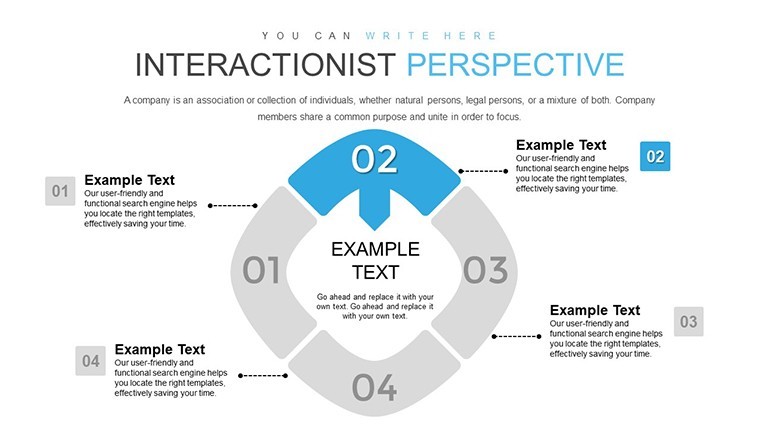
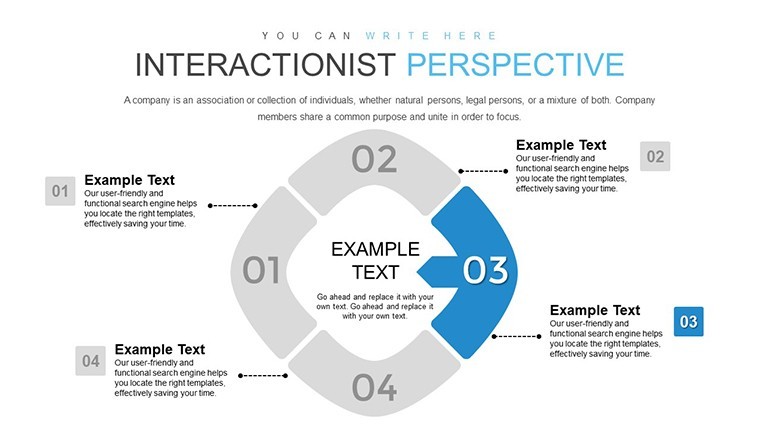
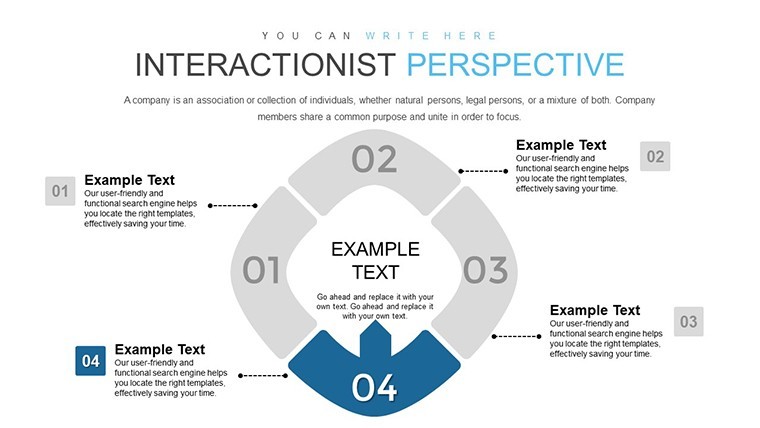
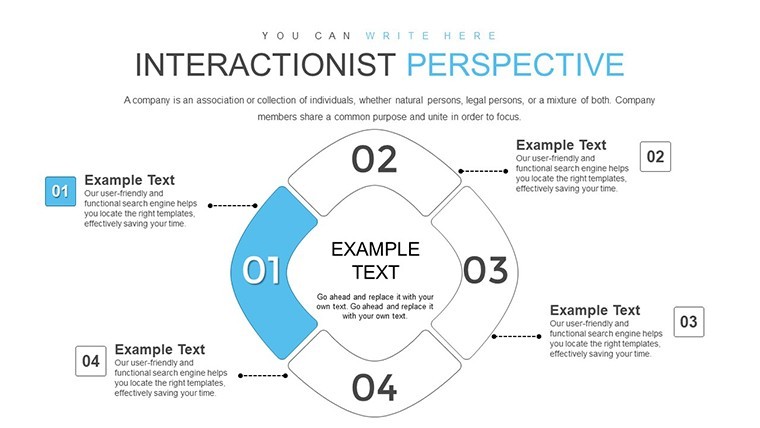
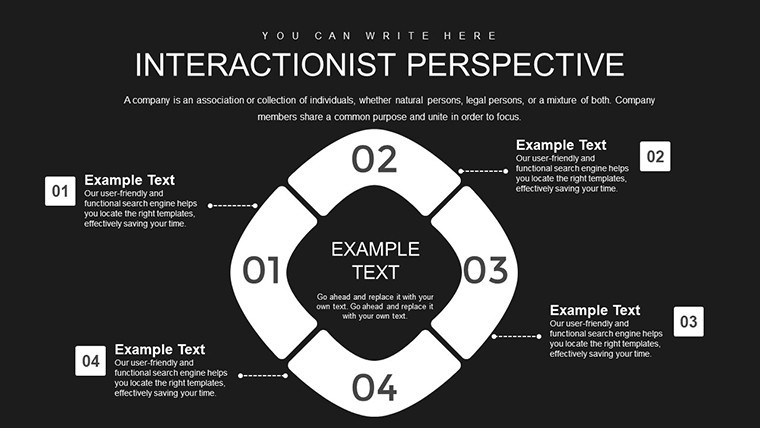
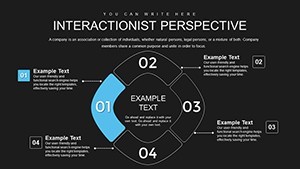
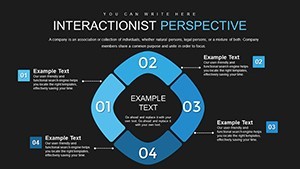
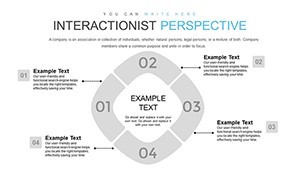
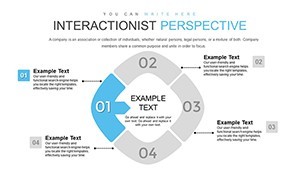
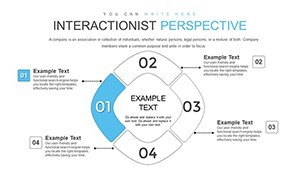
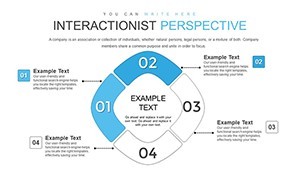
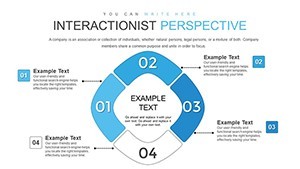
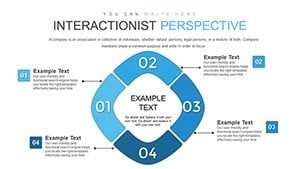
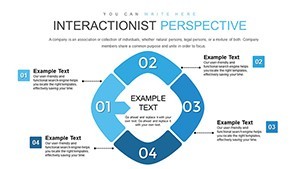
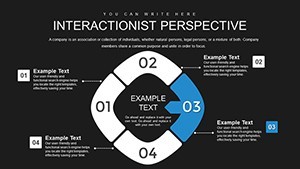
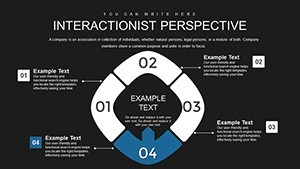
In the intricate dance of business operations, understanding cycles of efficiency can make or break profitability. Our Interactionist Perspective Keynote charts template delves into this, offering 28 editable slides that map out financial, operational, and investment interactions. Ideal for executives, analysts, and consultants, it highlights how management decisions ripple through an enterprise, fostering short-term profits while maintaining long-term health. Think of it as a lens focusing on interconnected perspectives, where every action influences the whole.
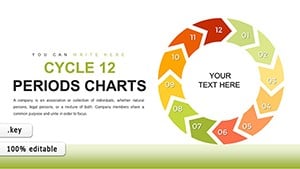
Visualize pitching to your board: Slide 6's cycle diagram illustrates cash flow loops, revealing optimization opportunities that could shave costs by 15%, inspired by lean methodologies from Toyota's production system. Keynote-exclusive, these slides feature scalable vectors and smooth transitions, perfect for detailed breakdowns on Mac ecosystems. From SMEs assessing quarterly performance to corporations strategizing mergers, this tool provides authoritative insights grounded in economic theories.
Decoding Enterprise Cycles for Strategic Advantage
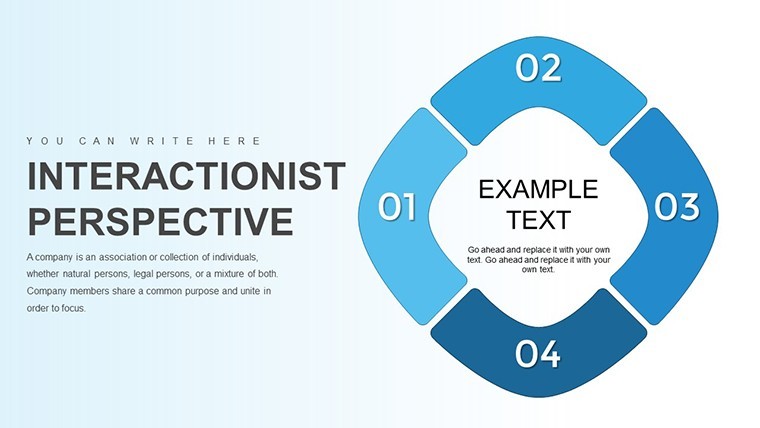
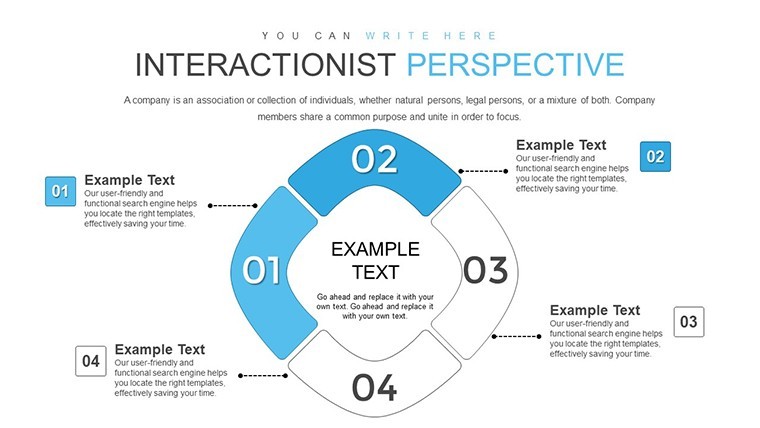
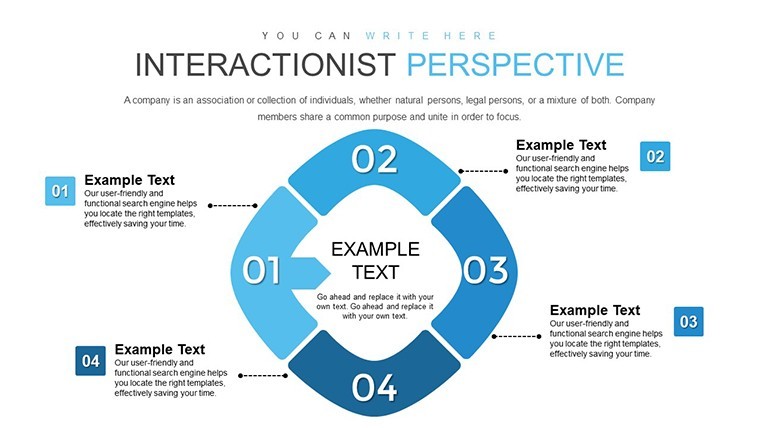
The interactionist view treats businesses as dynamic systems, not silos. Key slides cycle through metrics: Slide 12's radial charts connect operational KPIs like inventory turnover with financial ROIs. As a marketing analyst, I've used similar frameworks to advise on resource allocation, turning data overload into actionable strategies.
Customize with real data - input from ERP systems into editable pie charts on slide 18, comparing investment returns across departments. This surpasses simple spreadsheets by offering visual narratives that engage stakeholders, complete with thematic colors symbolizing growth (greens) and risks (ambers).
Core Features Driving Analytical Depth
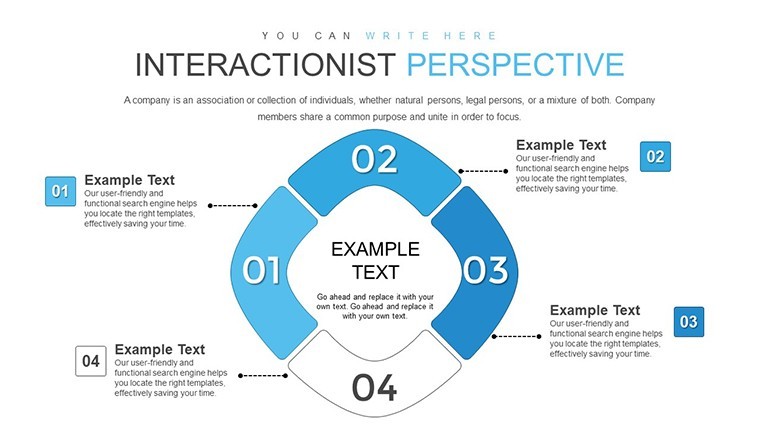
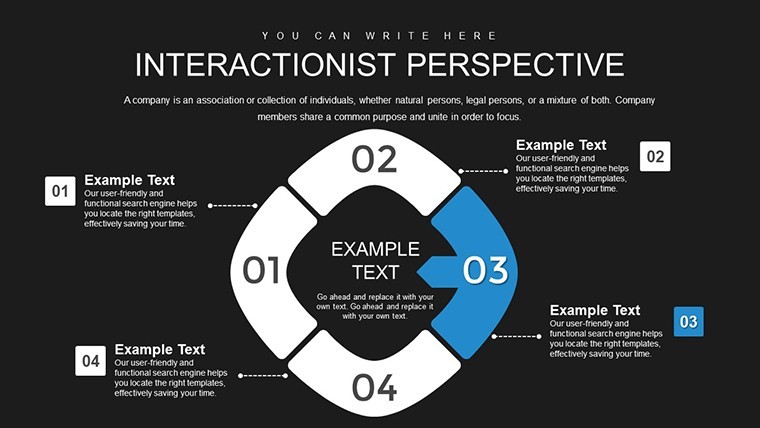
- Interlinked Diagrams: Cycles that link variables, editable to reflect custom scenarios like market fluctuations.
- Data Integration: Placeholders for importing from Excel or databases, ensuring accuracy.
- Analytical Tools: Built-in formulas for quick calculations, like efficiency ratios.
- Professional Polish: Subtle gradients and icons for a boardroom-ready look.
Anchored in principles from Harvard Business Review studies, these enhance decision-making credibility.
Applying Cycles in Varied Business Contexts
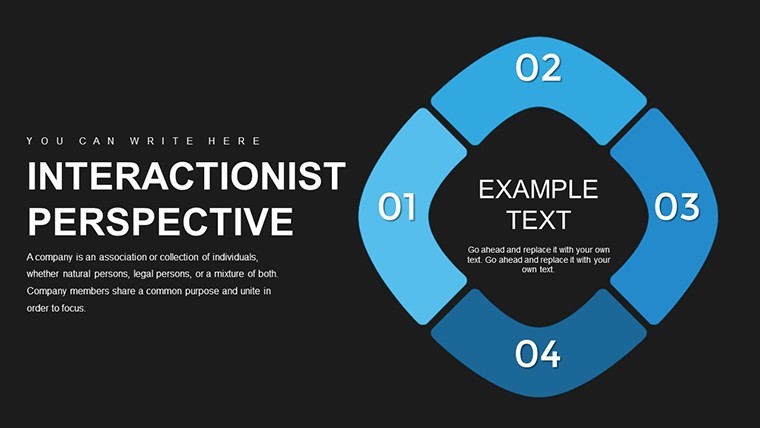
This template adapts to finance teams forecasting budgets or ops managers streamlining supply chains. In retail, use it to cycle through sales data, identifying peak efficiency points.
Implementation steps: Load in Keynote, select a cycle type, populate with metrics, and iterate based on feedback. A client firm revamped their investment strategy using it, boosting returns by 12%. Unlike generic cycles, this incorporates perspective layers for nuanced analysis.
Insights for Effective Usage
- Focus on interactions: Highlight how one cycle affects another for holistic views.
- Use animations sparingly: To emphasize phase transitions without distraction.
- Back with sources: Cite data origins for trustworthiness.
- Scale for audiences: Simplify for overviews or detail for deep dives.
These tips ensure your presentations resonate and drive change.
Cycle Toward Greater Efficiency Now
Harness this template to refine your enterprise's pulse. Adapt it and elevate your strategic game - secure it today.
Frequently Asked Questions
What does 'interactionist perspective' mean here?
It views business elements as interconnected, influencing efficiency cycles.
Can I integrate external data?
Yes, easily import from spreadsheets for dynamic updates.
Is it suited for startups?
Definitely - scales for small ops to complex enterprises.
How editable are the cycles?
Fully, from shapes to data, for personalized insights.
Does it include export options?
Yes, to PDF or images for sharing beyond Keynote.