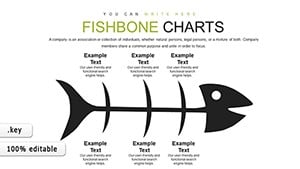
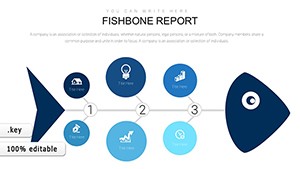
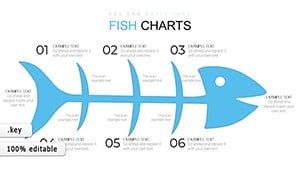
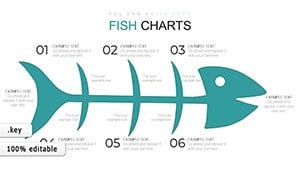
Cause and Effect Tree Keynote Charts


Type: Keynote Charts template
Category: Business Models
Sources Available: .key
Product ID: KC00800
Template incl.: 38 editable slides
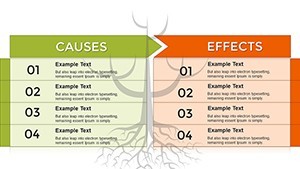
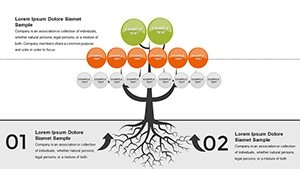
Delve into the intricacies of problem-solving with our Cause and Effect Tree Keynote charts template, a robust tool for dissecting issues and uncovering root causes. Tailored for business analysts, quality managers, and product developers, this template features 38 editable slides that map out relationships in a tree-like structure, simplifying complex diagnostics. Envision tracing manufacturing defects back to material flaws or process errors, with branches extending to reveal interconnected factors. This approach, inspired by lean manufacturing principles, prevents recurring problems and fosters innovation. Whether in product development or strategic planning, it turns chaotic data into organized insights, empowering teams to make informed decisions. Say goodbye to superficial fixes and hello to systemic improvements that enhance efficiency and quality.
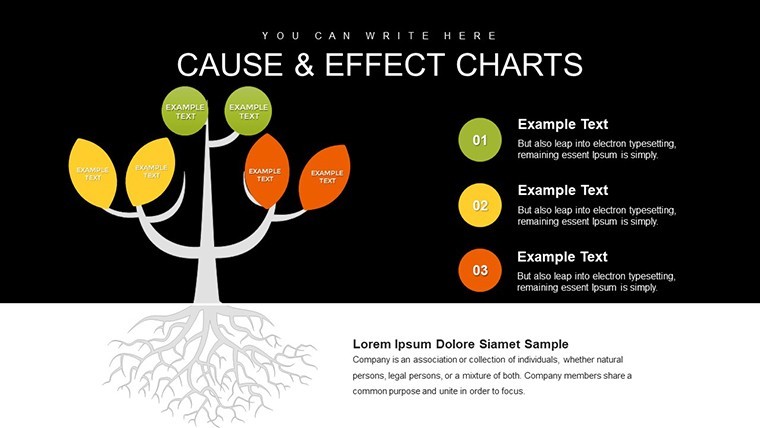
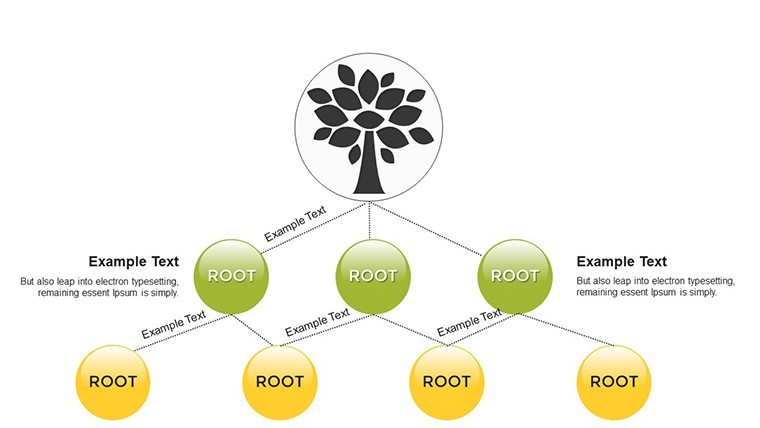
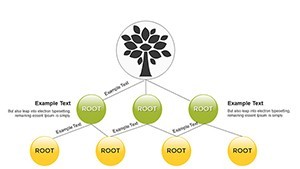
The Essence of Cause and Effect Trees in Business
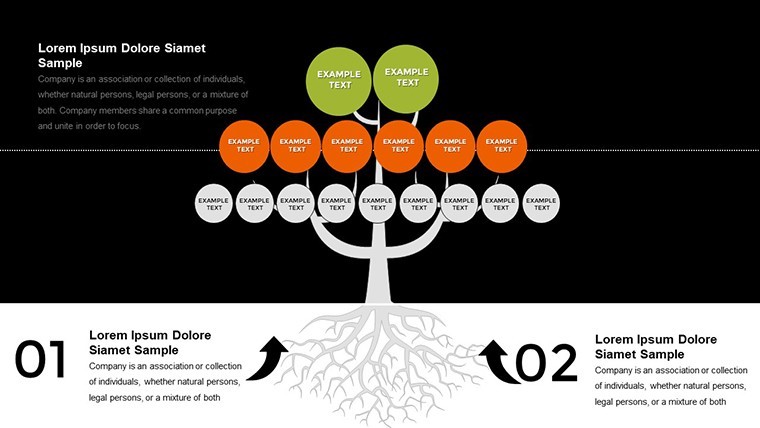
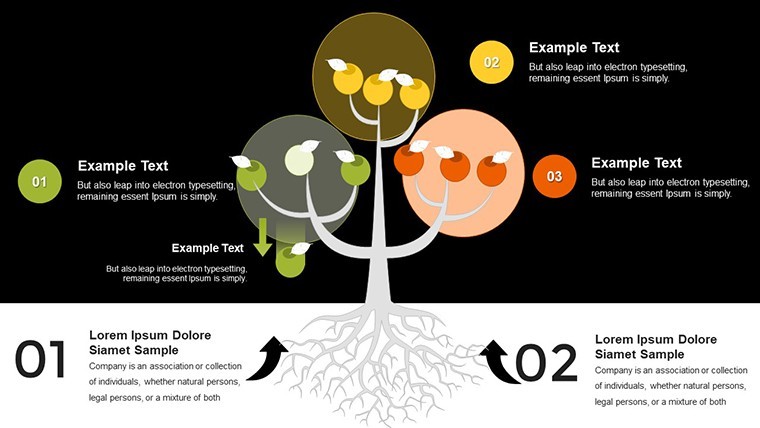
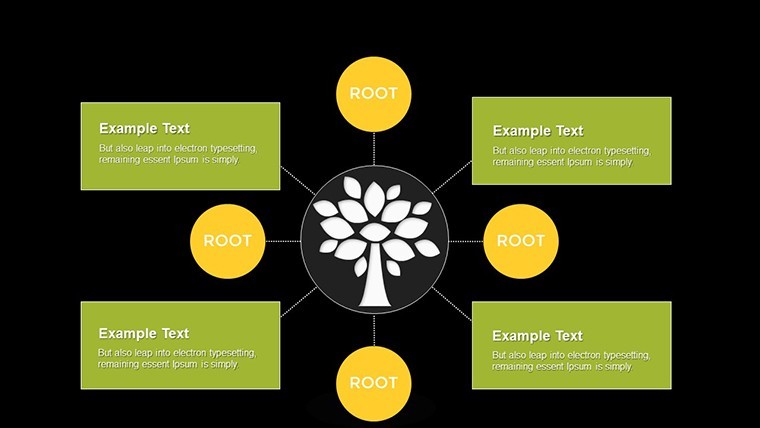
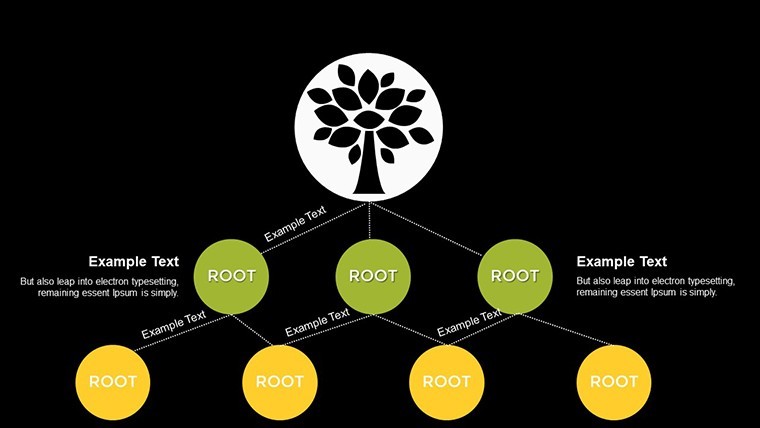
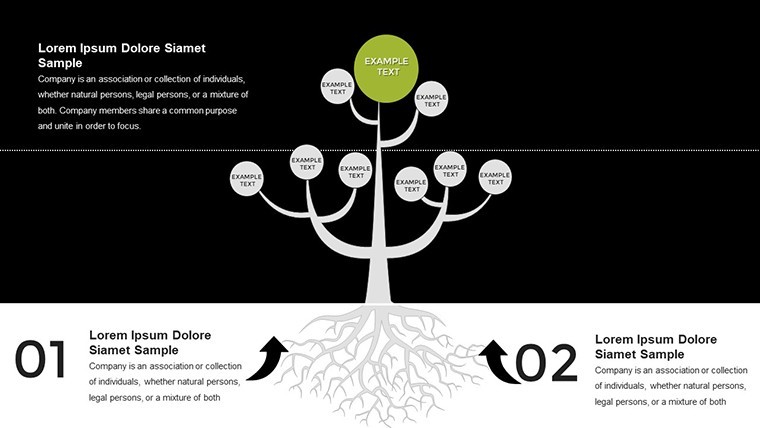
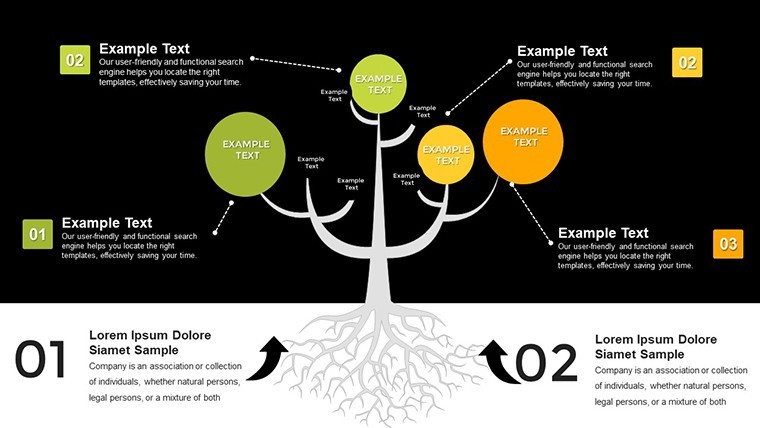
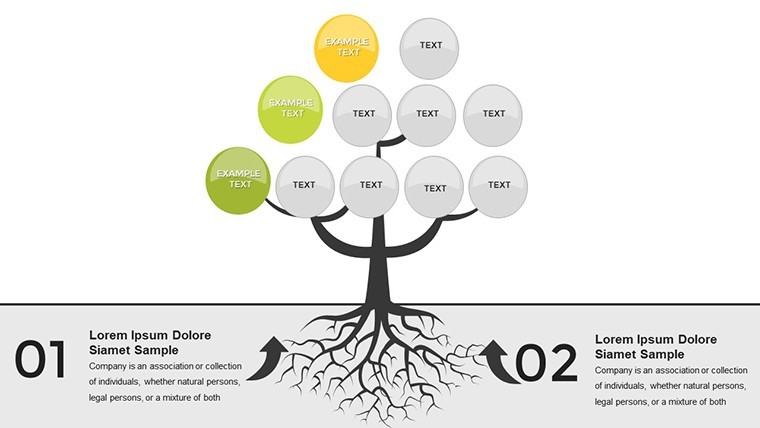
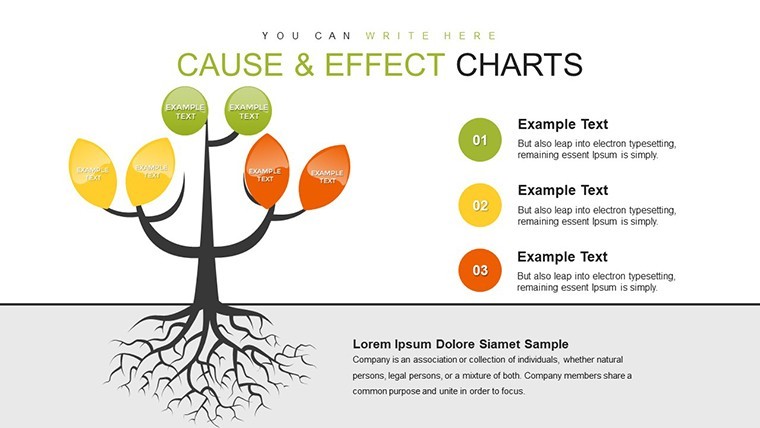
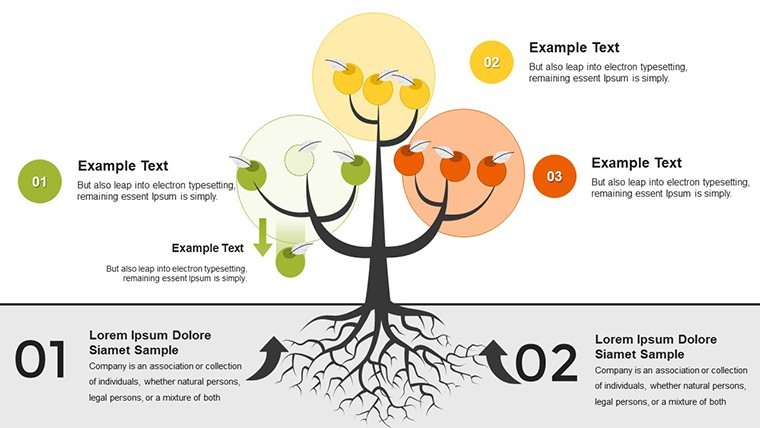
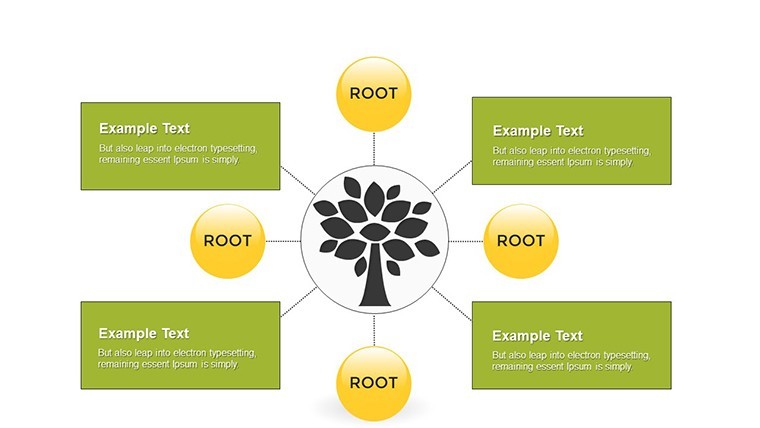
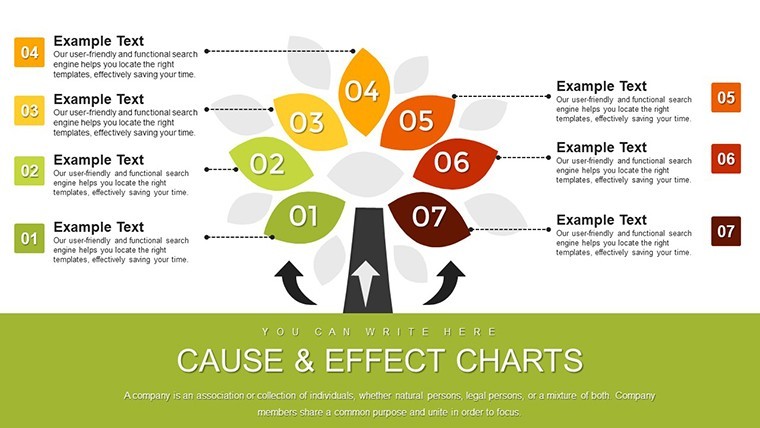
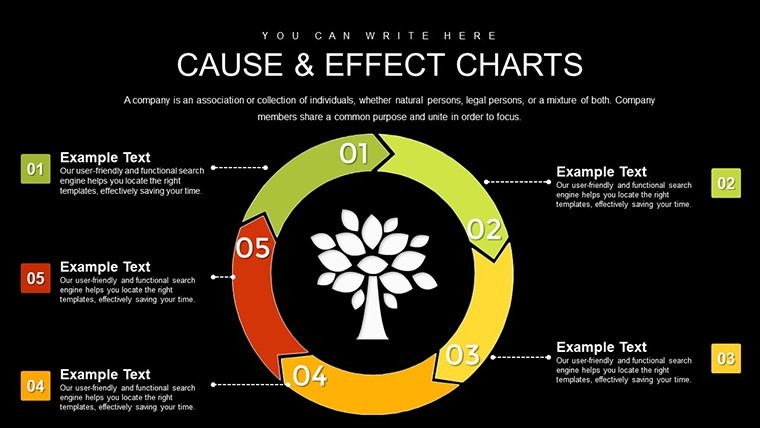
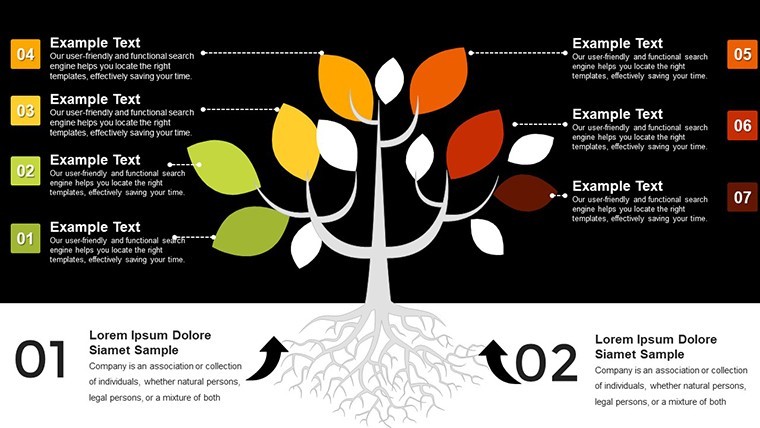
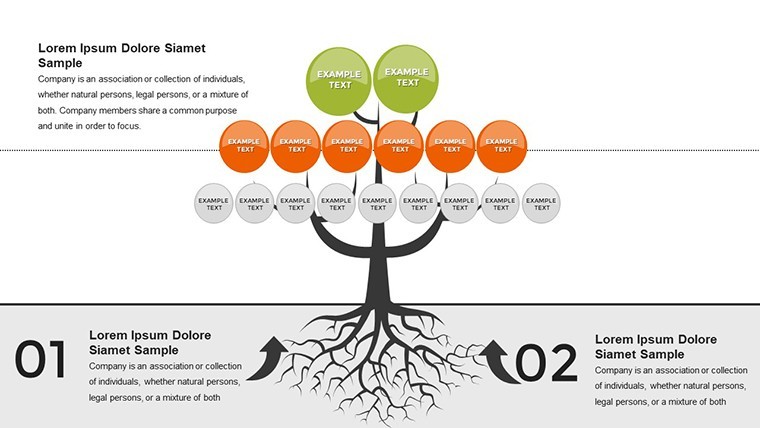
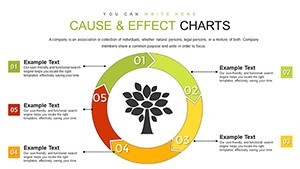
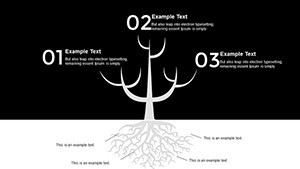
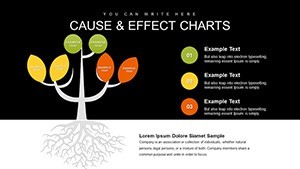
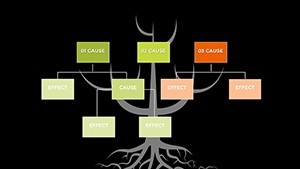
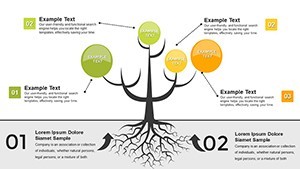
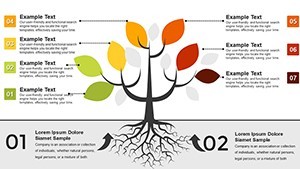
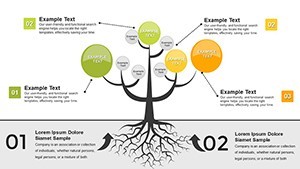
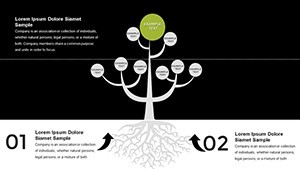
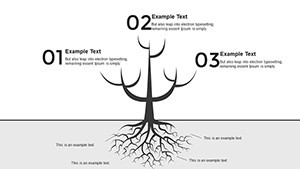
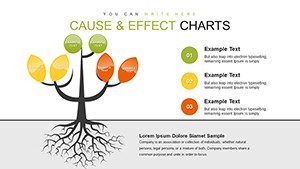
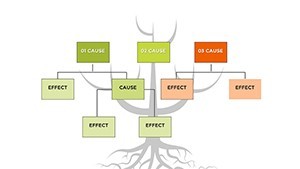
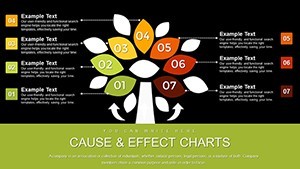
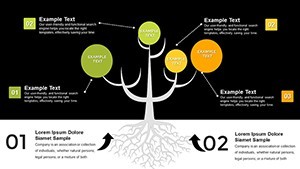
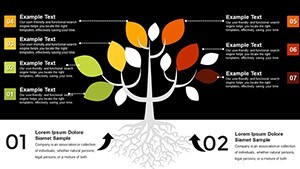
At its core, the Cause and Effect Tree excels in visualizing hierarchies of factors leading to outcomes. In quality control, akin to Six Sigma methodologies, it identifies variables impacting product excellence. For new product launches, branches can outline design influences, ensuring all angles are covered. With 38 slides, you have ample variety - from simple binary trees to multifaceted networks - all editable for precision. Compatibility with Keynote ensures seamless integration into your workflow, supporting collaborative edits. This template's strength lies in its ability to organize knowledge, making it indispensable for industries where understanding causality is key to success.
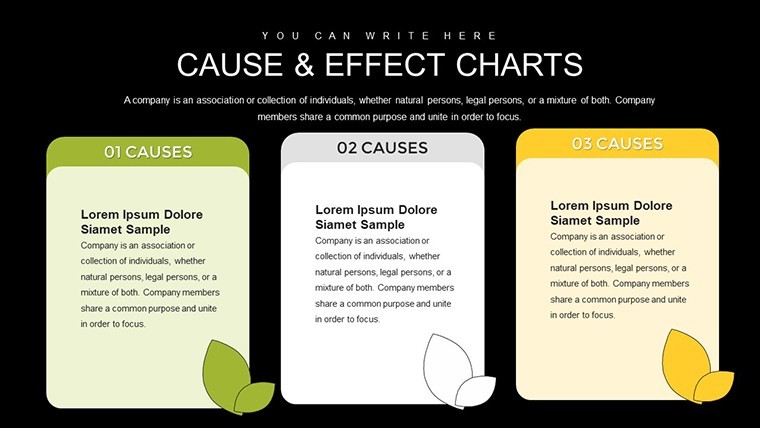
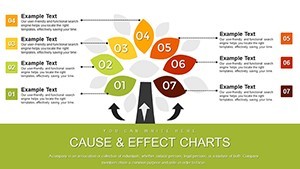
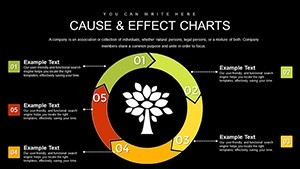
Essential Features for In-Depth Analysis
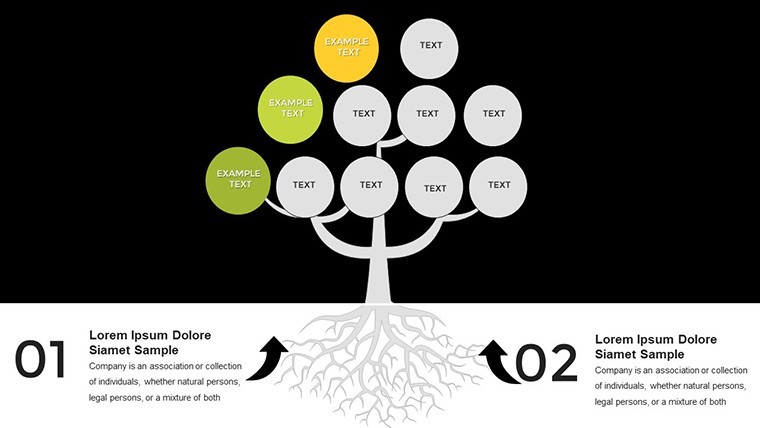
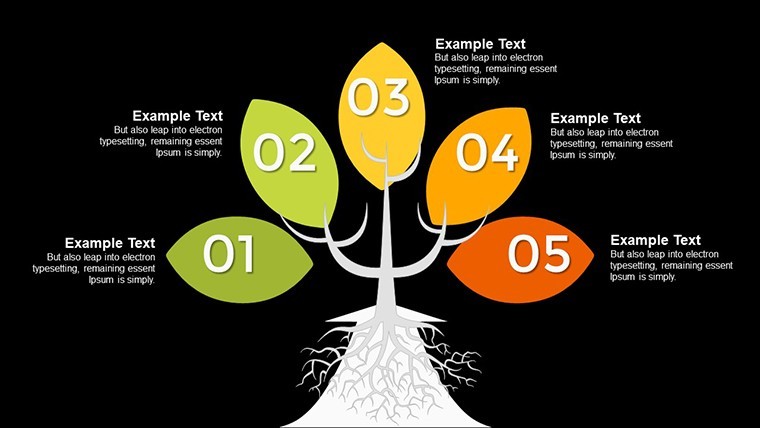
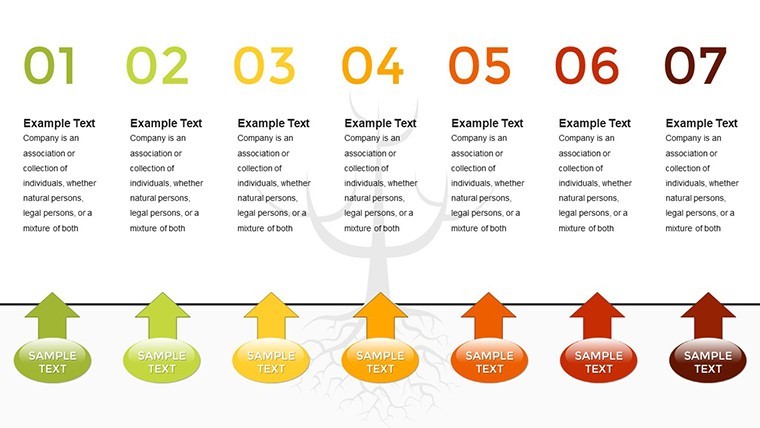
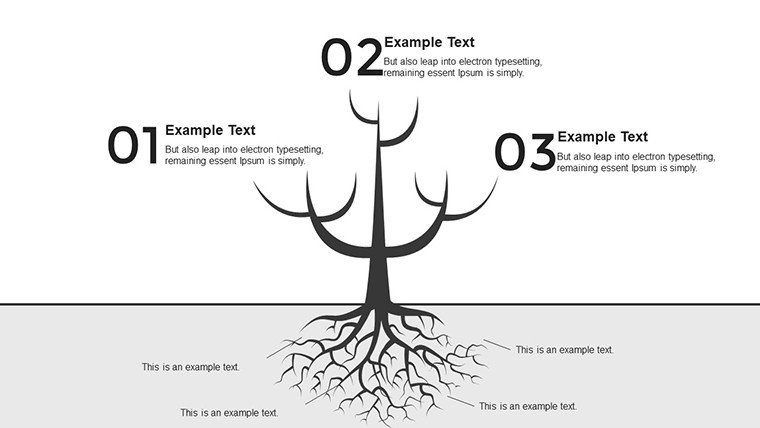
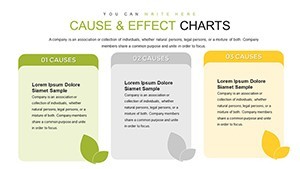
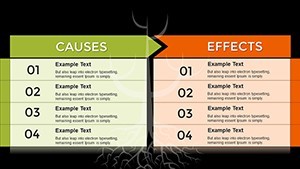
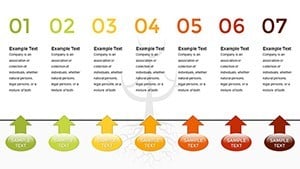
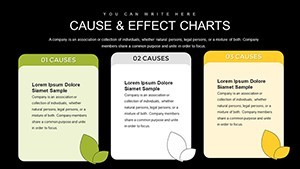
- Extensive Slide Variety: 38 layouts covering basic to advanced tree structures for thorough explorations.
- Editable Branches and Nodes: Customize labels, colors, and connections to reflect specific scenarios.
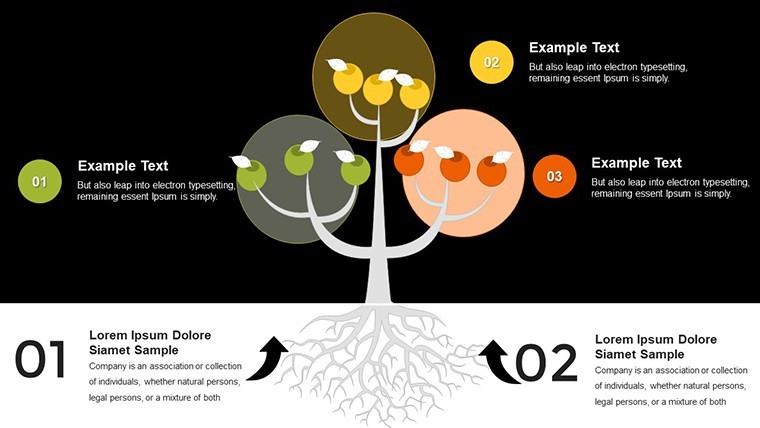
- Integrated Visual Aids: Icons and shapes enhance clarity, drawing from business model canvases.
- Data Import Capabilities: Link to external sources for real-time updates.
- Professional Styling: Clean, modern designs that align with corporate standards.
These elements combine to provide a comprehensive platform for diagnostic work.
Applying Trees to Real Business Challenges
In practice, this template transforms abstract problems into actionable plans. For instance, in automotive manufacturing, use it to analyze assembly line delays, branching from main causes like supplier issues to sub-factors such as logistics. A case from Toyota's lean practices shows how similar diagrams reduced defects by 40%. In software development, map bug origins, from code errors to user interface flaws. Healthcare professionals can trace patient outcome variances, improving protocols. The template's versatility extends to education, where teachers diagram historical events' causes. By focusing on manageable factors, it promotes proactive management, turning potential crises into opportunities for growth.
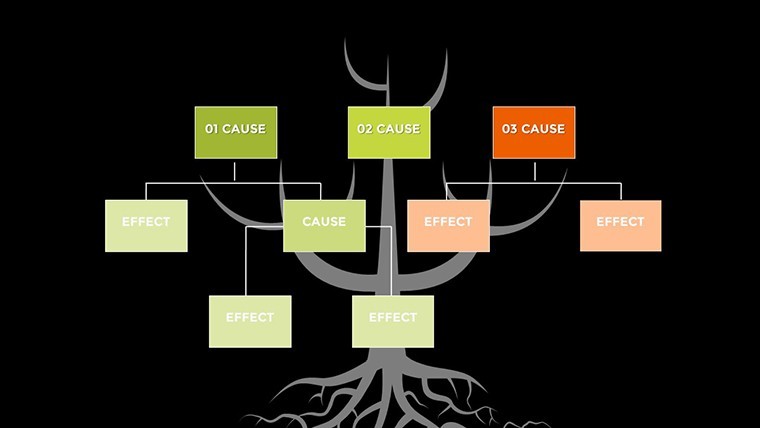
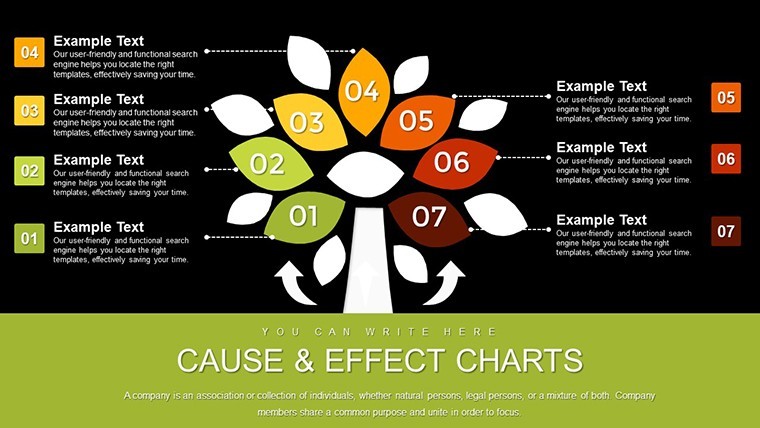
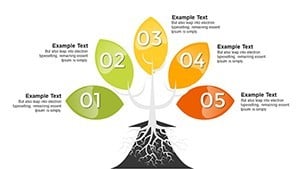
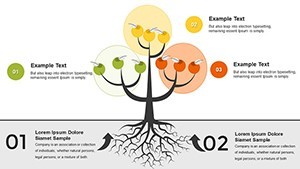
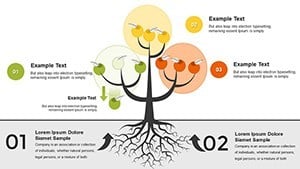
Building Your Tree: Step-by-Step
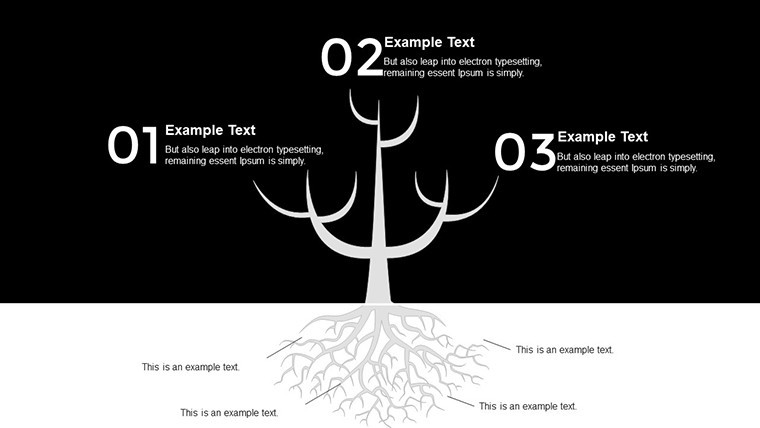
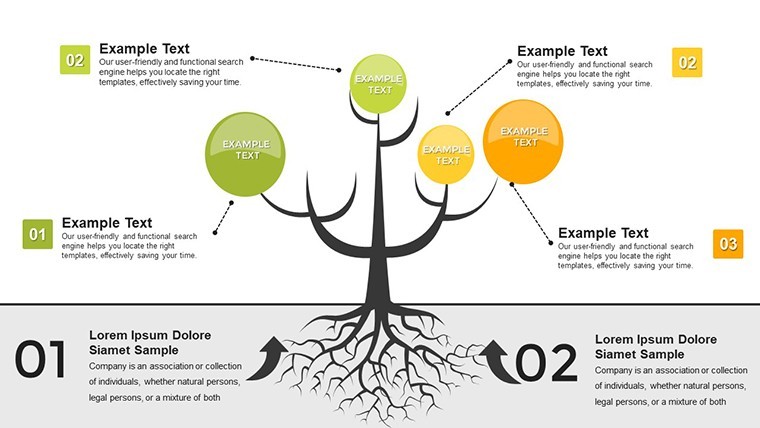
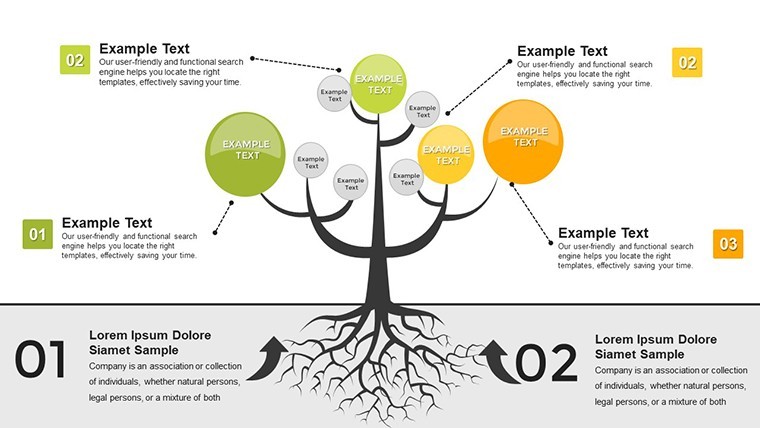
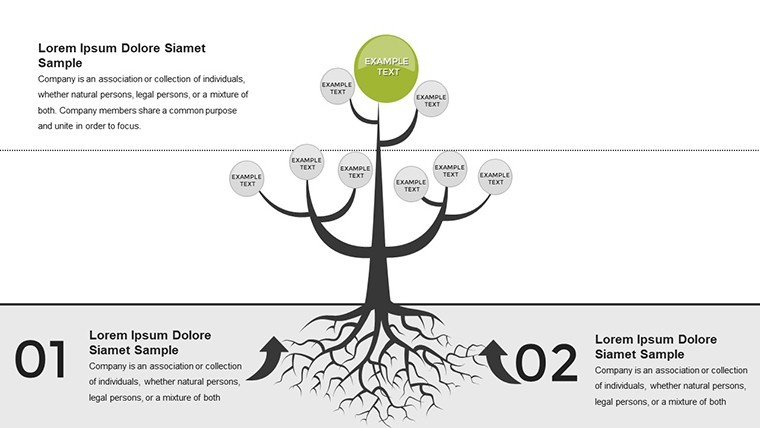
- Open the template and choose a base tree slide.
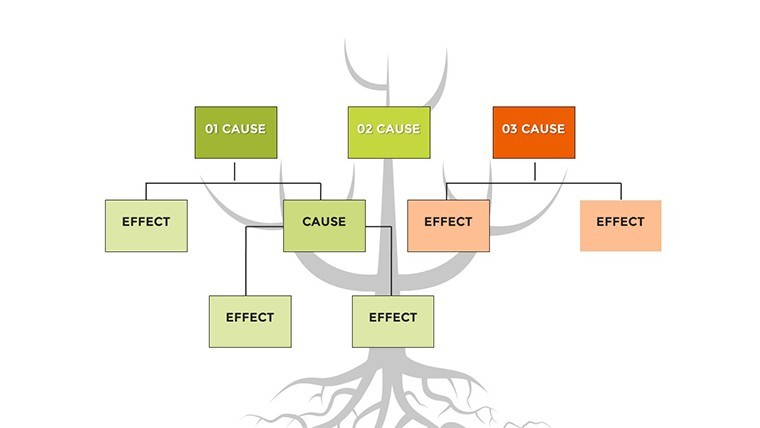
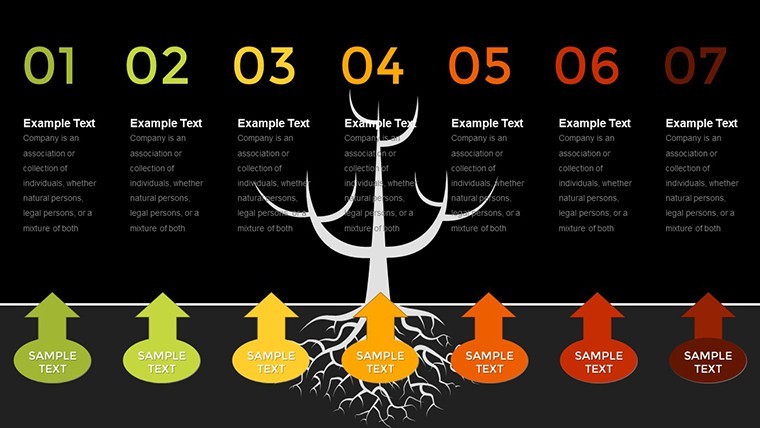
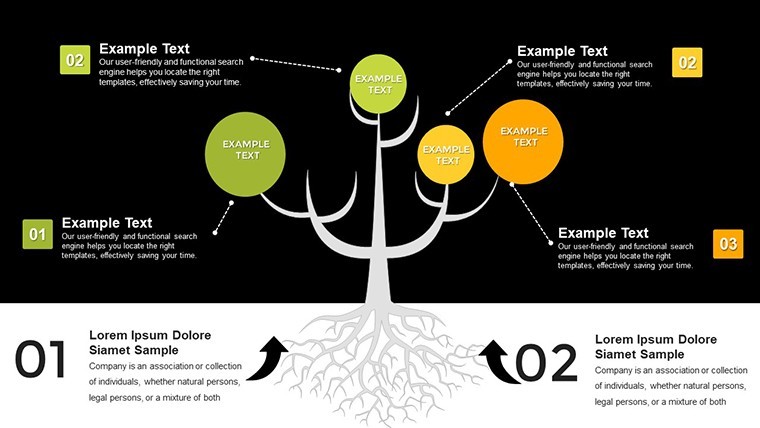
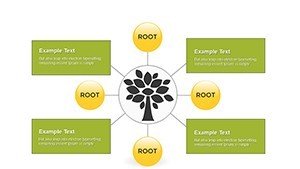
- Define the core effect at the trunk, then add branches for primary causes.
- Extend sub-branches for deeper factors, using text boxes for details.
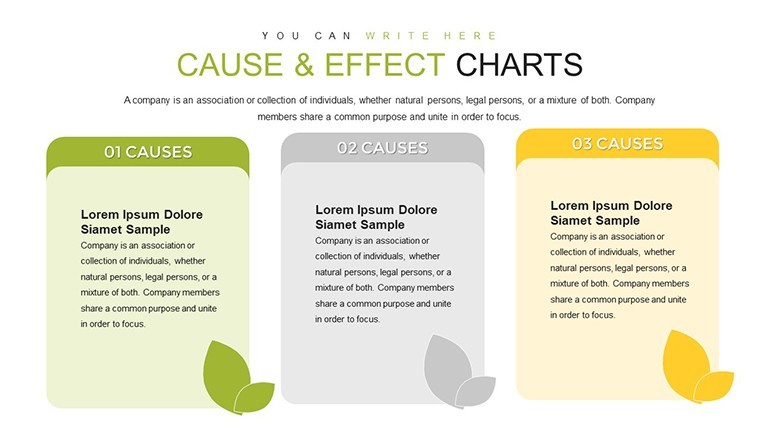
- Color-code for prioritization - red for critical, green for resolved.
- Incorporate data visuals like charts on leaves.
- Review and iterate with team input for accuracy.
This methodical process ensures robust, reliable trees.
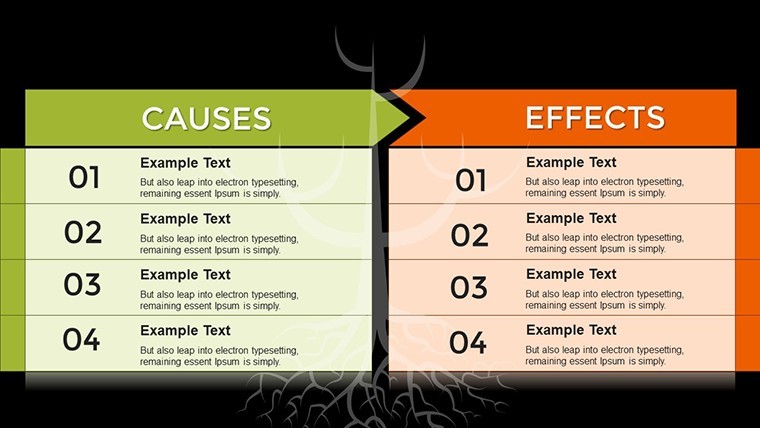
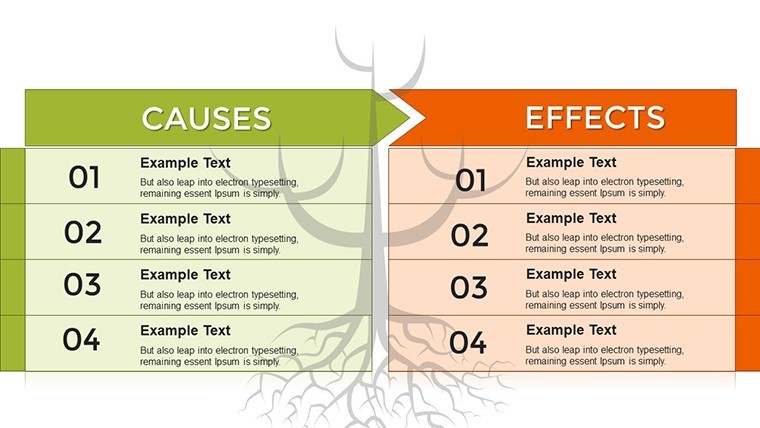
Superiority to Linear Cause-Effect Models
Unlike straightforward lists, tree structures reveal nonlinear relationships, essential for complex systems. Basic Keynote diagrams lack this branching depth, often oversimplifying. Our template includes pre-designed hierarchies, saving setup time. Users experience better team alignment, as visual trees facilitate discussions. Drawing from authoritative sources like the American Society for Quality (ASQ), it upholds standards for root cause analysis. For example, in a supply chain audit, trees uncovered hidden inefficiencies that linear models missed, leading to cost savings.
Advanced Strategies for Tree Utilization
To optimize, integrate quantitative data - assign probabilities to branches for risk assessment. Use layering for multi-level views, zooming into specifics. In group sessions, leverage Keynote's annotation for real-time feedback. A real-world application: A consulting firm used trees to streamline client operations, boosting efficiency by 25%. Balance tree complexity to avoid overload, adhering to information design best practices. These tactics, informed by expert methodologies, amplify the template's value.
Embrace the Cause and Effect Tree template to root out problems effectively. Secure your copy now and branch out towards better business outcomes.
Frequently Asked Questions
- What industries benefit most from this template? Primarily manufacturing, quality management, and product development, but adaptable to any analytical field.
- How customizable are the tree elements? Completely - edit branches, nodes, and visuals to suit your needs.
- Does it support team collaboration? Yes, via Keynote's sharing features for joint editing.
- Can I integrate external data? Absolutely, import from Excel or other tools.
- Is it based on standard methodologies? Yes, aligned with lean and Six Sigma principles.
- What if my tree gets too complex? Use slide variations to break it into manageable sections.