Fishbone Keynote Charts - Fully Editable | ImagineLayout


Type: Keynote Charts template
Category: Relationship, Business Models
Sources Available: .key
Product ID: KC00799
Template incl.: 22 editable slides
Files and Formats Included
22 editable slides arrive in one .key file.
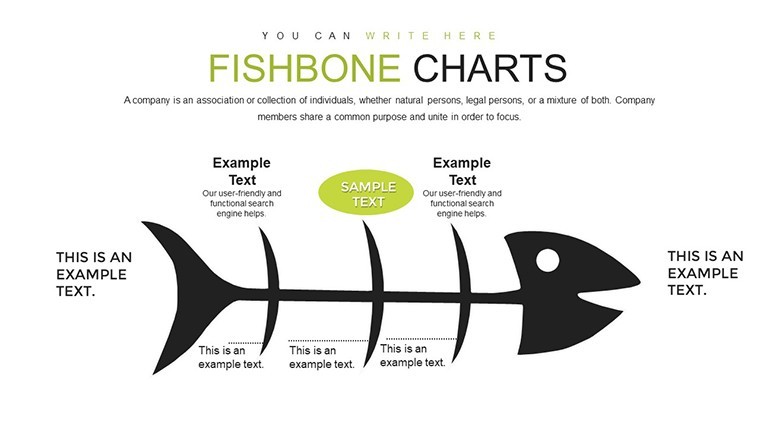
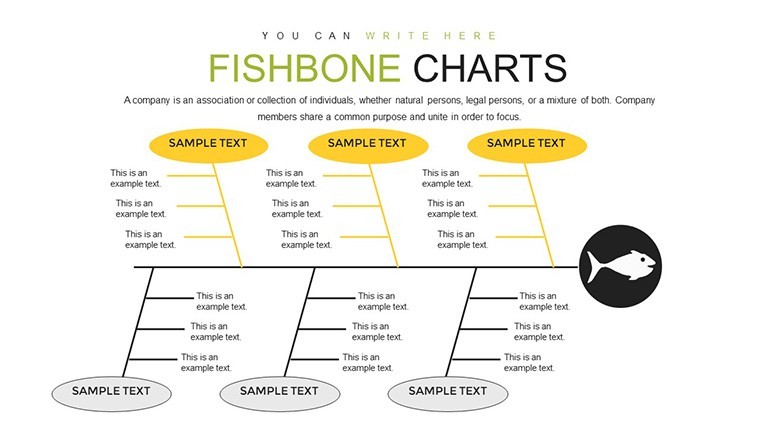
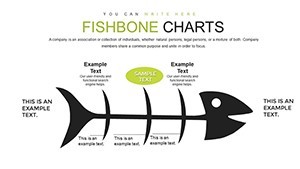
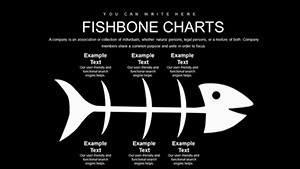
Animated bone reveals and category branches for people processes materials cover the package.
File formats stay Keynote only.
Technical Specs
| Feature | Details |
|---|---|
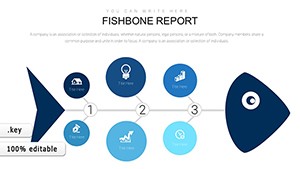
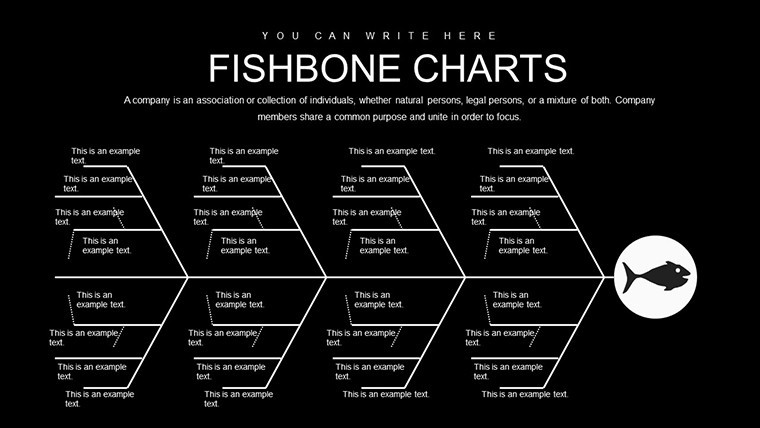
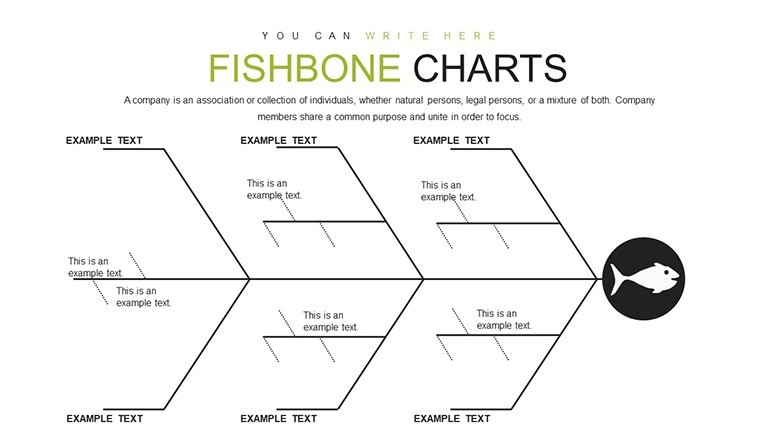
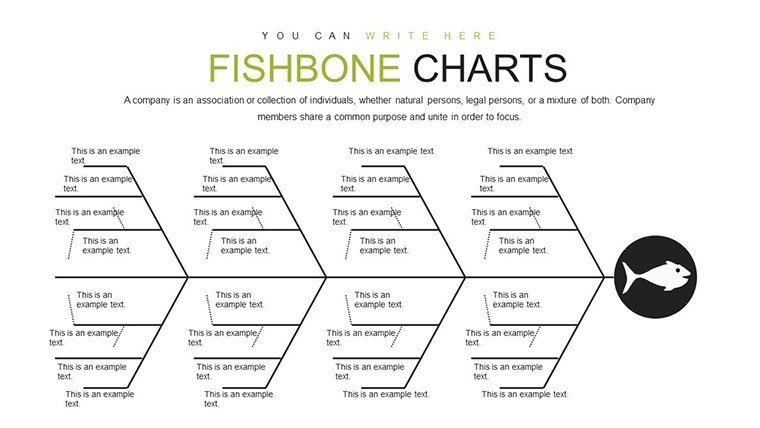
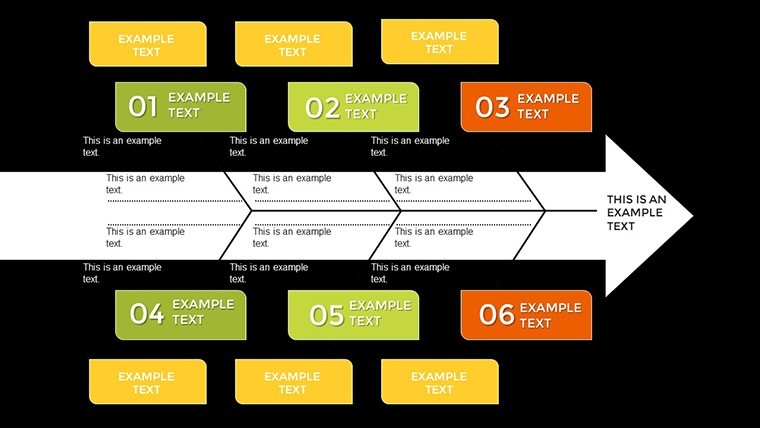
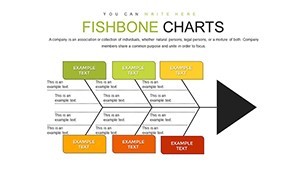
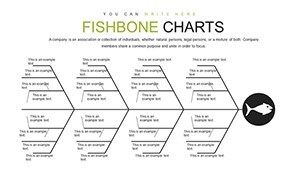
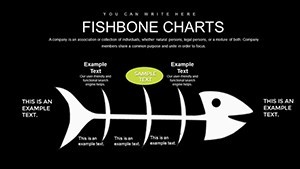
| Slides included | 22 editable slides built around fishbone root cause structure |
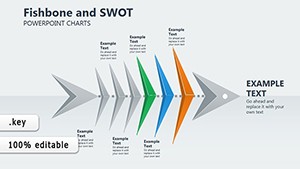
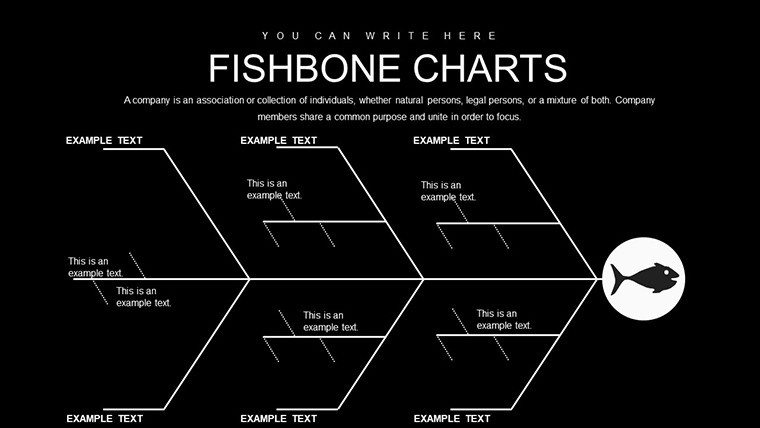
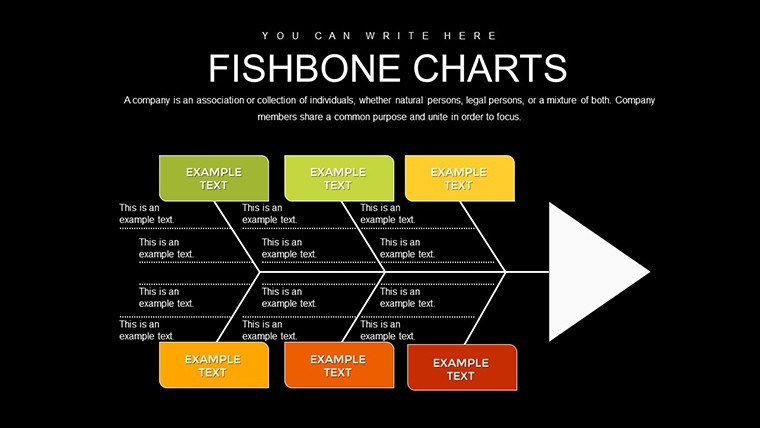
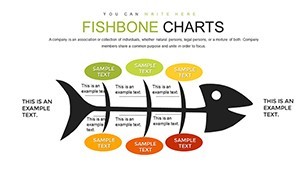
| Editable elements | bone branches resize and recolor independently |
| Text placeholders | labels edit without unlocking grouped elements |
| Color theme adjustments | compatible with Keynote slide master color palette |
| Diagram connectors | category lines adjust direction and weight |
| Export options | Keynote for editing plus PDF for distribution |
| Aspect ratio | standard 16:9 across all slides |
Customization in 5 Steps
1. Open the .key file in Keynote 12 or later (1 minute).
2. Replace placeholder text on bone branches (3 minutes).
3. Adjust brand colors via slide master (2 minutes).
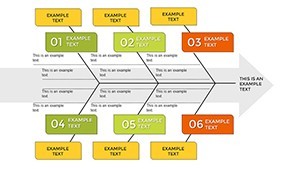
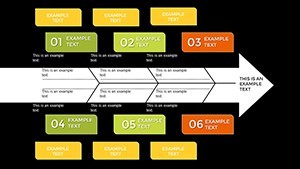
4. Edit zone segmentation and category labels (4 minutes).
5. Trigger animated bone reveals (2 minutes).
Editing difficulty stays moderate.
Three Situations Where This Pays Off
Quality managers in manufacturing apply the file for root cause analysis in performance reviews.
They cut deck preparation from 3 hours to 45 minutes by updating branch labels only.
Team leaders in operations use it for internal reporting on process failures.
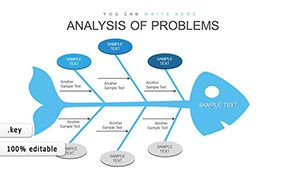
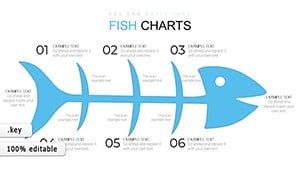
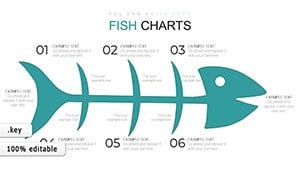
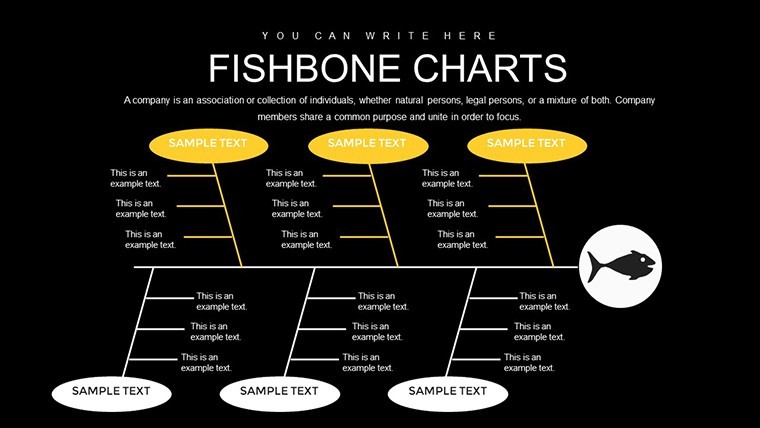
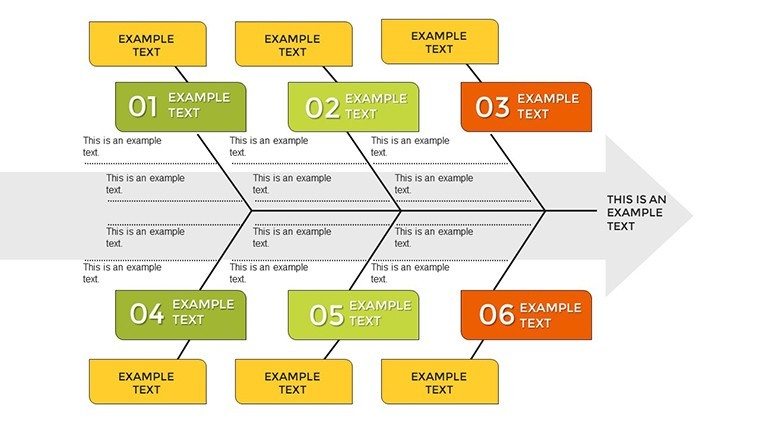
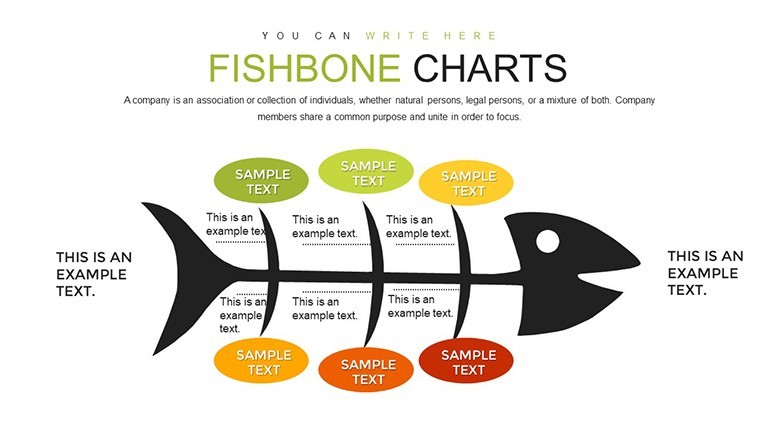
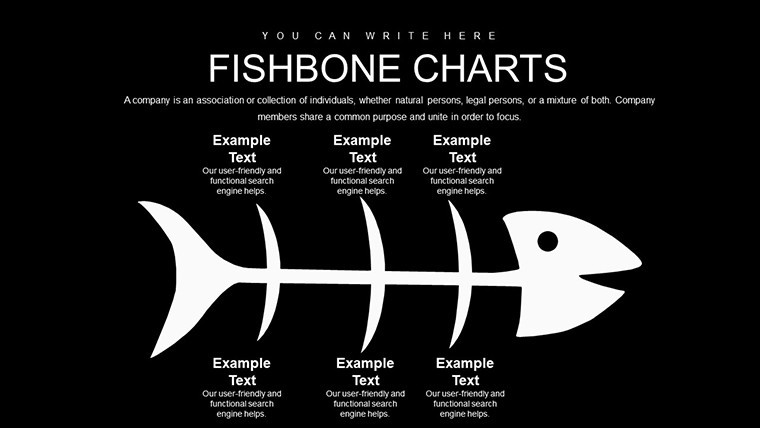
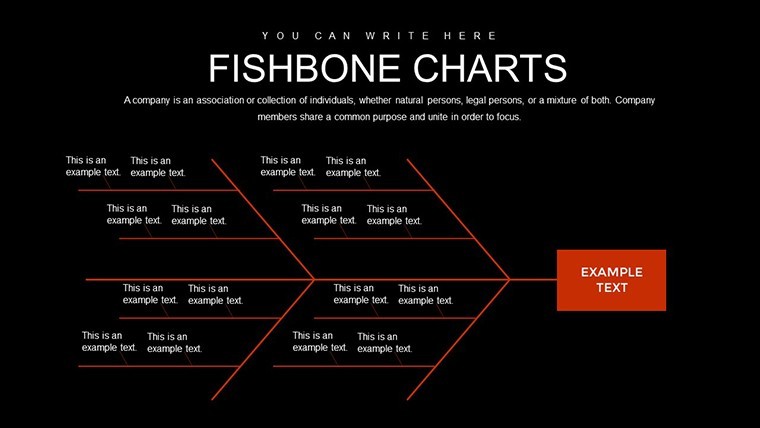
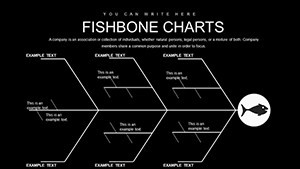
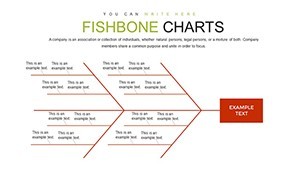
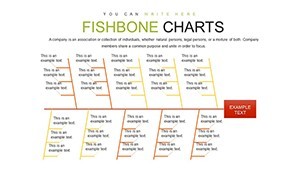
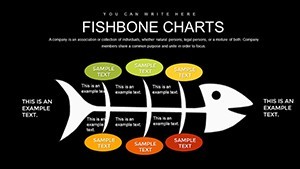
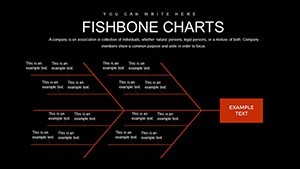
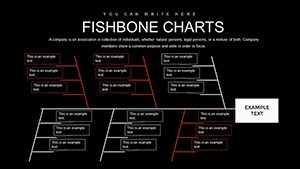
This fishbone version stands out from the related Ishikawa and cause-effect templates because animated bone reveals highlight each category sequentially.
One specific visual characteristic is the category branches for people processes and materials.
It works best for root cause tasks over neighbors since the structured zones match quality control workflows.
The paid version includes the full 22 slides and animation features that previews lack.
Download now to analyze your next root cause
The Cost of Not Using a Template
Building fishbone diagrams from scratch requires advanced Keynote skills plus three hours per analysis.
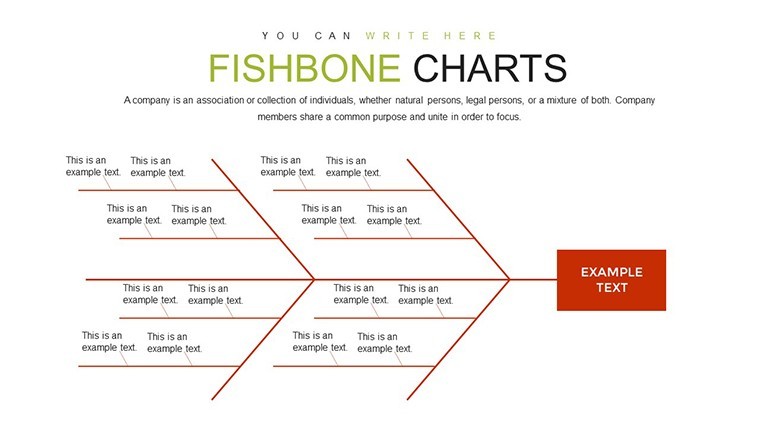
Here the bone structure already exists so focus shifts to data.
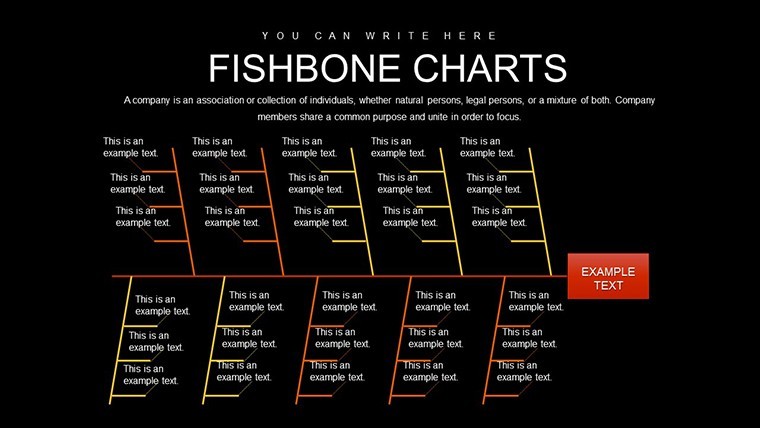
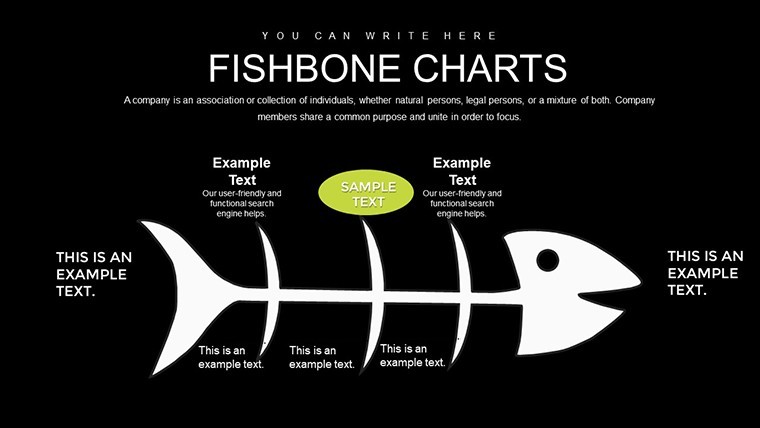
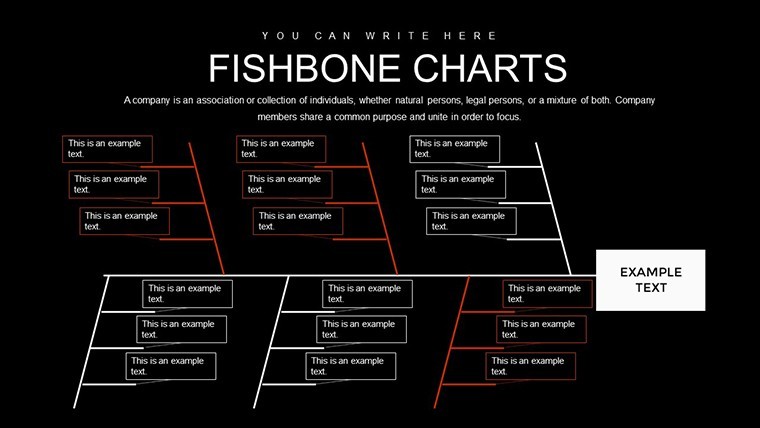
Many charts place causes inside crowded bones yet that reduces visual hierarchy on large screens.
This layout keeps causes outside branches connected by clean lines improving clarity during internal reporting.
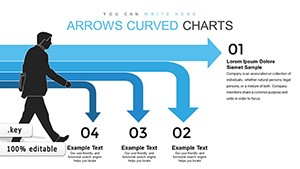
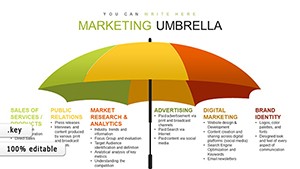
Quality managers often combine this fishbone with 9 Step Cycle Arrows Keynote Template when mapping process fixes.
Get the template and save hours on your next business presentation
Which Keynote versions does the file support?
The .key file opens correctly in Keynote 12 and all later releases including the latest 14.x versions.
Older releases before version 12 may show missing animations or layout shifts.
Always test in your installed version before the final meeting.
No PowerPoint conversion is required since the native format stays Keynote.
How do I change the color scheme?
Select any slide then open the slide master view.
Update the theme colors there and they propagate across every arrow and timeline.
Individual shapes can still receive custom fills without affecting the master.
The process takes under two minutes once you locate the master.
Is client work allowed under the license?
The license permits use in paid client projects and internal company decks.
Resale of the file itself or distribution as a standalone product remains prohibited.
Sublicensing or sharing the original .key with third parties also violates terms.
Modified exports in PDF or image format stay fully compliant for client delivery.
What separates the paid version from free previews?
The paid download supplies all 22 slides plus the complete animation suite.
Free previews contain only static JPEG exports of the first two slides.
Layered editable elements and timelines appear exclusively in the paid file.
No watermarks exist once you complete the purchase.
Which file formats are included?
Only the native .key format ships with the purchase.
Keynote remains the required software to open and edit the content.
Export to PDF or image happens inside Keynote after customization.
No POTX or PowerPoint files accompany the package.
What is the refund policy?
Refunds process within 14 days of purchase if the file fails to open in your Keynote version.
You must provide proof of the compatibility issue before approval.
Opened and edited files no longer qualify for refund.
Contact support directly through the account dashboard to start the request.