Cyclic Double Rings Keynote Charts Template


Type: Keynote Charts template
Category: Cycle
Sources Available: .key
Product ID: KC00796
Template incl.: 30 editable slides
Cycles are the rhythm of progress, from natural ecosystems to business operations, and visualizing them effectively can unlock deeper understandings. Our Cyclic Double Rings Keynote Charts Template brings this to life with 30 editable slides dedicated to circular designs that showcase dual factors and creation processes. Tailored for strategists, analysts, and educators, these double-ring charts allow you to represent interconnected ideas, like yin-yang balances or iterative loops, in a visually harmonious way. Unlike linear charts, these emphasize continuity and interdependence, making them perfect for topics like product lifecycles or philosophical concepts. The template's clean, modern aesthetic ensures your audience stays focused on the message, not distracted by clutter. Whether exploring two ideological pillars in a debate or mapping creation stages in design, this tool transforms abstract cycles into concrete visuals, fostering insightful discussions and innovative thinking.
Key Features That Circle Back to Excellence
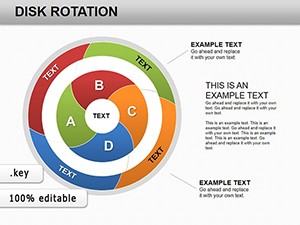
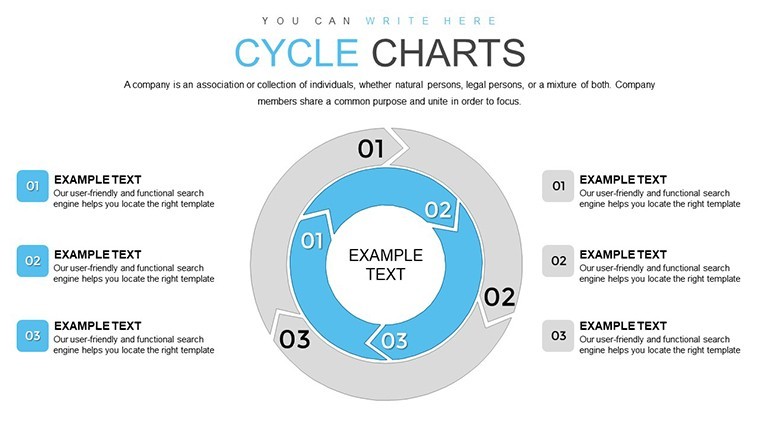
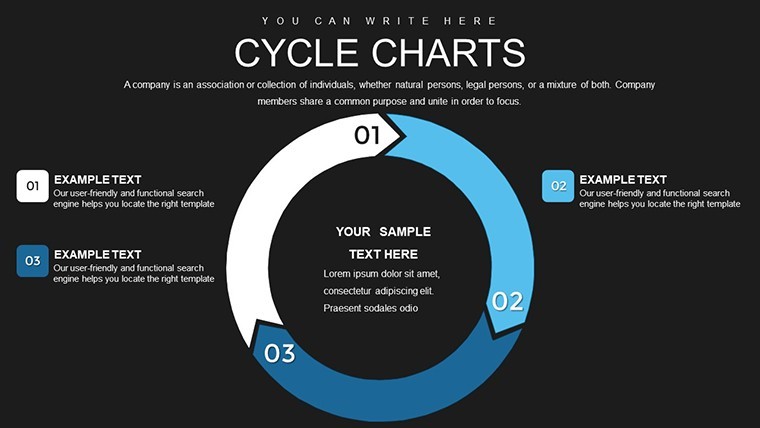
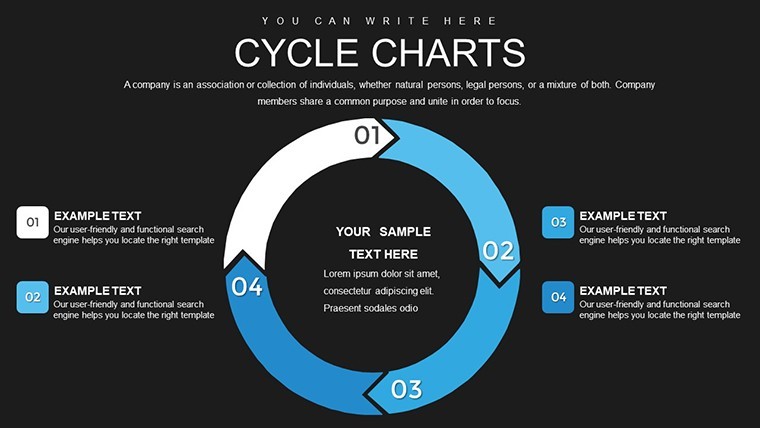
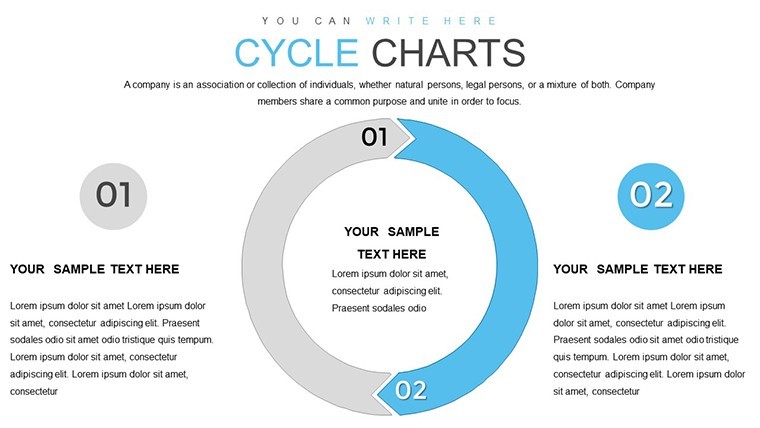
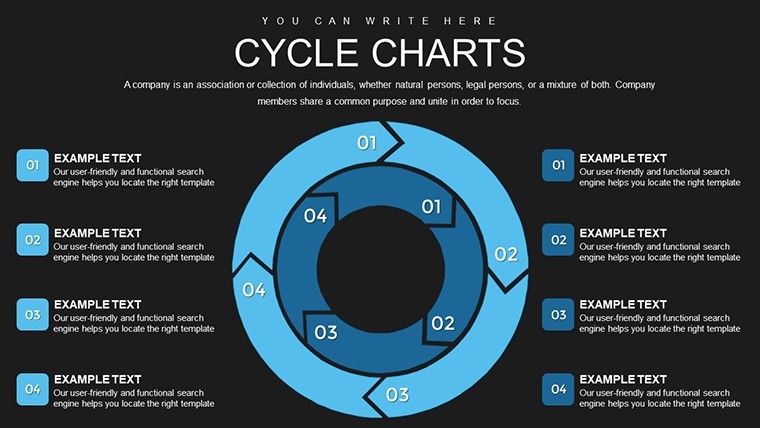
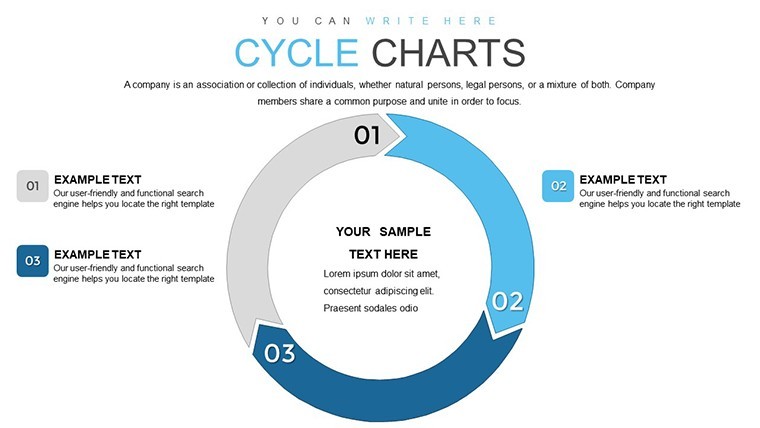
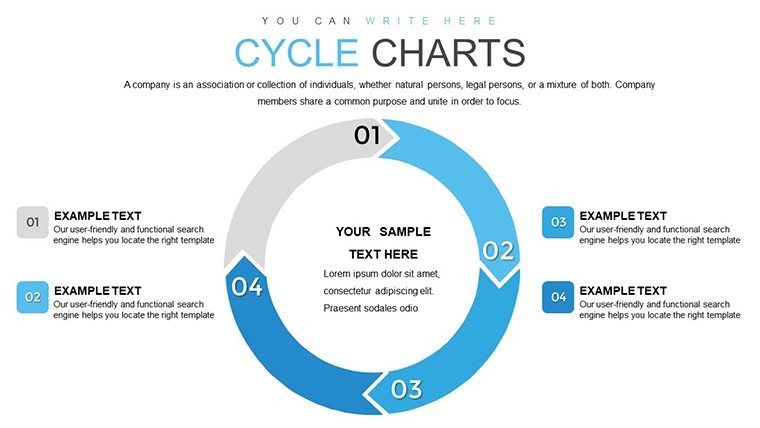
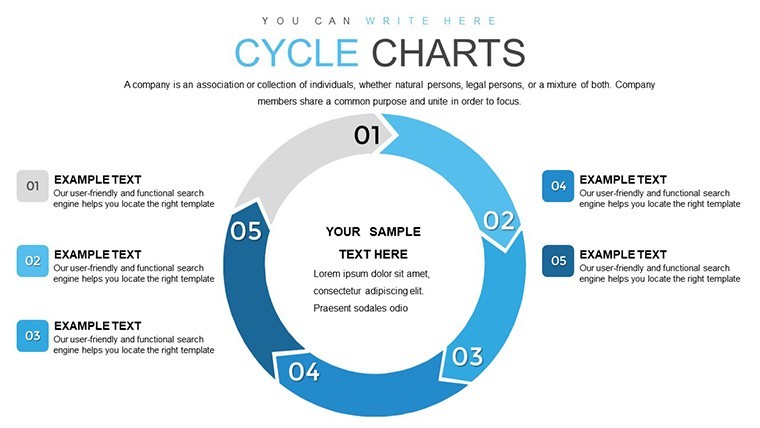
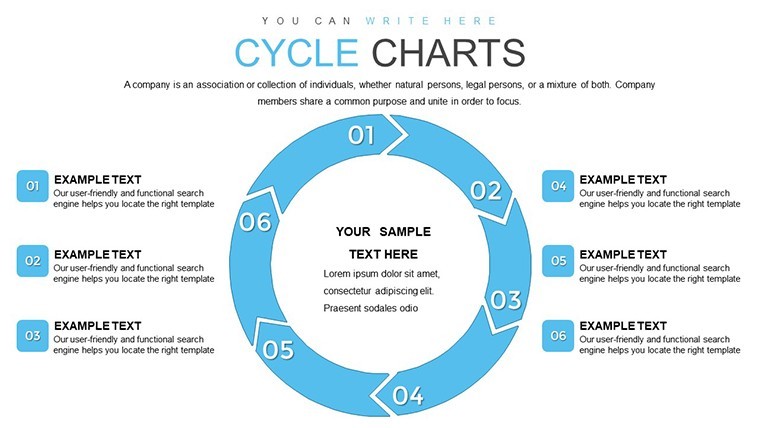
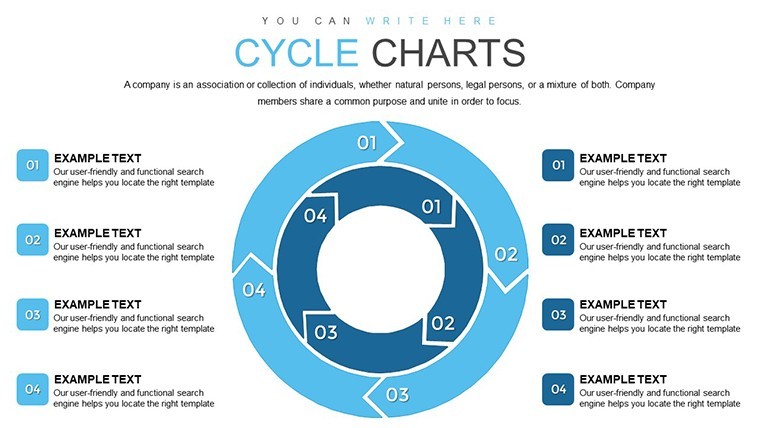
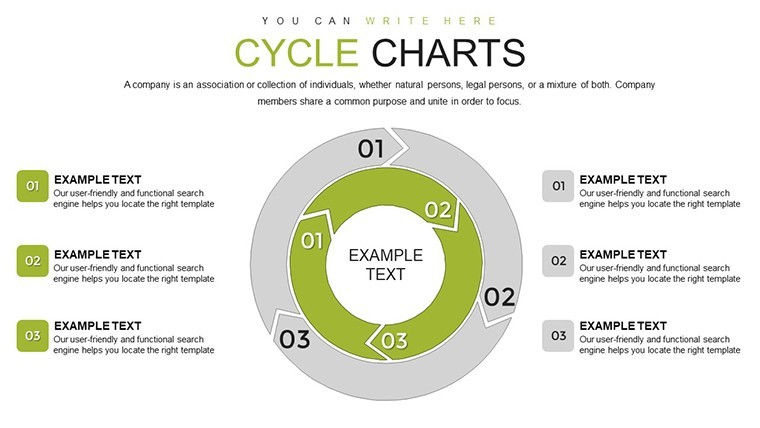
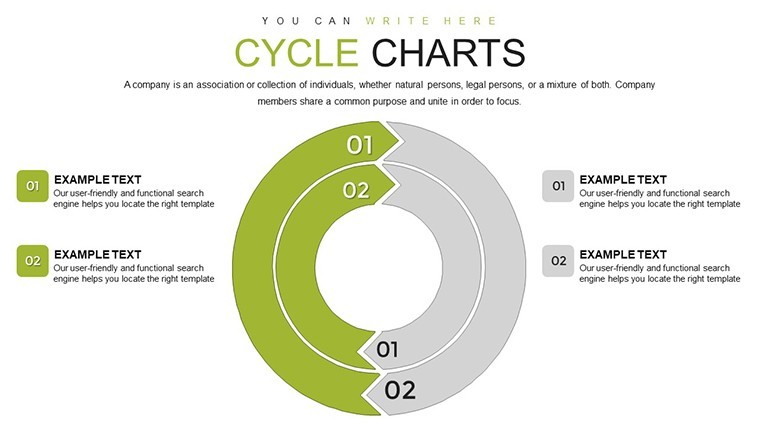
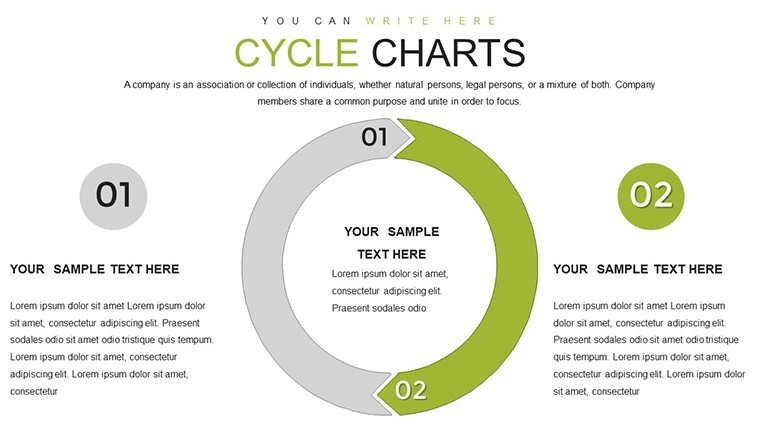
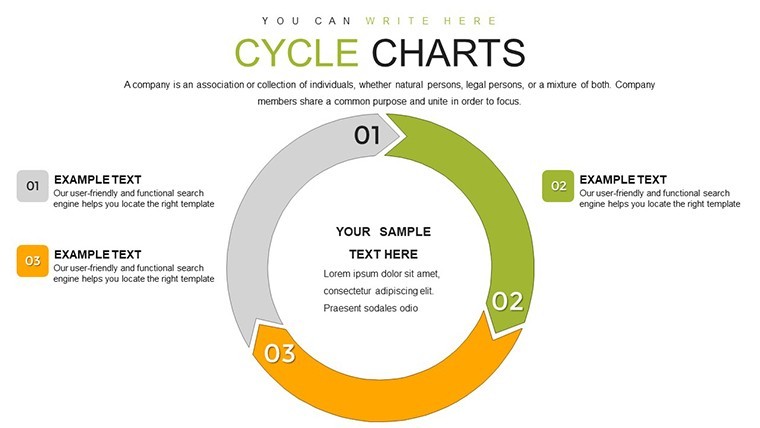
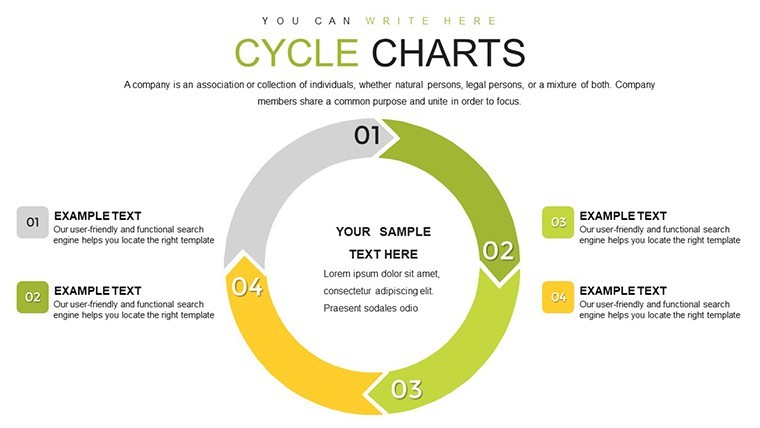
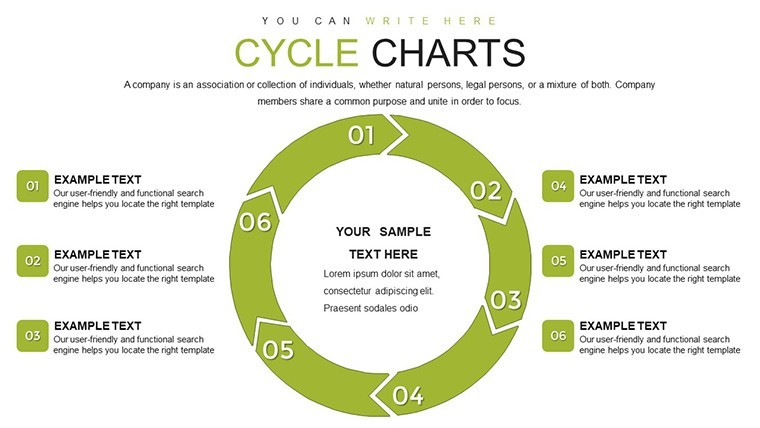
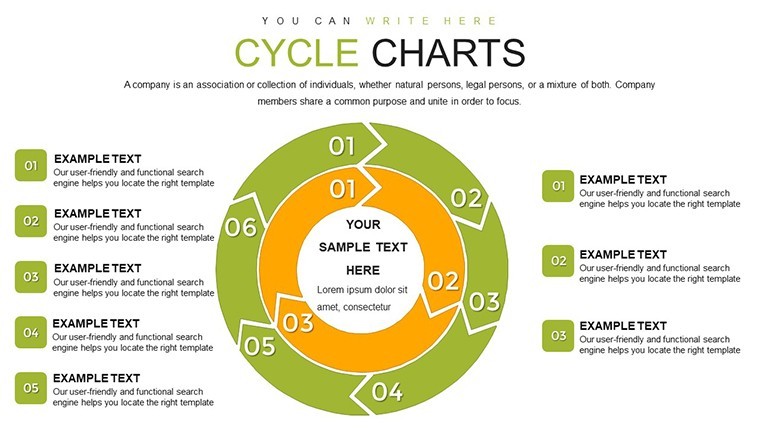
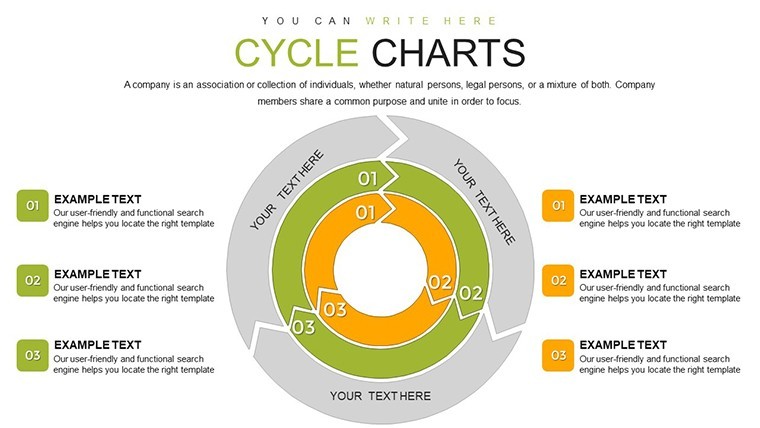
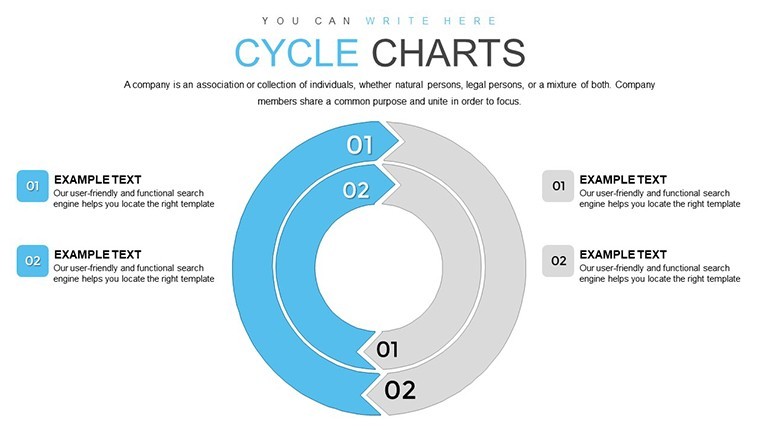
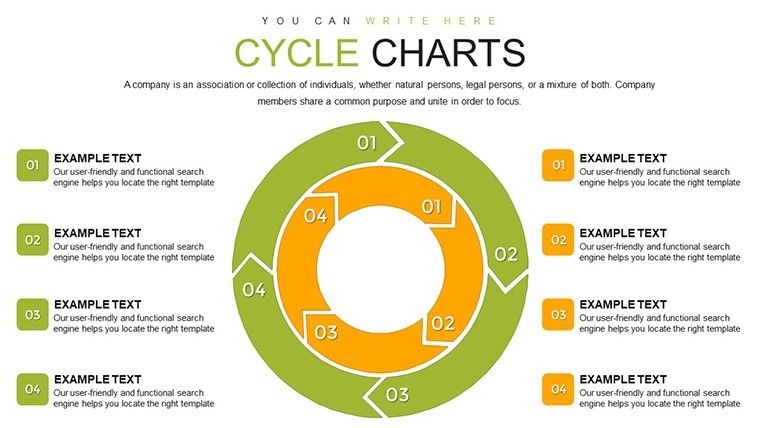
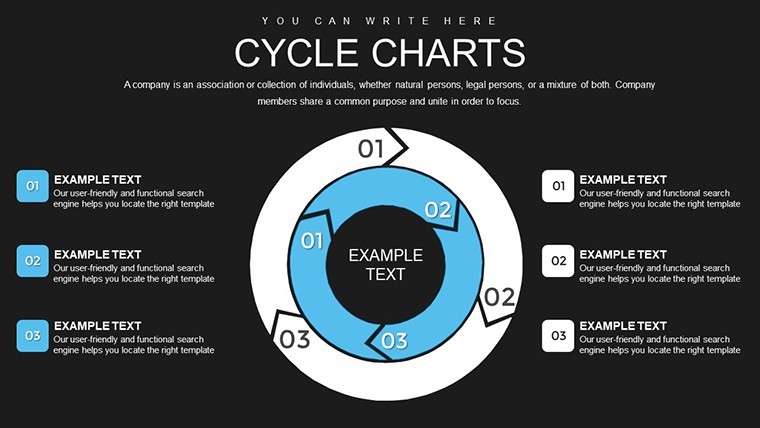
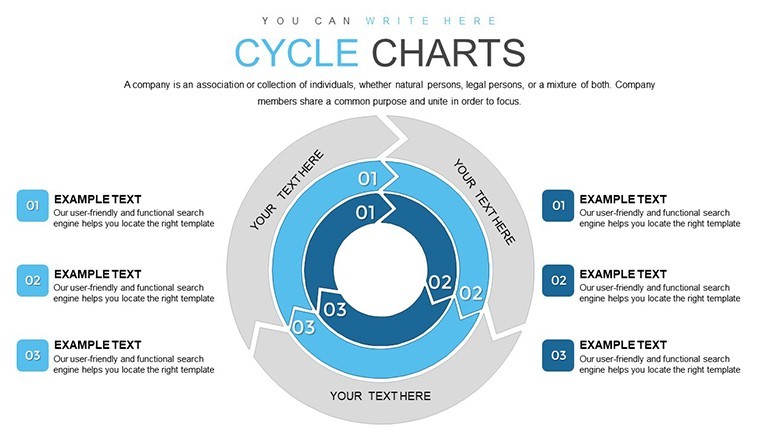
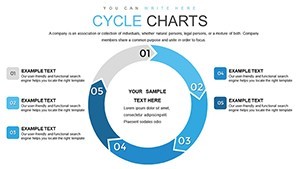
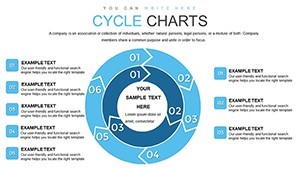
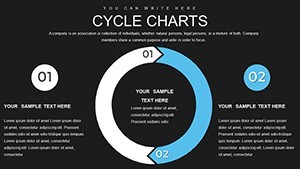
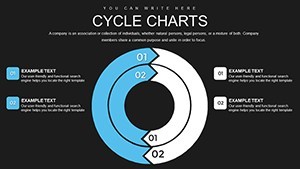
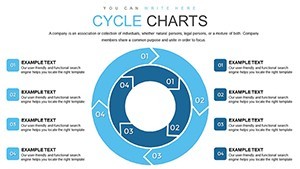
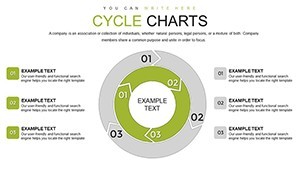
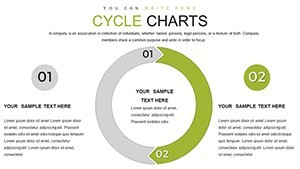
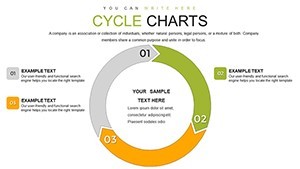
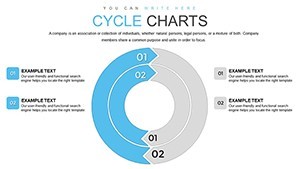
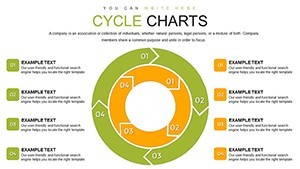
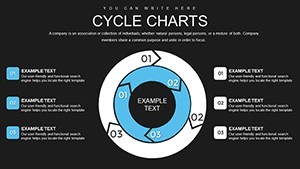
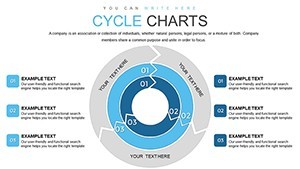
This template excels in its specialized features, all revolving around double-ring cycles for nuanced representations. With 30 slides, you'll find variations in ring sizes, overlaps, and segmentations, allowing depictions of two core factors influencing each other. Editable aspects include ring colors for thematic coding, text labels for detailed explanations, and connectors for process flows. Categorized under cycles, it includes options for concentric rings, interlocking designs, and phased divisions - think Venn diagrams evolved into dynamic circles. Vector graphics ensure high-resolution outputs, ideal for print or digital sharing. Keynote's shape tools integrate seamlessly, enabling custom merges or separations. What distinguishes this is the focus on duality: Each chart highlights interactions between pairs, such as supply and demand or theory and practice, drawing from systems thinking principles. This makes it a standout for presentations requiring depth without complexity.
In-Depth Exploration of Slide Variations
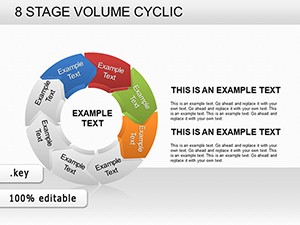
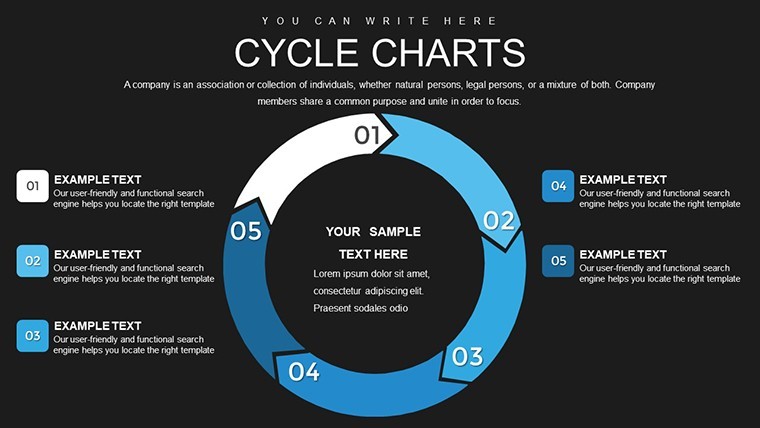
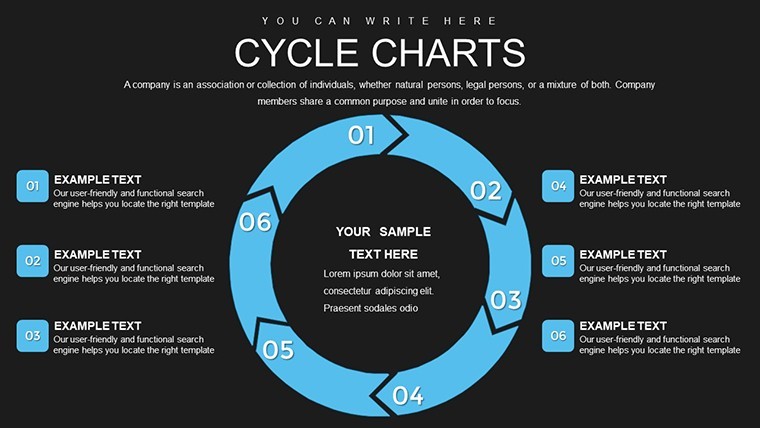
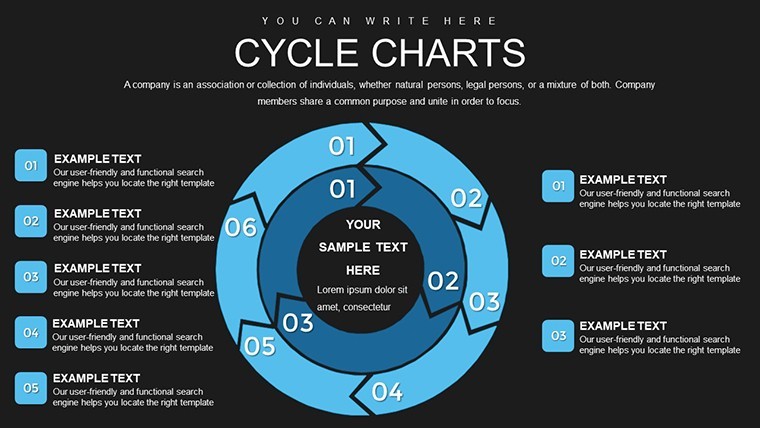
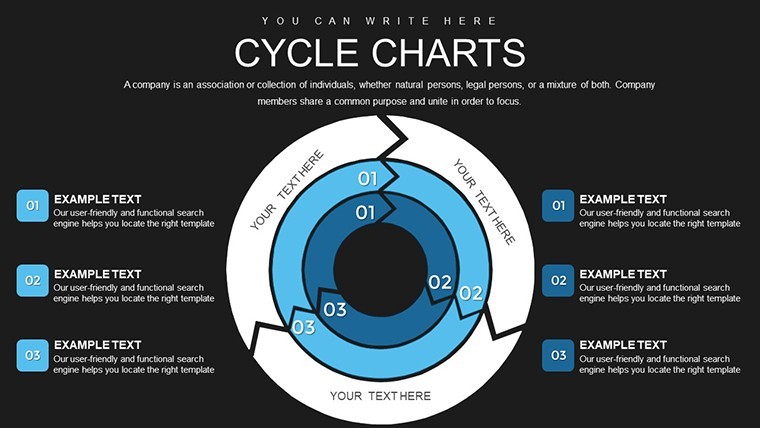
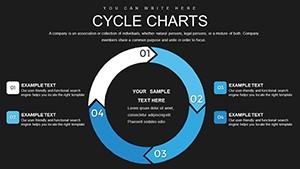
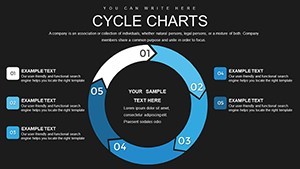
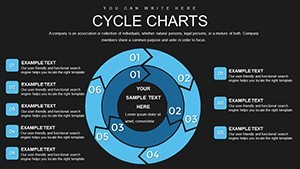
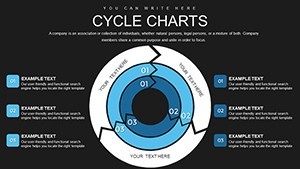
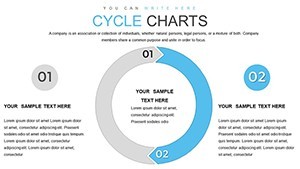
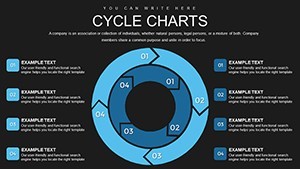
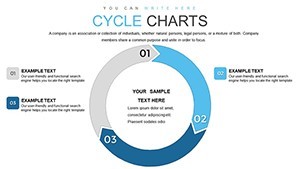
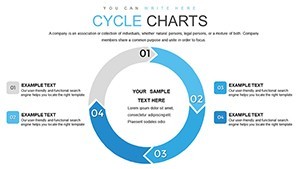
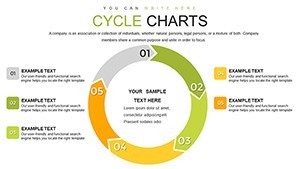
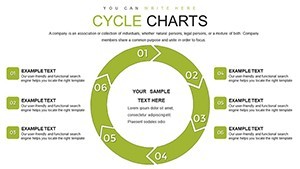
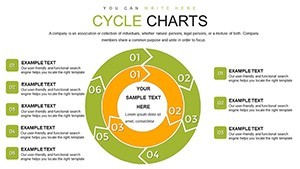
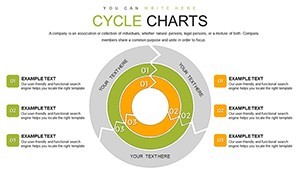
Diving into the slides, the first few establish basic double rings for simple dualities, with adjustable segments for proportional data. Slides 4-10 introduce phased cycles, segmenting rings into steps like ideation to execution, complete with arrow indicators for directionality. For comparative analysis, slides 11-18 feature overlapping rings with highlight zones, perfect for showing synergies or conflicts. Advanced options in slides 19-25 include nested rings for hierarchical processes, such as core values encircling operational tactics. The closing slides offer template hybrids, combining rings with icons or charts for multifaceted views. Each slide comes with placeholder gradients and shadows for 3D effects, enhancing perceived depth. This variety ensures you can adapt to any cyclic narrative, from biological feedback loops to economic models.
Applications in Diverse Fields of Thought
Imagine a philosopher using these rings to illustrate dialectical materialism, with one ring for thesis and antithesis leading to synthesis - echoing Hegelian concepts taught in universities worldwide. In business, consultants map sustainability cycles, showing environmental and economic interplay, as in reports from the World Economic Forum. Educators employ them for science lessons on water or carbon cycles, making abstract processes relatable. Creative agencies visualize brand evolution, with inner rings for core identity and outer for market adaptations. Real examples abound, like how Toyota uses cyclic diagrams in Kaizen for continuous improvement. For personal development, coaches depict habit formation loops, inner for motivation and outer for actions. This template's versatility spans disciplines, always promoting a holistic view that encourages balanced decision-making.
Customization Techniques for Circular Mastery
Make it your own by starting with ring resizing to emphasize dominance - larger for primary factors. Apply color psychology: Blues for calm processes, reds for dynamic ones. Insert data via Keynote's chart editor, linking to external sources for accuracy. For interactivity, add hyperlinks between rings to related slides or docs. Collaborate by sharing via iCloud, allowing annotations on specific segments. Export options include animated GIFs for web use, preserving cycle motions. Tip: Align with golden ratio principles for aesthetic balance, as advocated by design gurus like Dieter Rams. These methods ensure your cyclic charts are not just informative but artistically compelling.
Insights for Impactful Cyclic Presentations
Drawing from expertise in visual communication, prioritize simplicity: Limit segments to 4-6 per ring to avoid overload. Use animations to rotate rings, simulating real cycles. Back claims with data, citing sources like academic journals for credibility. In group settings, pose questions via rings to spark debates. Track effectiveness by audience polls on comprehension. Align with perceptual psychology, ensuring rings guide eye flow naturally. These tactics, refined through marketing analyses, turn cyclic charts into persuasive tools.
Embrace the Cycle of Superior Design
This Cyclic Double Rings Keynote Charts Template is your gateway to sophisticated visualizations. With its emphasis on duality and flow, it's essential for thoughtful presentations. Step into the circle - download and redefine how you present cycles.
Frequently Asked Questions
- What are double rings best for?
- Depicting two interrelated factors or processes, like balances in systems.
- How editable are the ring designs?
- Fully, with adjustments to sizes, colors, and segments in Keynote.
- Can I add more than two rings?
- Yes, duplicate and layer for multi-factor cycles.
- Is it suitable for data-heavy presentations?
- Absolutely, with options for integrating charts and labels.
- What philosophical applications does it have?
- Great for dialectics or dualities in thought processes.