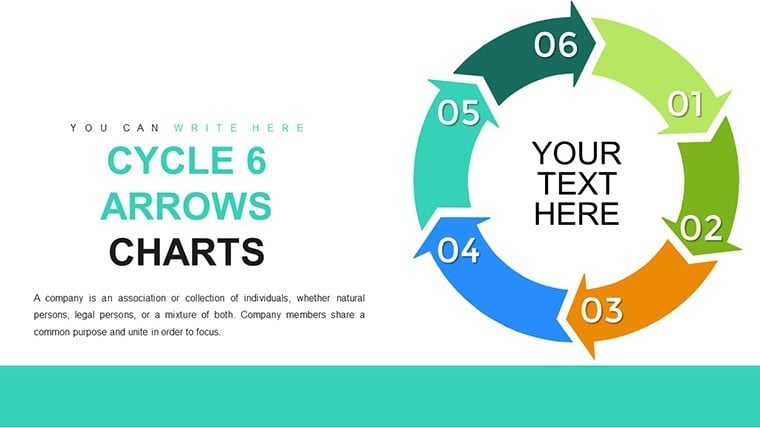
Cycle 6 Arrows Keynote Charts: Enhance Workflow Depictions with Precision


Type: Keynote Charts template
Category: Cycle
Sources Available: .key
Slide size: widescreen (16:9)
Product ID: KC00778
Template incl.: 18 editable slides
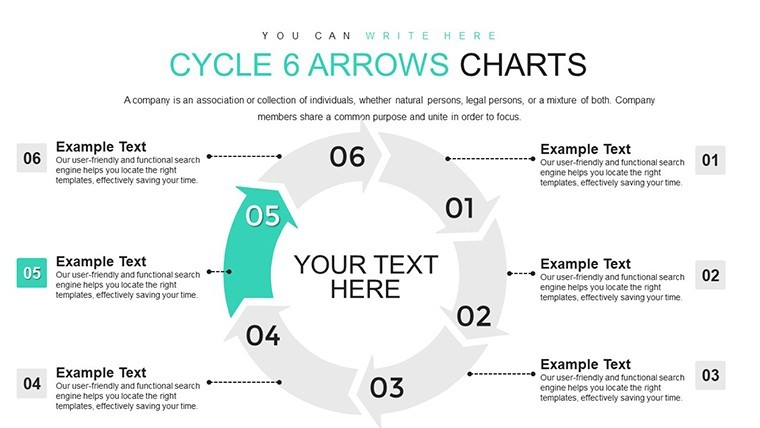
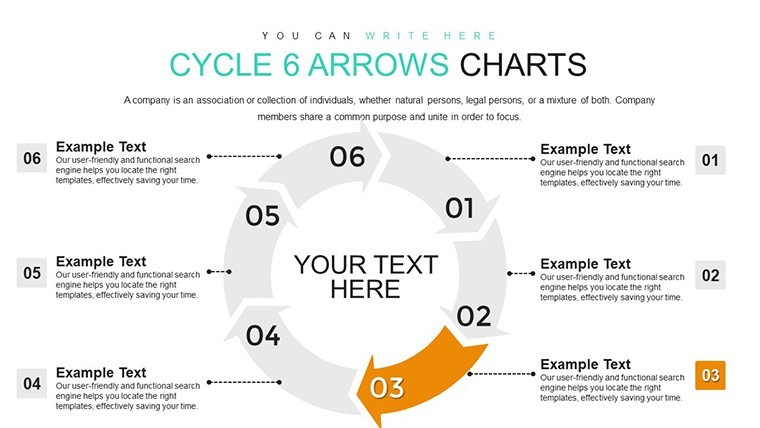
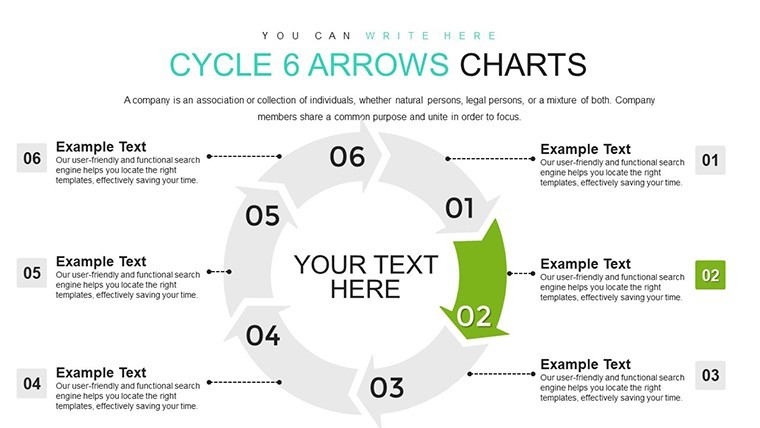
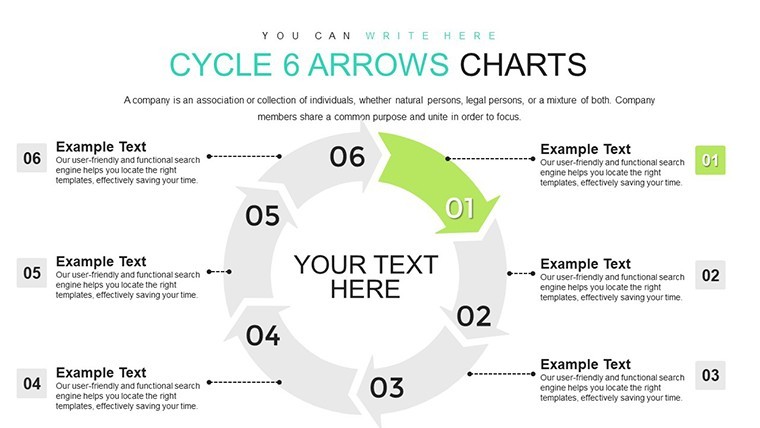
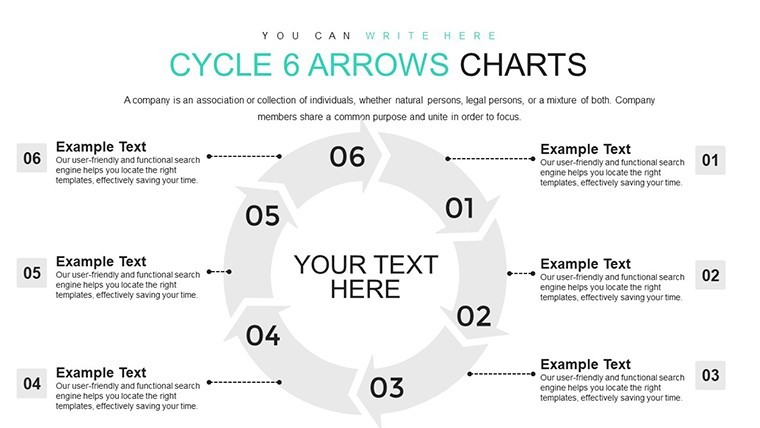
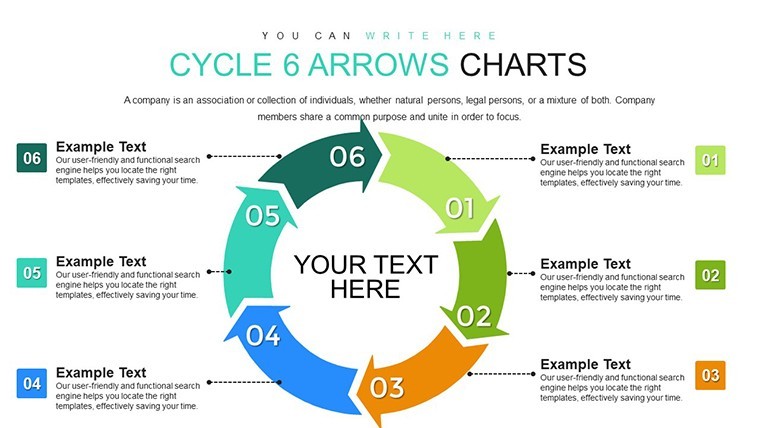
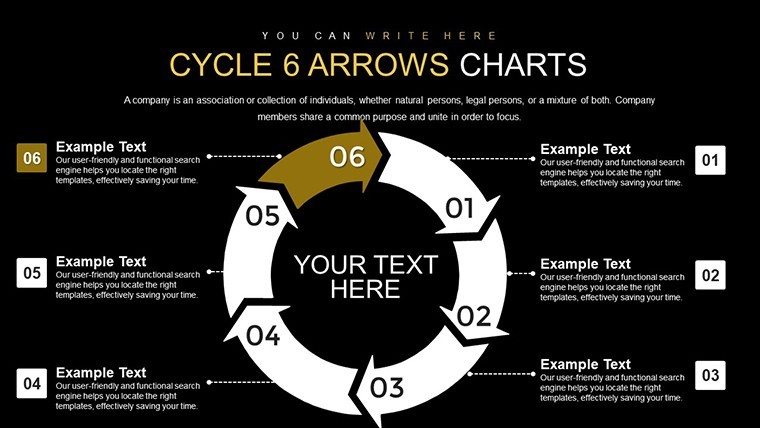
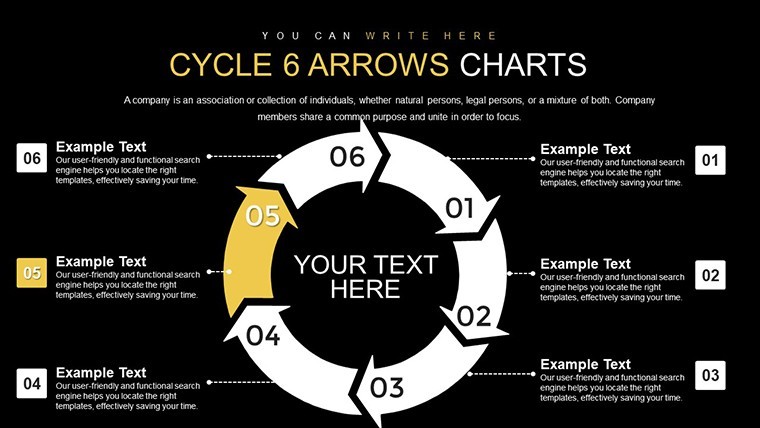
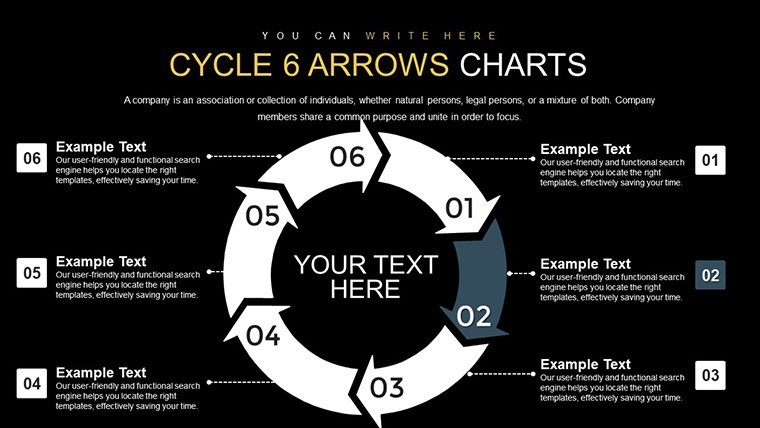
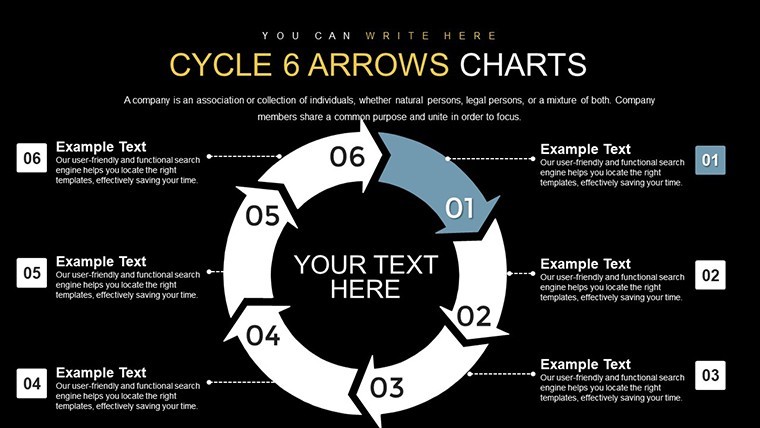
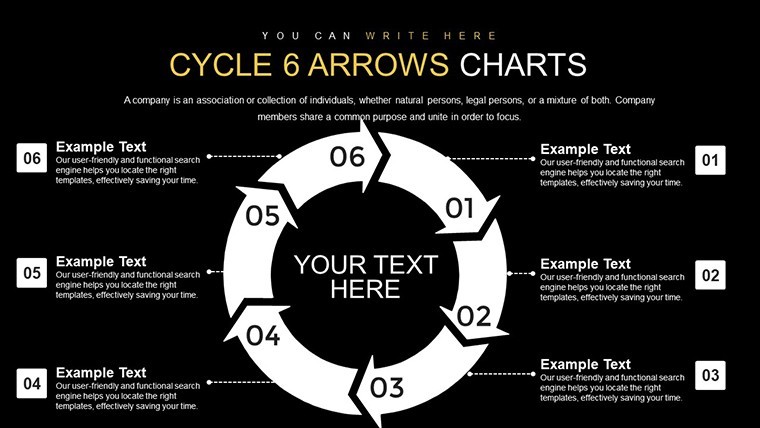
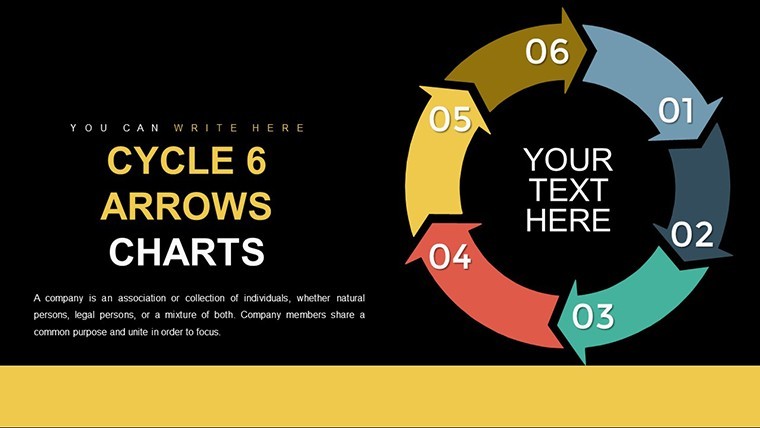
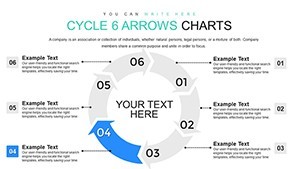
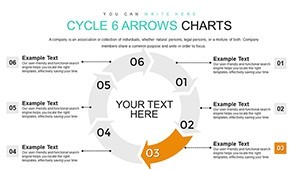
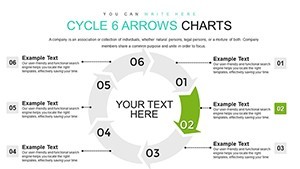
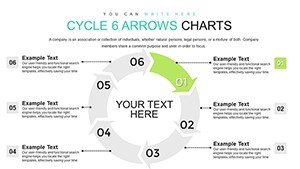
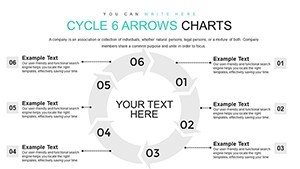
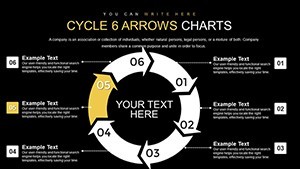
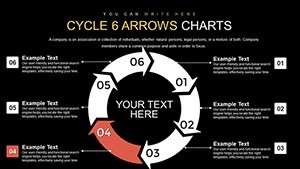
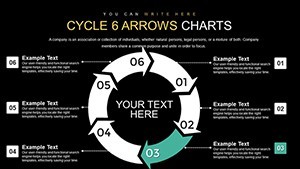
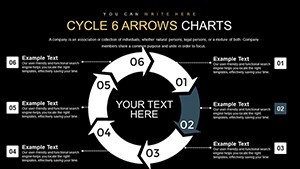
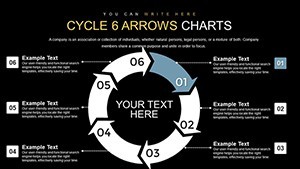
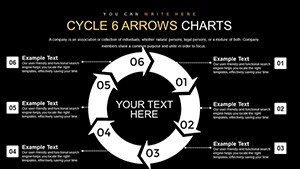
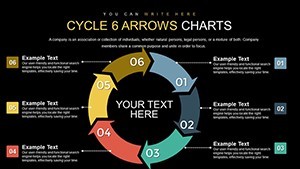
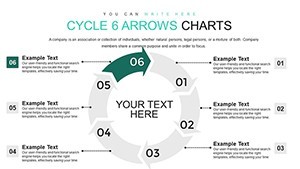
Cyclical processes define many operations, from strategic planning to iterative improvements, requiring visuals that capture ongoing motion without breaks. Our Cycle 6 Arrows Keynote Charts Template provides 18 editable slides dedicated to six-phase loops, empowering strategists, marketers, and operations experts to articulate complex flows with elegance. Whether detailing a sales funnel or innovation pipeline, these arrows create a rhythmic narrative that guides viewers through each interconnected step.
Envision charting a content marketing cycle: research, creation, distribution, engagement, analysis, optimization - circling back. The template's arrows, with customizable bends and fills, bring this to life, incorporating elements like funnel icons for added depth. Optimized for Keynote, it facilitates rapid adjustments, turning your ideas into high-impact visuals that foster understanding and collaboration.
Core Attributes for Advanced Cycle Mapping
Featuring six-arrow formations in varied layouts, the template allows for segmented emphasis, such as bolding 'analysis' in a data-driven cycle. Slides support layered text, images, and gradients, with snap-to alignment for flawless symmetry. In marketing contexts, align with AIDA models extended to six steps, infusing professionalism drawn from digital strategy frameworks.
- Directional Dynamics: Arrows convey momentum, ideal for forward-thinking processes.
- Layout Flexibility: Choose compact or expanded views for different audience sizes.
- Symbolic Enhancements: Add metrics or milestones per arrow for quantifiable insights.
- Durability: Vectors scale infinitely, preserving clarity in prints or zooms.
Diverse Scenarios and Proven Examples
For operations, map lean manufacturing cycles per Six Sigma DMAIC plus sustainment, as in Toyota's kaizen implementations that cut waste via visualized loops. Marketers can depict customer journeys, boosting conversion rates akin to HubSpot's inbound methodology successes. In strategy sessions, illustrate business model canvases in cycle form, facilitating workshops that yield innovative outcomes.
A case in point: An e-commerce firm revamped their order fulfillment cycle using analogous visuals, reducing errors and enhancing team alignment - mirroring efficiencies from Amazon's logistics optimizations.
Guided Process for Template Mastery
- Initiate Download: Secure the .key file and integrate into your Keynote library.
- Define Phases: Assign labels to arrows, detailing six unique steps.
- Personalize Elements: Apply brand hues, insert transitions for sequential builds.
- Augment with Insights: Embed charts or quotes, sourcing from analytics platforms.
- Validate and Deploy: Test flow logic, adjust based on rehearsals.
Sync with apps like Trello for real-time process tracking, evolving your cycles into interactive strategy tools.
Edges Over Standard Visual Aids
Beyond basic shapes, this template offers pre-curved arrows for natural flow, with accessibility tweaks like alt text prompts. Gartner reports affirm that such refined visuals accelerate decision-making in strategic planning.
Organize content hierarchically: Introduce the cycle holistically, then dissect arrows, building comprehension layer by layer as in masterclass sessions.
Strategic Tips for Cycle Excellence
Employ active language in labels - 'Innovate' over 'Innovation Phase'. Layer opacity for phased reveals. Draw from Porter's value chain for business cycles, ensuring relevance. In virtual settings, use screen sharing with annotations for collaborative refinements.
Insights from thought leaders like Michael Porter underscore how cyclical visuals demystify strategies, making your 6-arrow charts indispensable for progress.
Harness this template to redefine how you present cycles - fostering endless improvement and strategic foresight.
Frequently Asked Questions
- Can arrow colors be themed per step?
- Yes, individual customization allows for distinct highlighting.
- Suitable for educational use?
- Perfect for teaching models like the water cycle or economic theories.
- How to handle complex sub-steps?
- Nest smaller cycles within arrows for depth.
- Export compatibility?
- Seamless to video or static formats for broader distribution.
- Animation inclusion?
- Pre-built options animate arrow progression smoothly.