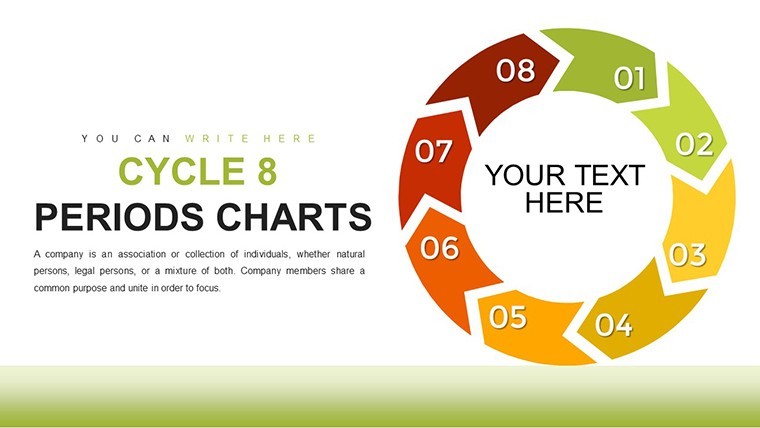
8-Period Cycle Keynote Charts: Transform Your Architectural Presentations


Type: Keynote Charts template
Category: Cycle
Sources Available: .key
Product ID: KC00765
Template incl.: 21 editable slides
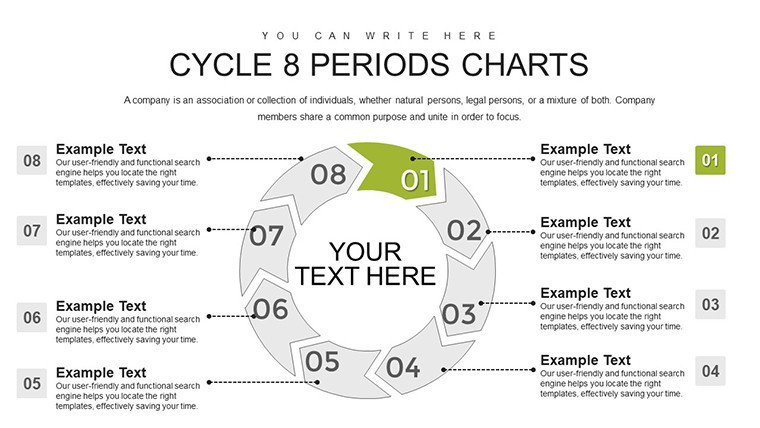
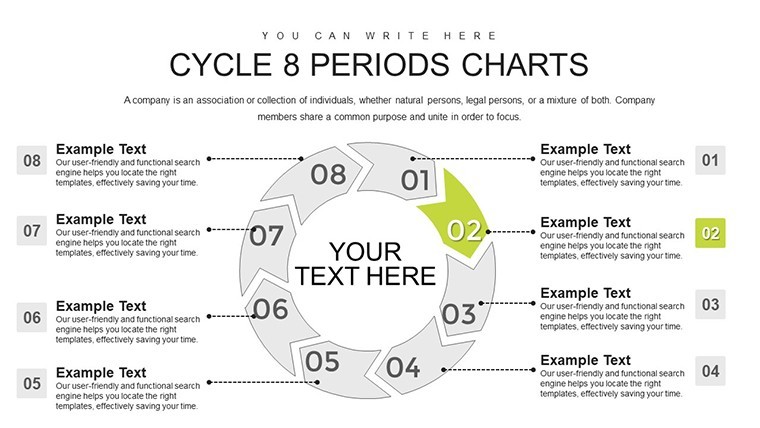
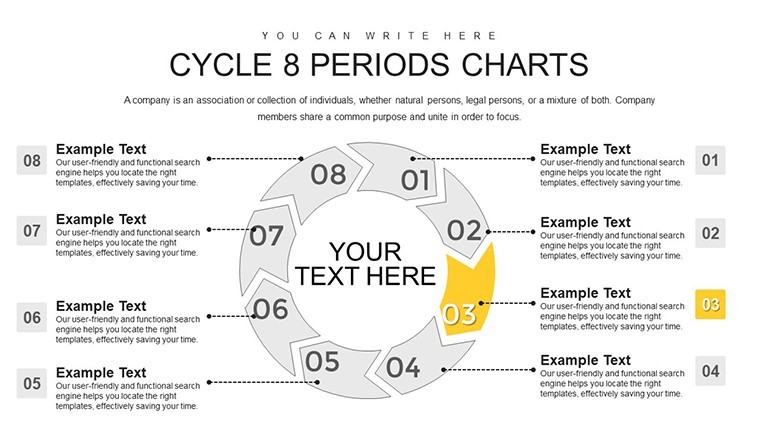
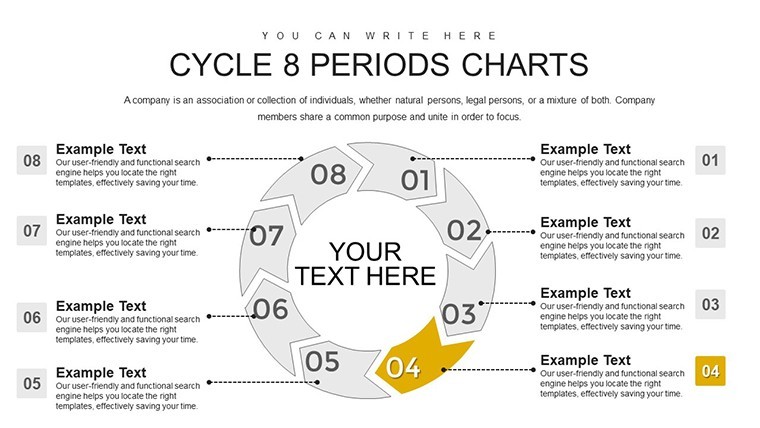
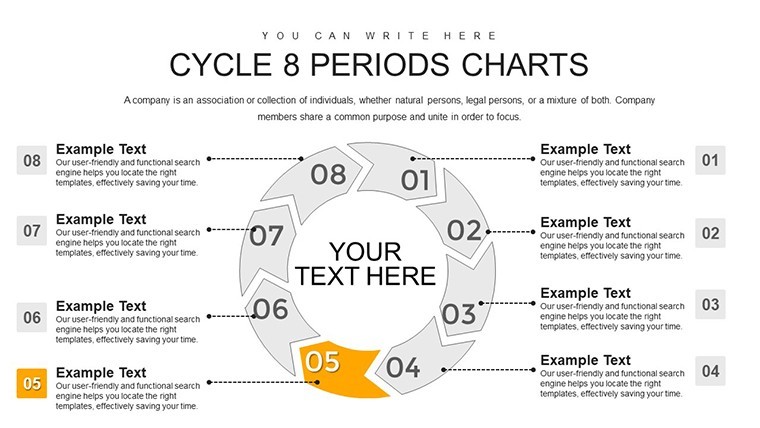
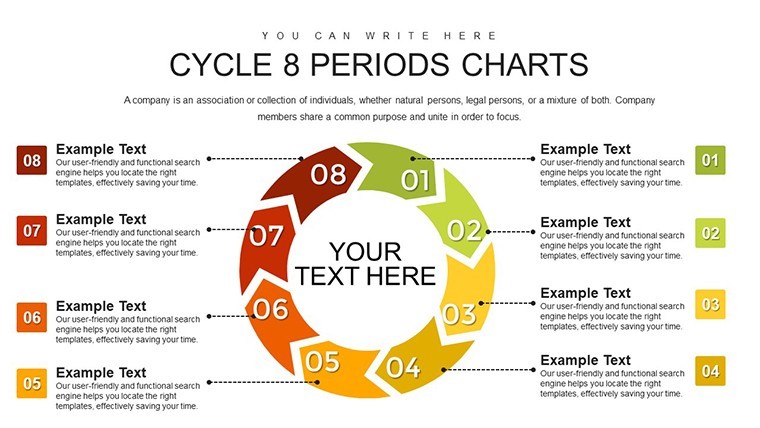
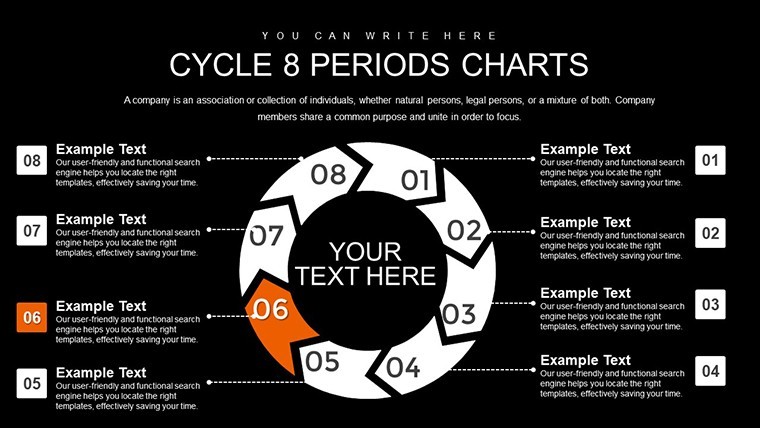
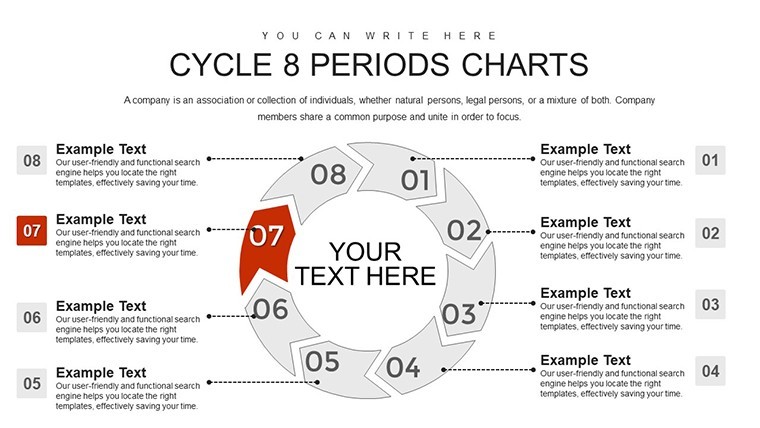
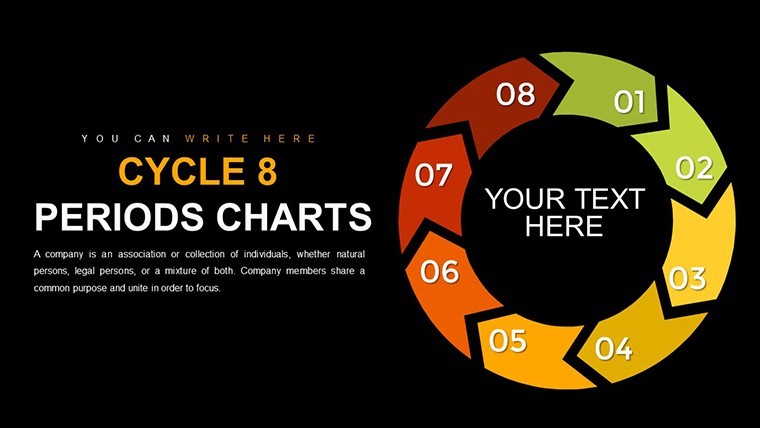
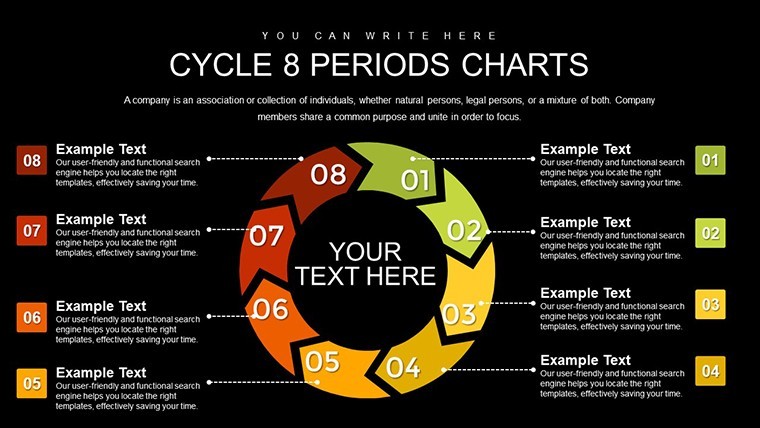
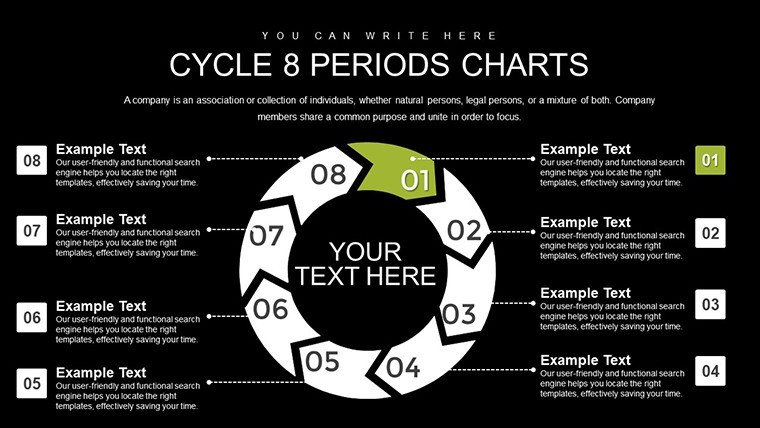
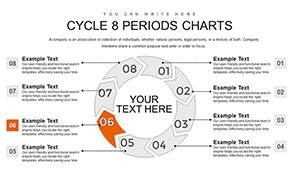
In the fast-paced world of architecture, where projects evolve through intricate stages from concept to completion, visualizing interconnected processes is key to winning clients and collaborating effectively. Imagine turning complex data flows - like site analysis, design iterations, permitting, and construction phases - into a seamless, circular narrative that captivates your audience. Our 8-Period Cycle Keynote Charts template does just that, offering 21 fully editable slides designed specifically for professionals who need to communicate cyclical workflows with clarity and impact.
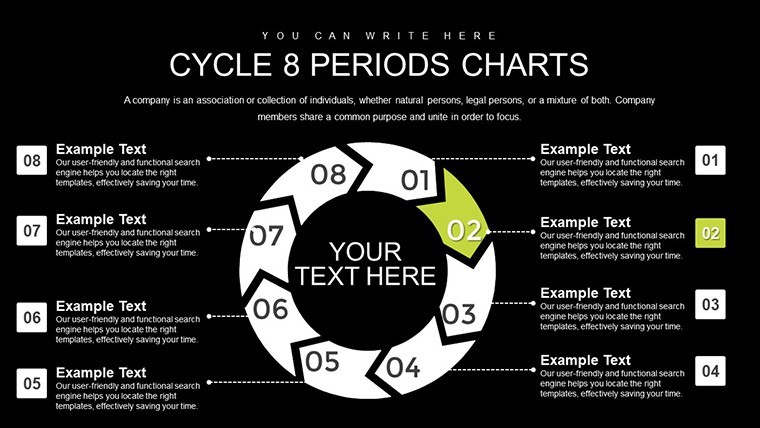
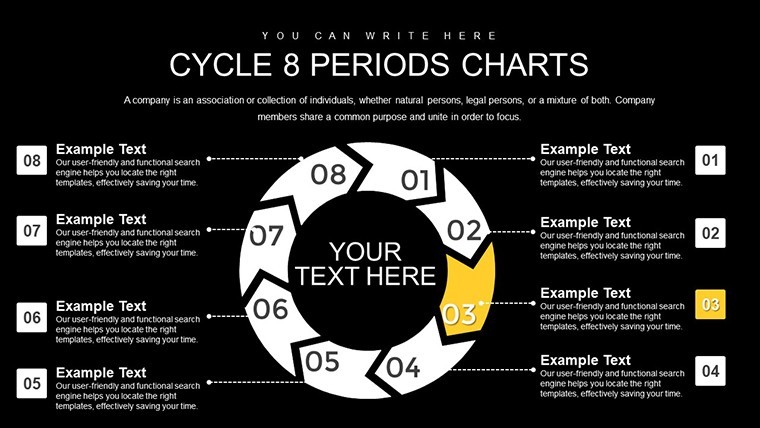
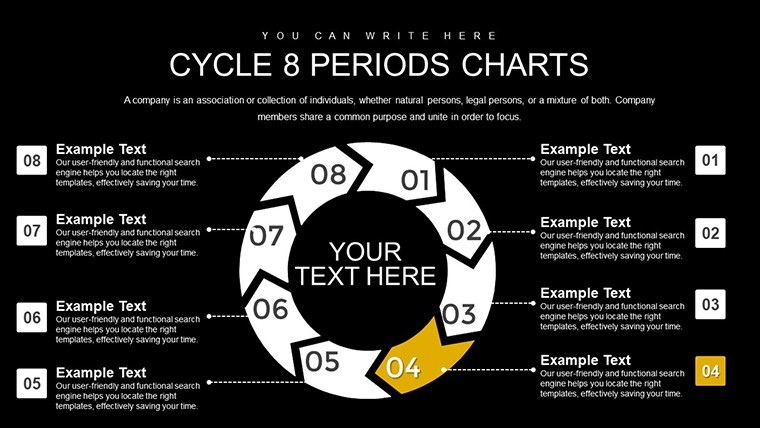
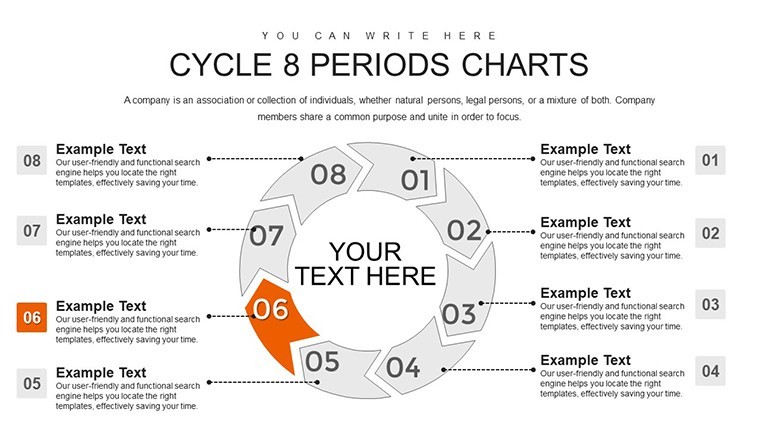
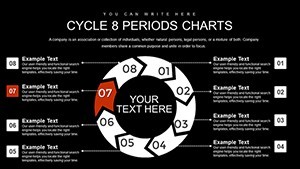
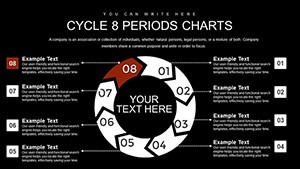
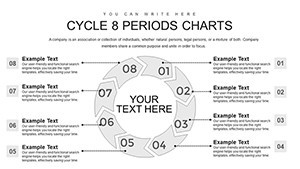
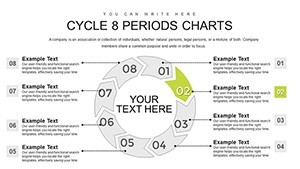
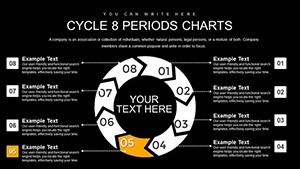
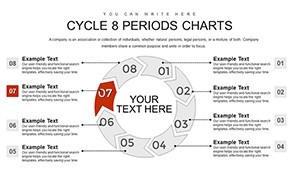
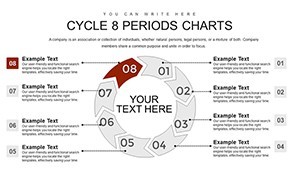
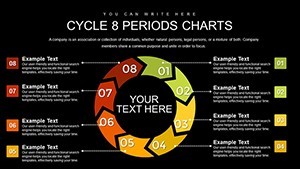
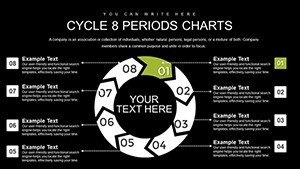
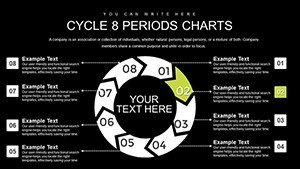
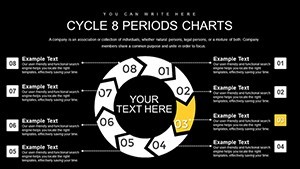
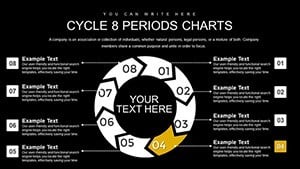
Crafted with architects in mind, this template features arrow-based cycles that represent eight distinct periods, ideal for illustrating repeating elements in urban planning or sustainable design projects. Whether you're pitching a LEED-certified building proposal or mapping out renovation timelines, these charts help you highlight metrics such as budget allocations, timeline milestones, and resource distributions without overwhelming your viewers. The intuitive design ensures that even non-technical stakeholders grasp the big picture instantly, fostering better decision-making and team alignment.
Key Features That Empower Your Designs
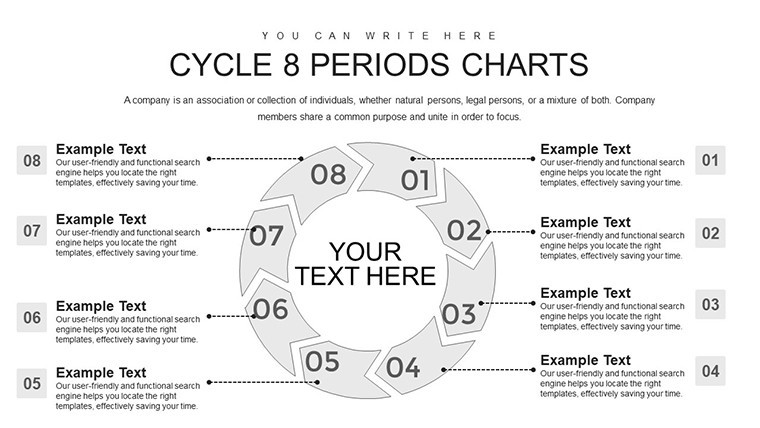
Dive into a suite of tools tailored for precision and creativity. Each slide boasts high-resolution graphics with customizable colors, fonts, and layouts, compatible seamlessly with Keynote's latest versions. Forget starting from scratch; our pre-built arrows form perfect circles, symbolizing continuity in processes like material sourcing cycles or client feedback loops.
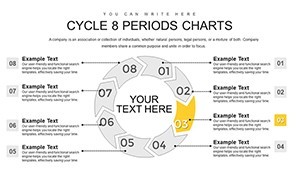
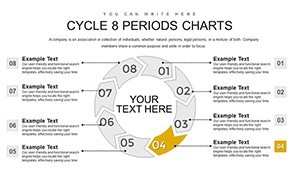
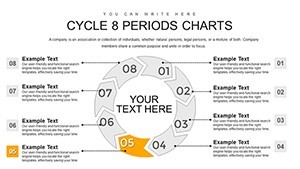
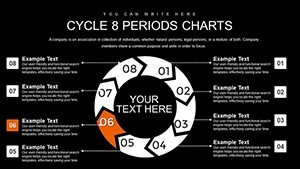
- Editable Arrow Elements: Adjust sizes, directions, and labels to fit your specific project data, such as phasing out environmental impact assessments over eight quarters.
- Data Integration: Easily embed metrics from tools like AutoCAD or Revit, turning raw numbers into visually appealing infographics that demonstrate cost efficiencies in architectural bids.
- Themed Variations: Choose from minimalist modern styles or bold, blueprint-inspired themes to match your firm's branding, enhancing trustworthiness in AIA-compliant presentations.
- Animation Ready: Add smooth transitions to reveal each period progressively, making your talks on adaptive reuse projects more engaging and story-like.
These features not only save hours of design time but also align with best practices from industry leaders, such as those outlined in the American Institute of Architects' guidelines for effective communication.
Real-World Applications in Architecture
Picture this: You're leading a workshop on mixed-use development cycles. With our template, you can map out eight periods - from initial zoning reviews to post-occupancy evaluations - using interconnected arrows that show how each step feeds into the next. This approach has proven effective in real scenarios, like the redevelopment of Boston's Seaport District, where similar visualizations helped stakeholders understand iterative planning.
For internal use, architects at firms like Gensler have leveraged cycle charts to streamline workflow reviews, reducing miscommunications by up to 30% according to project management studies. Apply it to sustainability reports, where periods represent carbon footprint tracking over building lifecycles, or in educational settings to teach students about historical architectural evolutions, such as the eight-phase Gothic cathedral constructions.
Step-by-Step Workflow Integration
- Download and open the template in Keynote.
- Select a slide and input your data - e.g., label arrows with phases like "Conceptual Design" to "Final Handover."
- Customize visuals to reflect project specifics, incorporating icons for tools like BIM software.
- Rehearse animations to ensure smooth flow during client meetings.
- Export and share, knowing your presentation stands out with professional polish.
Compared to basic Keynote tools, which often result in static, uninspiring diagrams, our template offers dynamic, editable cycles that adapt to evolving projects, much like how parametric design software revolutionizes form-finding in architecture.
Benefits That Drive Project Success
Beyond aesthetics, this template delivers tangible value. It boosts audience retention by presenting data in digestible loops, ideal for RFP responses where clarity wins contracts. Users report faster approval times, as seen in case studies from firms handling large-scale infrastructure like bridges or airports, where eight-period cycles clarify maintenance and upgrade schedules.
Incorporate LSI elements naturally: Think of these as versatile process diagrams, flowchart alternatives, or ring charts for iterative methodologies in design thinking. They're not just slides; they're conversation starters that position you as an expert in fields demanding precision, like landscape architecture or interior fit-outs.
Ready to cycle through success? Customize your 8-period charts today and watch your architectural narratives come alive.
Frequently Asked Questions
How customizable are the cycle arrows in this template?
The arrows are fully editable, allowing changes in color, size, and text to suit your architectural data needs.
Is this compatible with older Keynote versions?
Yes, it works with Keynote 6 and above, ensuring broad accessibility for design teams.
Can I use these for non-architecture presentations?
Absolutely, though optimized for cyclical processes like project phases, they're adaptable to business or education.
What file format is provided?
The download includes a .key file with all 21 slides ready for immediate use.
Are there animation presets included?
Yes, built-in animations highlight each period sequentially for impactful delivery.