Protection Economy Market Keynote Charts - Editable Keynote | ImagineLayout


Type: Keynote Charts template
Category: Cycle, Relationship
Sources Available: .key
Product ID: KC00696
Template incl.: 63 editable slides
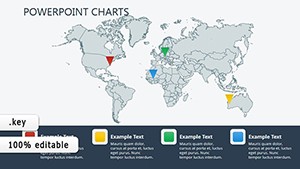
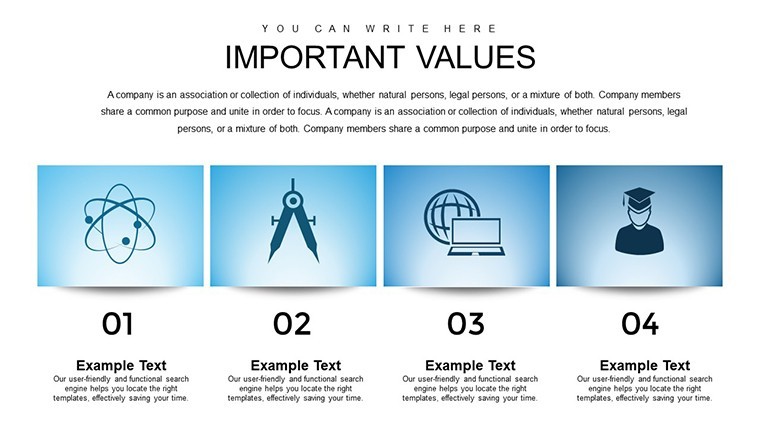
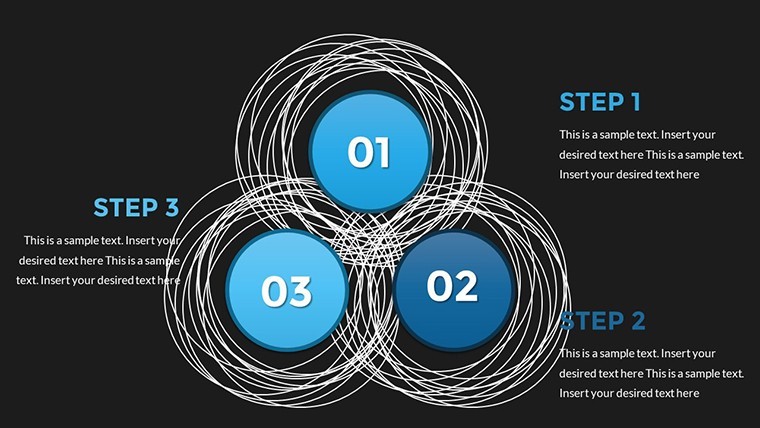
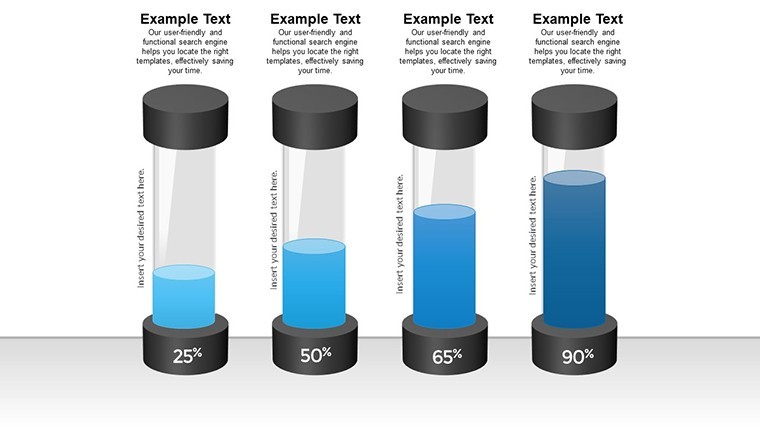
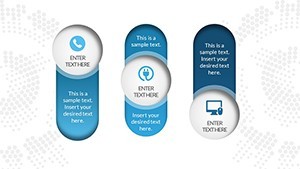
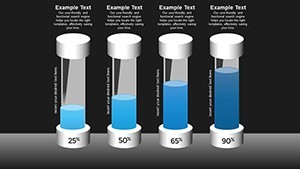
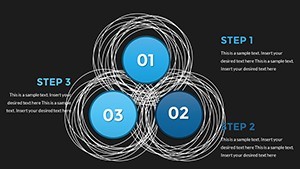
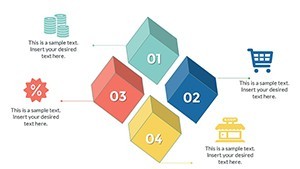
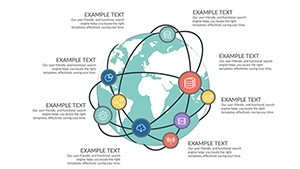
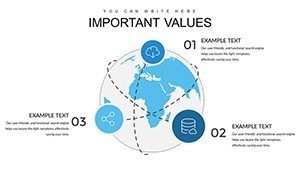
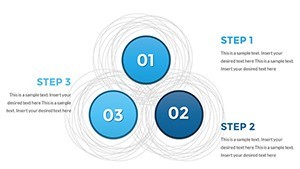
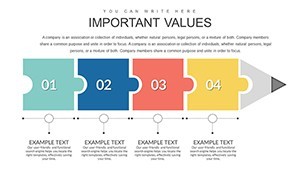
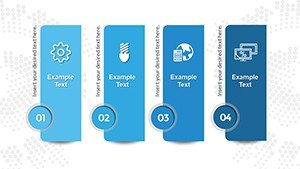
Open the .key file and you get 63 cycle and relationship charts for economic insights.
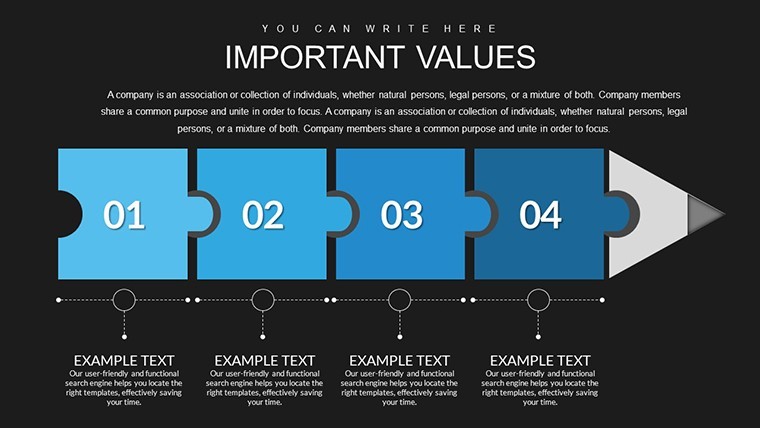
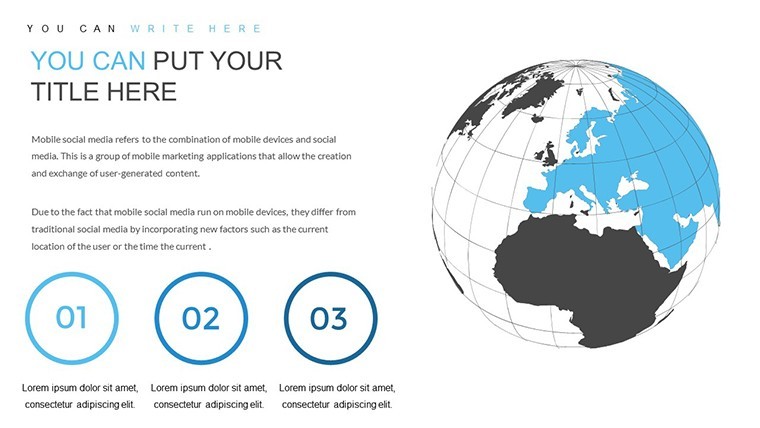
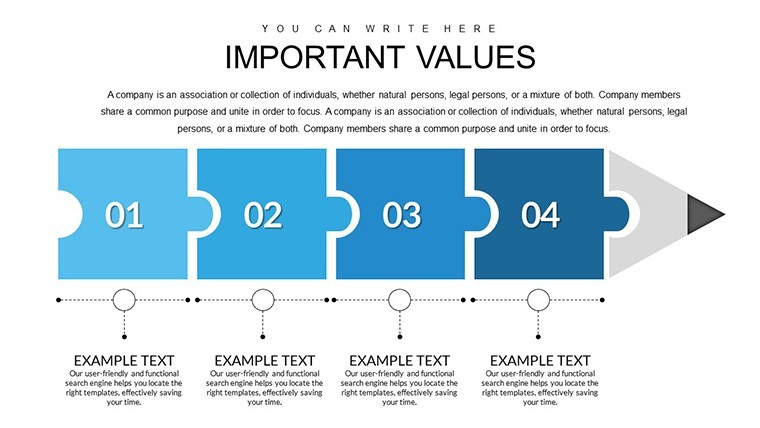
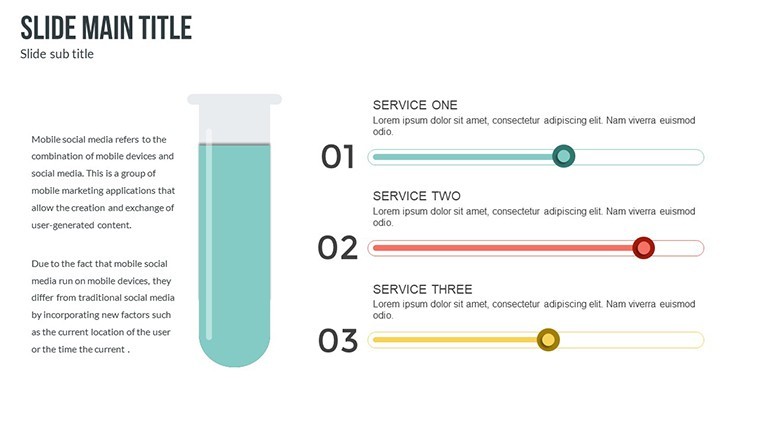
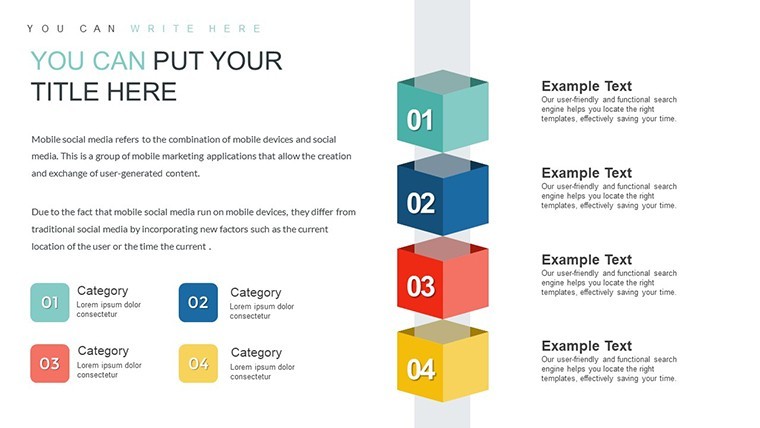
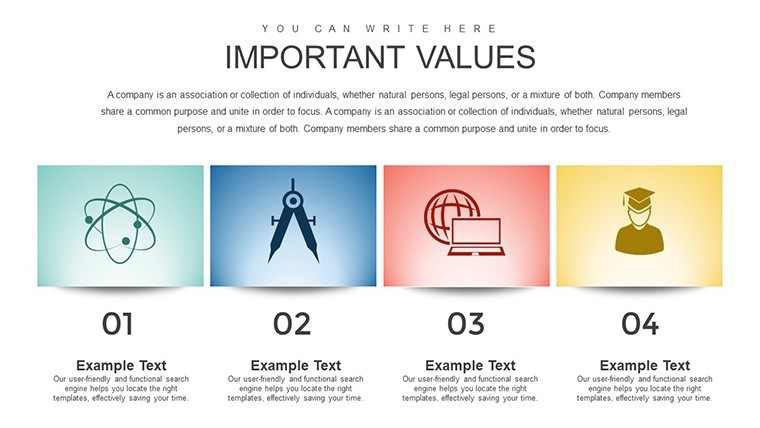
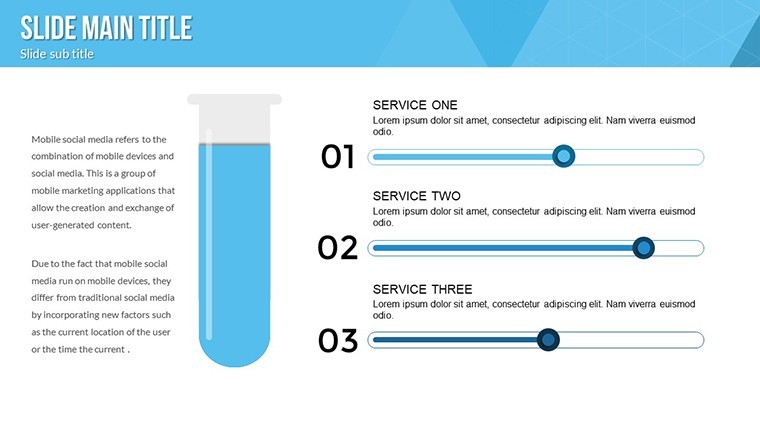
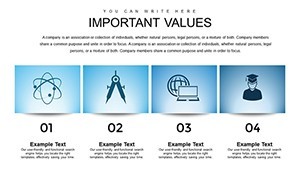
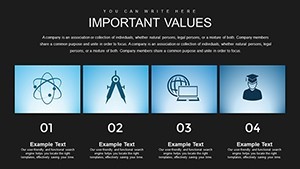
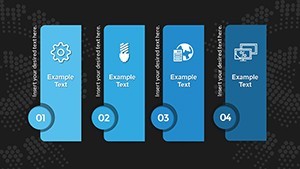
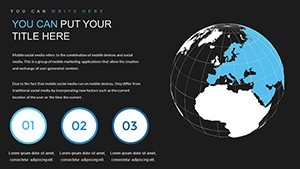
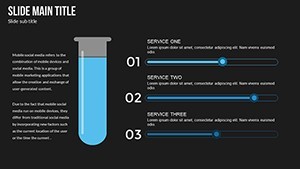
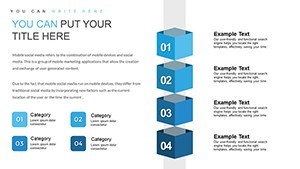
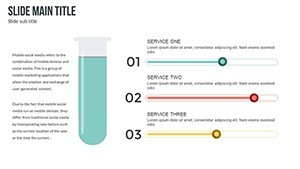
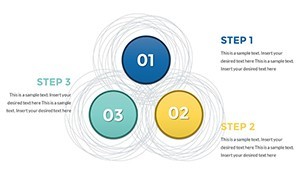
63 editable slides in .key format deliver cycle and relationship diagrams ready for economic policy presentations. No complex layouts just structured blocks.
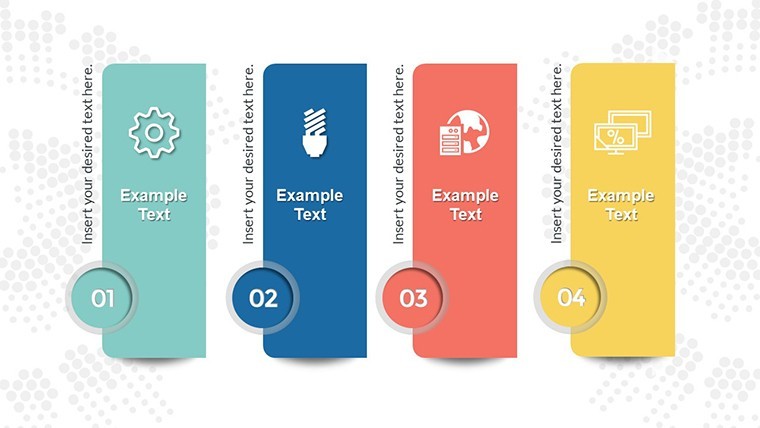
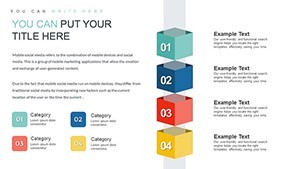
The paid version unlocks all 63 editable slides while previews remain limited. In practice you simply update labels and values. Typically analysts reuse the layouts for recurring forecast updates.
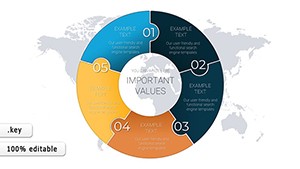
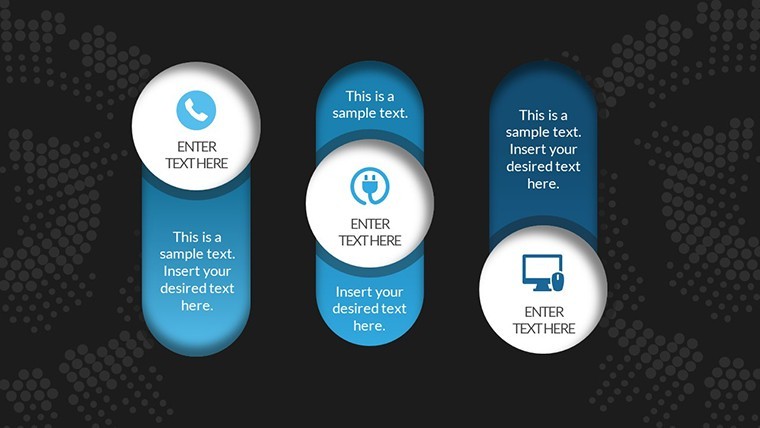
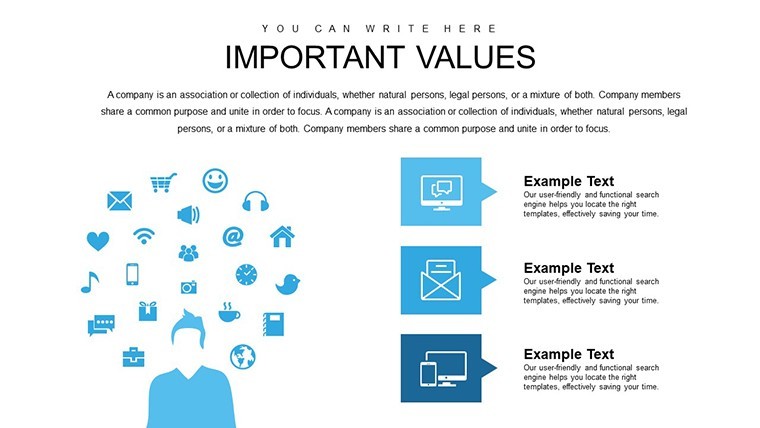
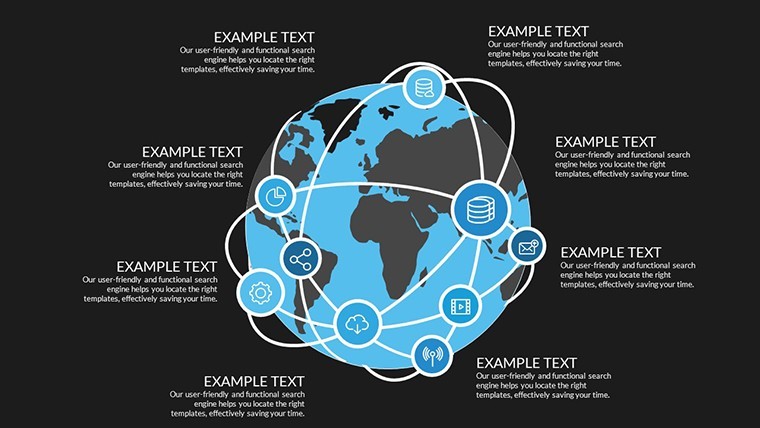
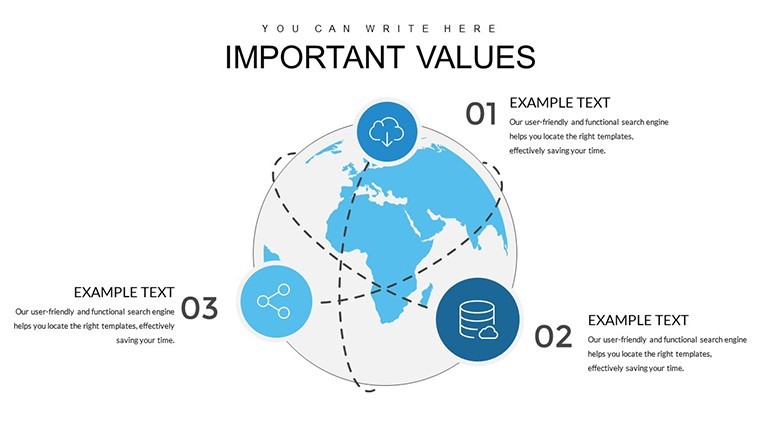
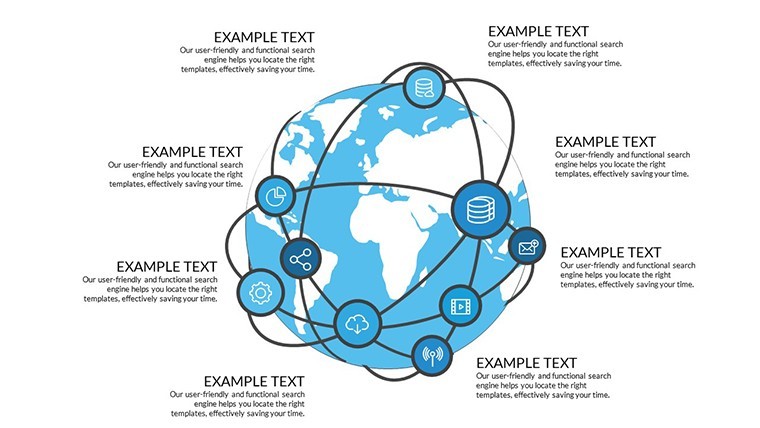
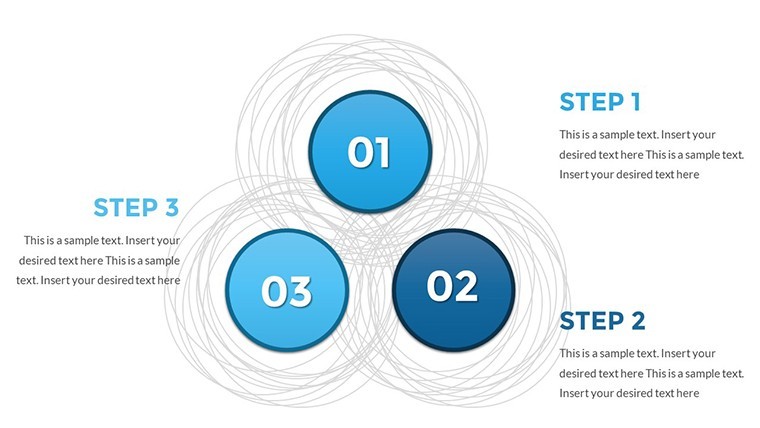
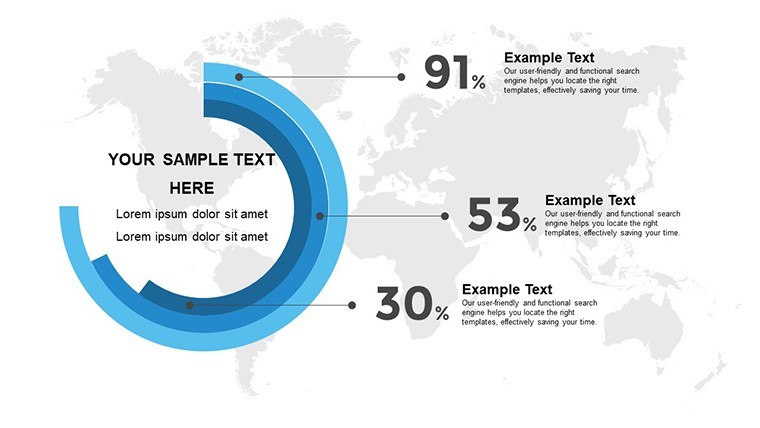
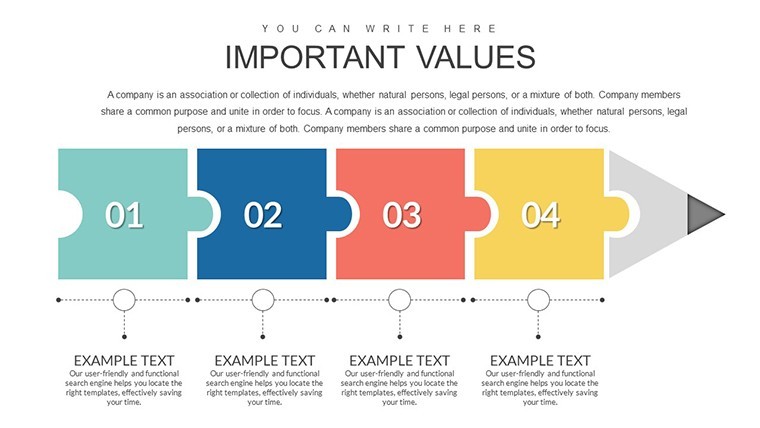
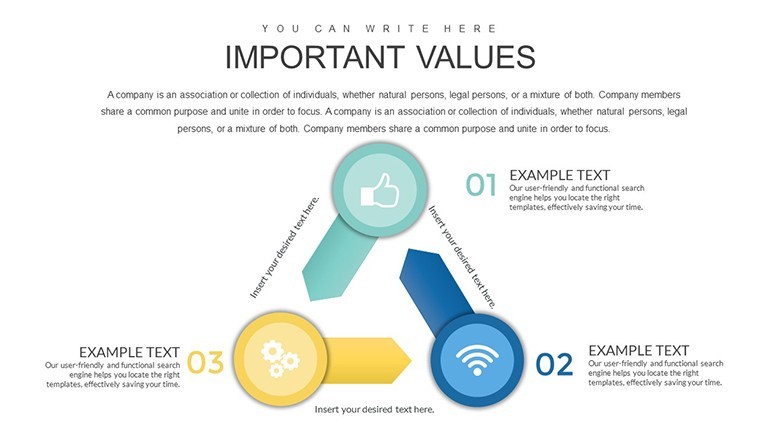
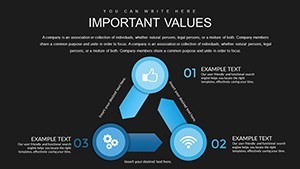
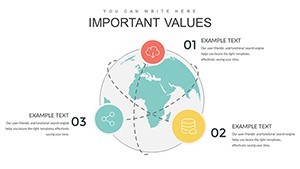
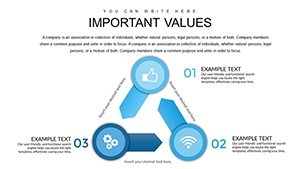
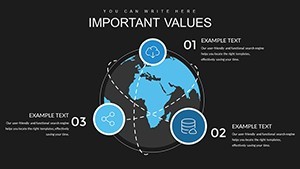
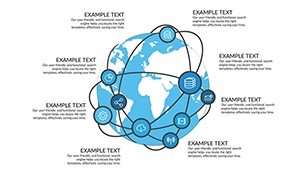
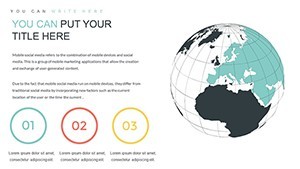
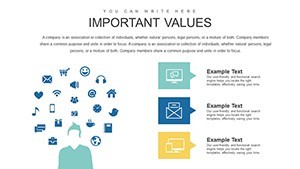
For economists or planners who map trade protections and market cycles the relationship diagrams handle interconnections out of the box instead of drawing flows manually in Keynote. The structure stays readable on one slide preventing overcrowded visuals.
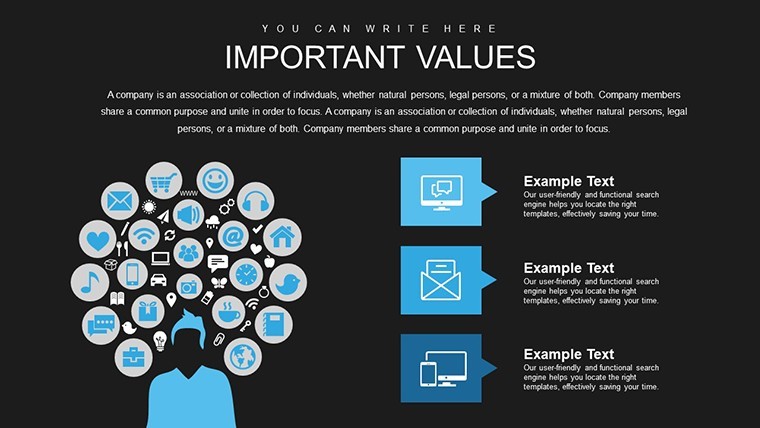
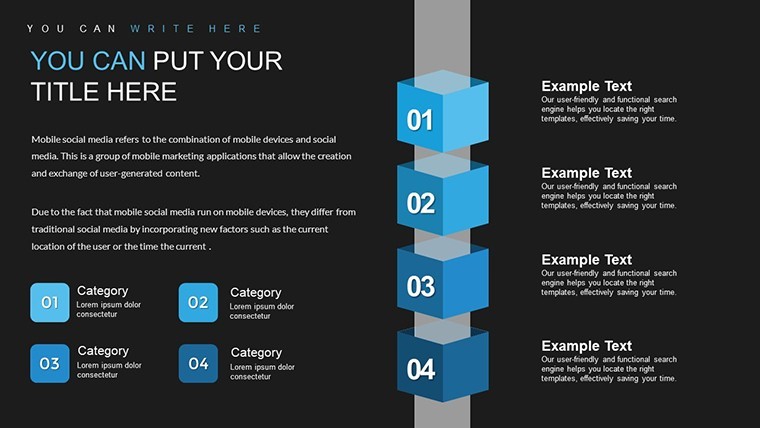
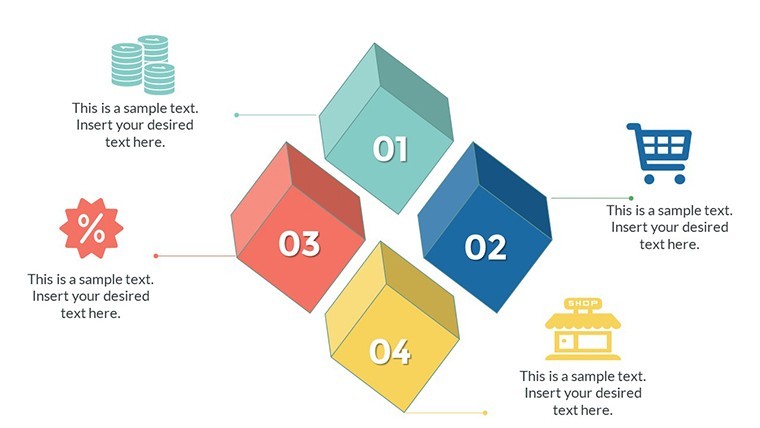
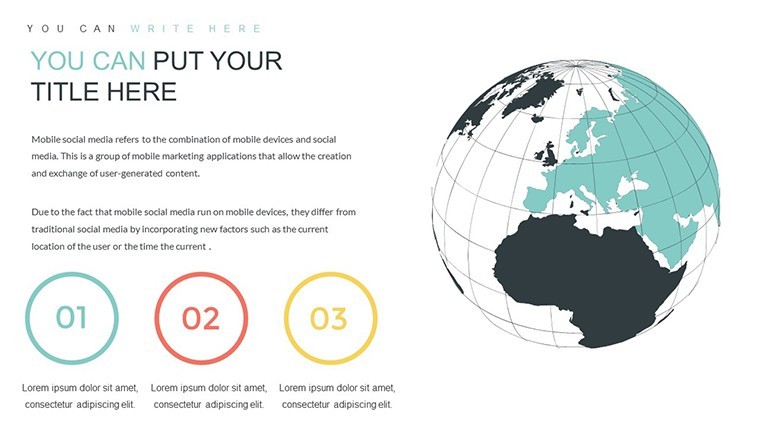
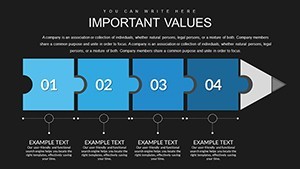
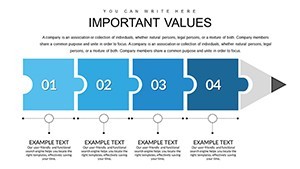
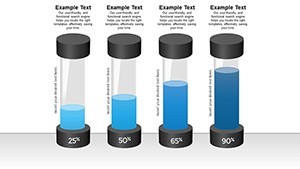
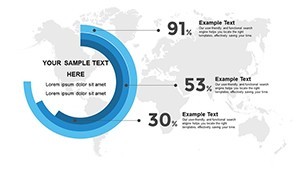
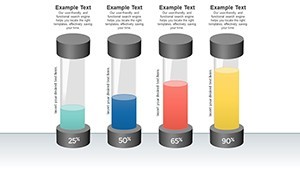
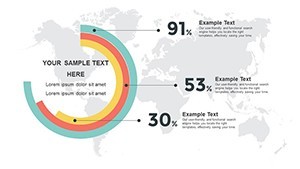
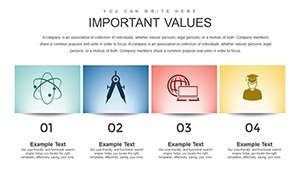
These visuals support relationship and cycle analysis that reveals policy impacts or flow bottlenecks. You reach clear conclusions on protection strategies after viewing the mapped data. Color changes happen in one click on the master.
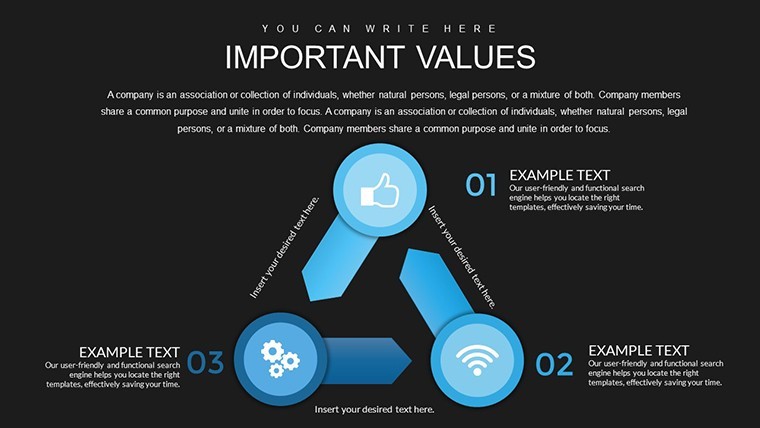
This set fits economists policy makers and business planners who present data regularly. It works best for process mapping not open narrative slides. Not designed for sales pipelines or creative storytelling.
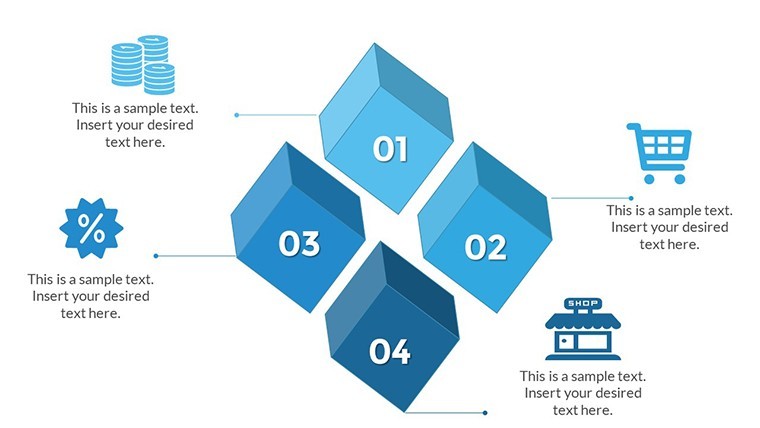
Use this when you need to illustrate economic loops or protectionism effects without manual shape alignment. Check the World Economy Charts Keynote Template or World Economic Outlook Keynote Charts Template for related options.
You open the file and start editing.
Download and start editing immediately
How do I change colors via slide master?
Open Keynote and go to View > Master Slides. Select the master that contains your chart then click any element like a bar or line to pick a new color from the palette. All slides update instantly with one change which is useful when you need to match brand colors across an entire deck.
Can I use this for client work?
Yes one license allows you to create presentations for multiple clients with the purchased template. You may deliver the final exported PDF or video to clients but you cannot resell or share the original .key file itself. This covers both internal and external commercial use.
What is the difference between free and paid versions?
The paid version provides the complete set of 63 editable slides with all charts and layouts fully unlocked. Any free preview if offered contains only sample slides or watermarked versions. The full paid file gives you every vector element and master ready for immediate customization.
What are the refund conditions?
Refunds are available within 14 days of purchase if the template does not meet your needs and you have not used it in any commercial project or exported final files. Contact support with your order details for a prompt full refund. No refunds after the file has been edited or integrated into presentations.
What Keynote version and macOS does this template require?
The files follow standard KEY formats and work with Keynote 6.0 and later on macOS. They also open on iPad and newer iOS versions. No Windows native support but you can run Keynote via virtualization if needed.