4-Step Circular Keynote Charts - Fully Editable | ImagineLayout


Type: Keynote Charts template
Category: Cycle
Sources Available: .key
Product ID: KC00690
Template incl.: 17 editable slides
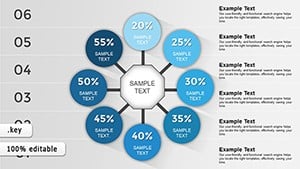
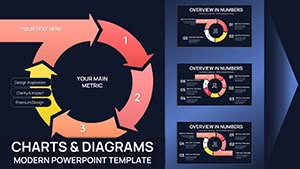
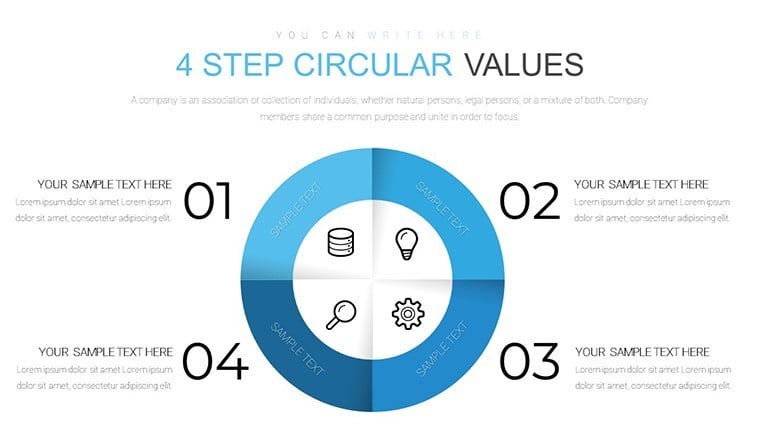
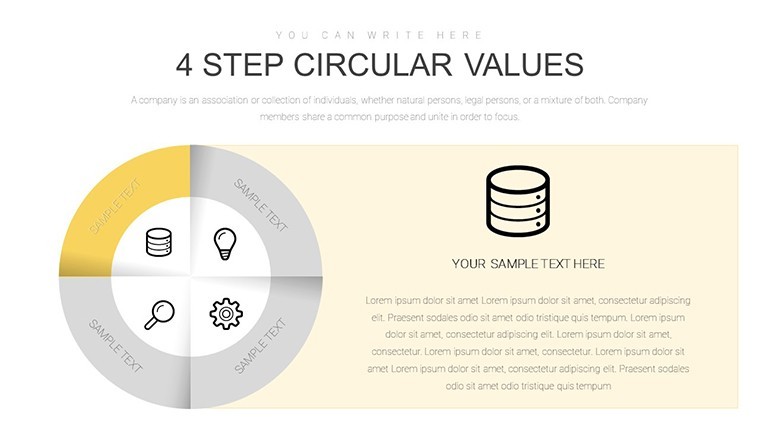
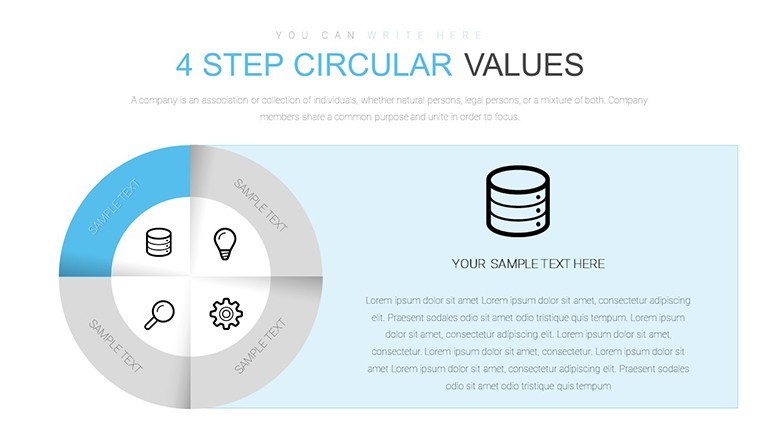
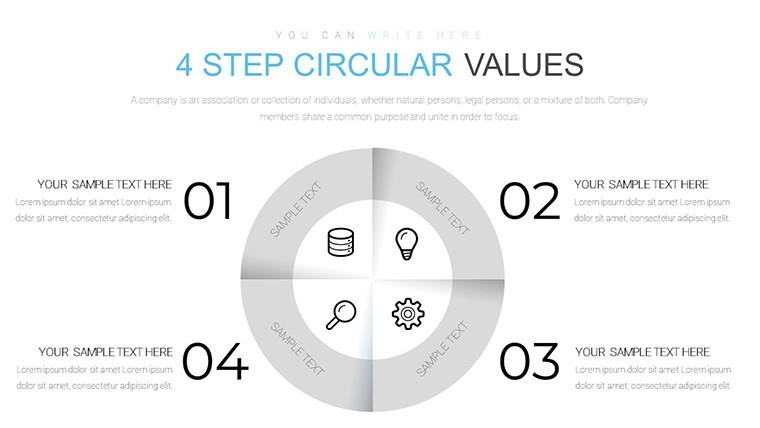
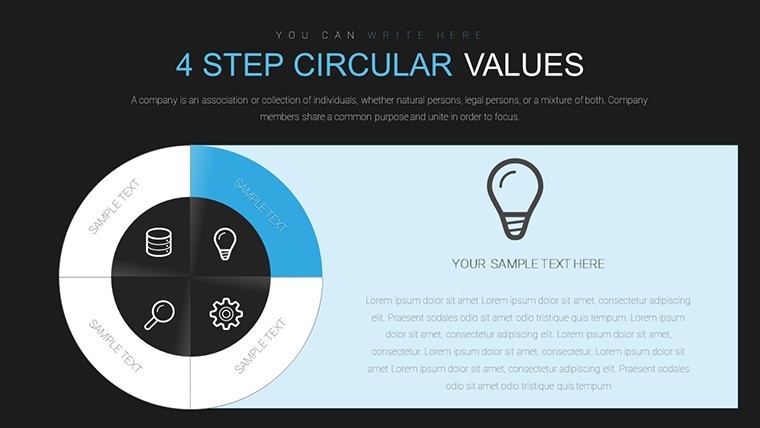
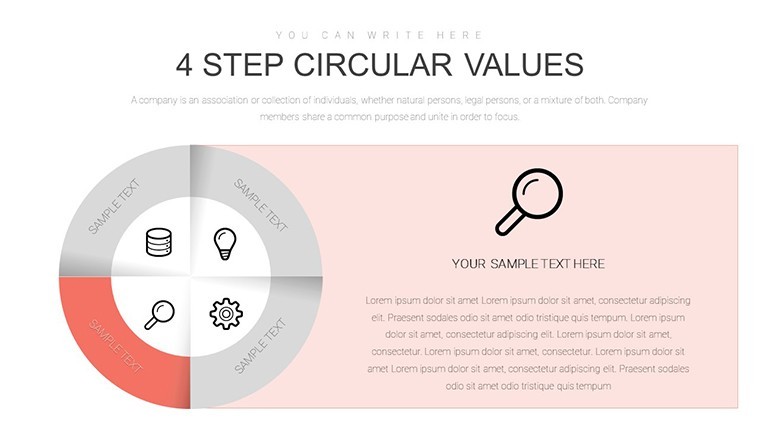
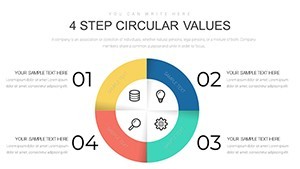
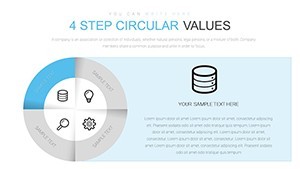
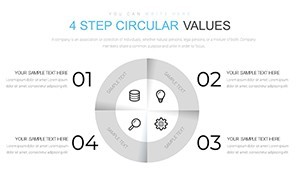
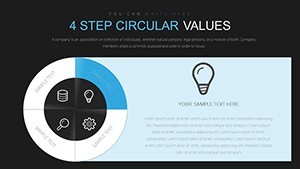
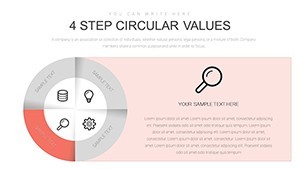
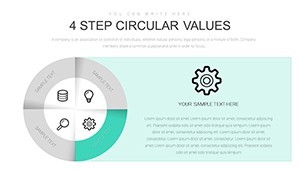
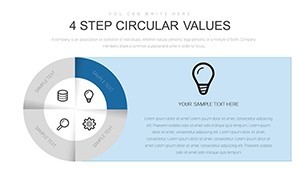
No linear lists here - 17 editable slides use clockwise 4-step circular structures for process cycles.
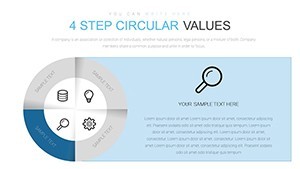
You insert workflow steps into the segments and the layout clarifies repetition for operations reviews. Typically teams only edit text after the first setup.
The paid version supplies the full 17-slide KEY file.
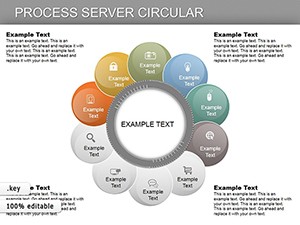
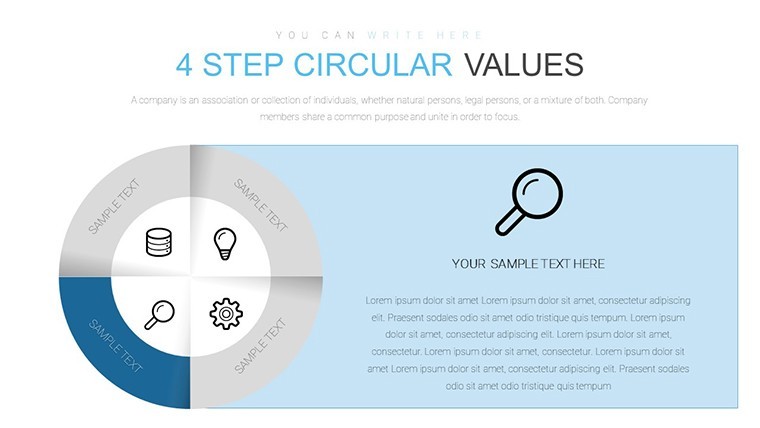
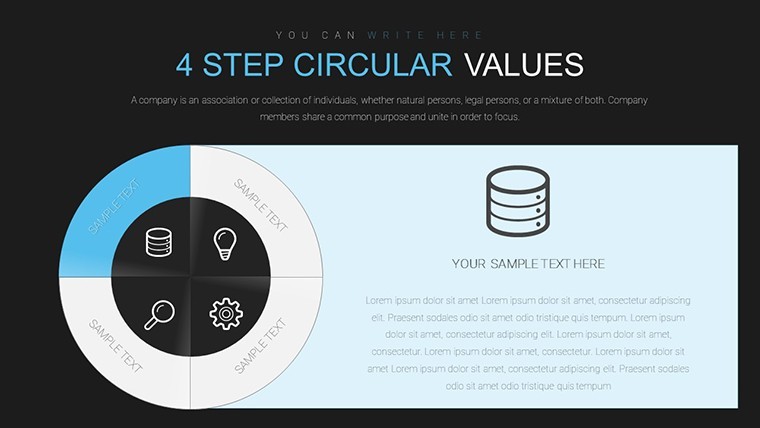
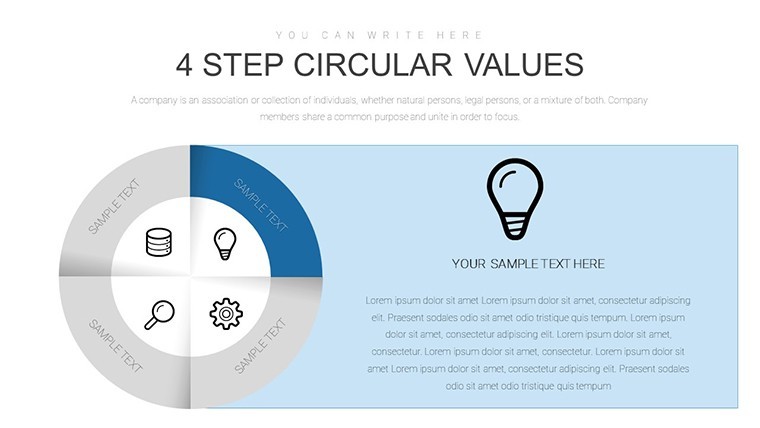
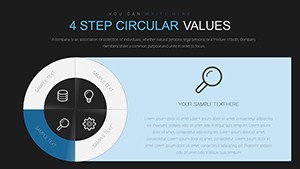
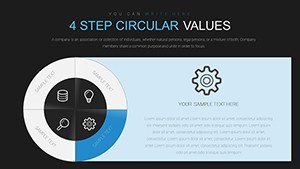
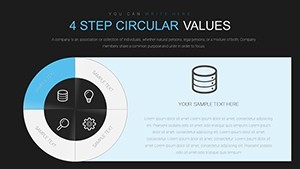
Clockwise progression with arrows for directionality and filled icons creates grid-based layout with balanced spacing. You update colors once in the slide master and the entire cycle set refreshes.
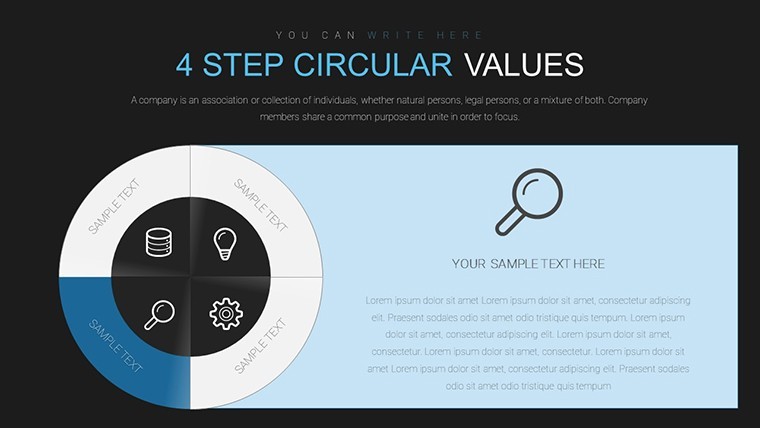
This suits operations managers mapping recurring tasks for internal reporting. When you need to show cycle workflows without arranging arrows manually the circular template manages the flow out of the box.
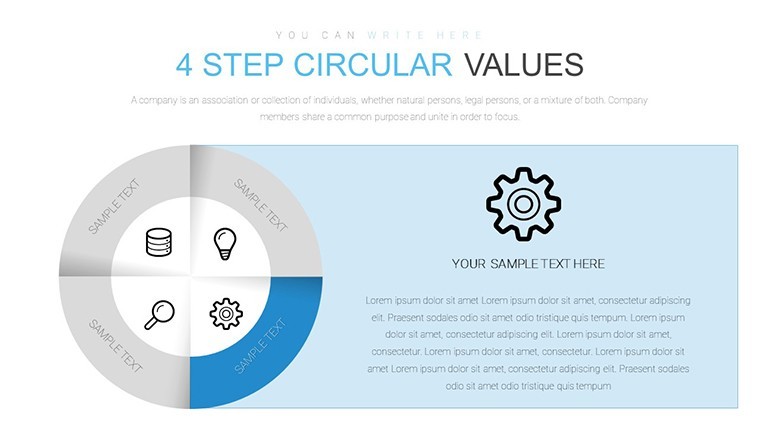
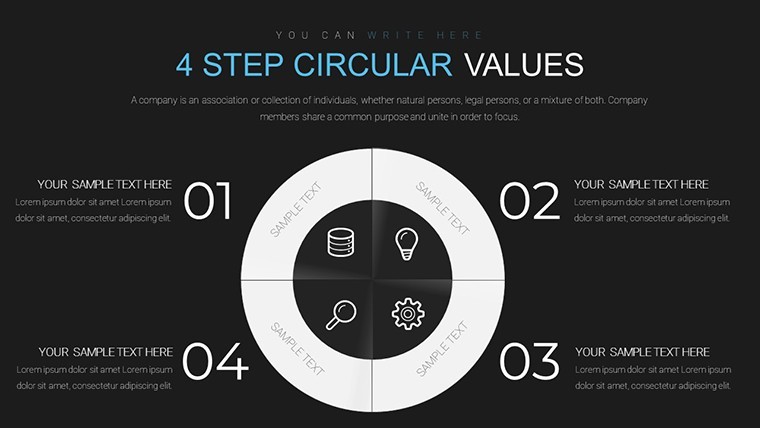
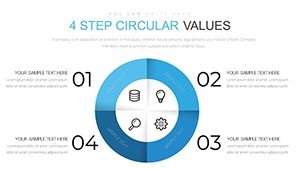
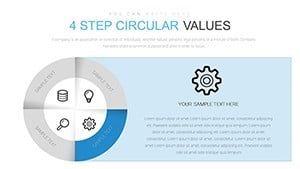
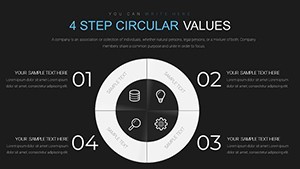
Cycle analysis clarifies bottlenecks because the loop structure reveals dependencies at a glance. Viewers see where repetition slows output and reach optimization decisions based on visible sequence gaps.
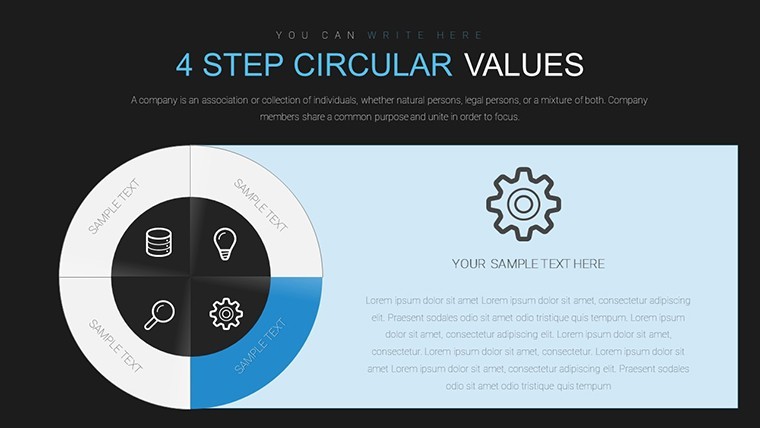
Use this when you need to keep cycle steps readable in a single slide. The predefined arrows maintain alignment so you skip manual repositioning.
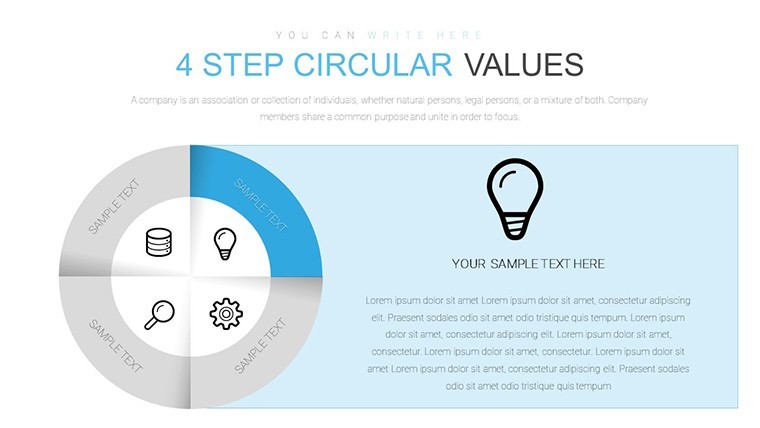
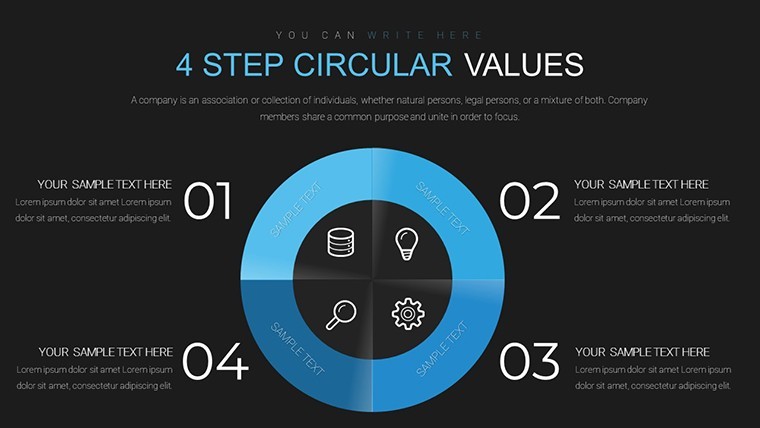
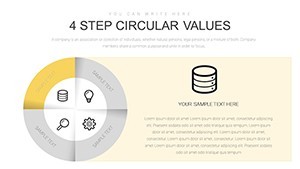
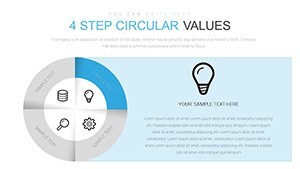
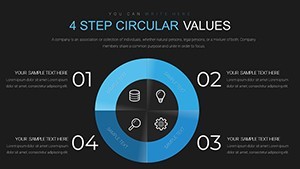
Best used for processes with four to eight repeating stages. It is not ideal for one-way timelines or for data sets requiring radial proportion views.
You can duplicate slides and reuse the same structure.
| Feature | Details |
|---|---|
| Slides / diagrams | 17 cycle chart layouts |
| File format | .key |
| Software version | Keynote 12+ (standard KEY format compatible with current installations) |
| Color schemes | Switch via slide master in one click |
| Editable elements | Text, arrows and segment colors resize independently |
| Aspect ratio | 16:9 |
| Free vs Paid | Paid includes full 17 editable slides |
| Masters / Backgrounds | Standard master slides for theme updates |
You open the file and start editing.
Download and start editing immediately
How do I change colors via slide master?
Changing colors starts with opening the slide master view in Keynote. Update the theme palette once and all 17 circular slides reflect the change instantly across every arrow and segment. This approach saves hours when you need consistent branding for multiple process reviews in practice.
Does the license allow client work?
The license allows use for client work after purchase. You can customize the charts and deliver them in presentations for paying clients without additional fees. Standard terms apply with attribution not required for end use.
What is the difference between free and paid?
The paid version includes the complete 17 editable slides ready for immediate use while any free preview may show only sample diagrams. Full access comes with the purchase to unlock all cycle variations. You get the KEY file without watermarks or restrictions.
What are the refund conditions?
Refunds are available within 14 days if the file does not open in your Keynote installation. Contact support with the order details for processing. No refunds after successful download and use of the template.
Which Keynote version and macOS is required?
The template works in Keynote 12 and newer versions on macOS. It requires macOS Ventura or later for full compatibility with latest features. Older versions may need file conversion but the structure remains intact.
See also Circumvolution Keynote Charts Template or Circular Process Keynote Charts for more cycle options.