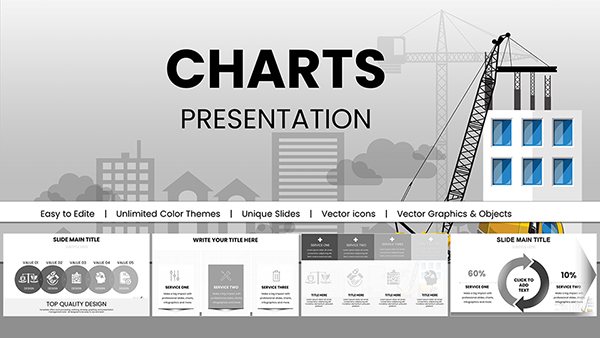
Modern Professional Keynote Charts Template: Mapping Connections


Type: Keynote Charts template
Category: Relationship
Sources Available: .key
Product ID: KC00618
Template incl.: 14 editable slides
Envision elevating your strategic discussions with slides that not only inform but inspire collaboration. Our Modern Professional Keynote Charts Template, focused on relationship visuals, delivers exactly that with 14 editable slides optimized for Apple Keynote. This collection is a game-changer for professionals who deal in networks, hierarchies, and interconnections, transforming abstract concepts into tangible, engaging diagrams that drive understanding and innovation.
Rooted in design theories from experts like Don Norman, emphasizing user-centered visuals, this template features clean lines and modern aesthetics to facilitate better comprehension of complex relationships. It's perfect for business strategists, HR specialists, and educators seeking to illustrate organizational structures or process flows with sophistication.
Unpacking the Features of Relationship Charts
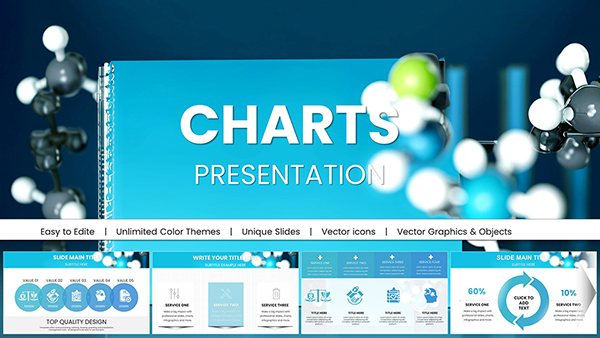
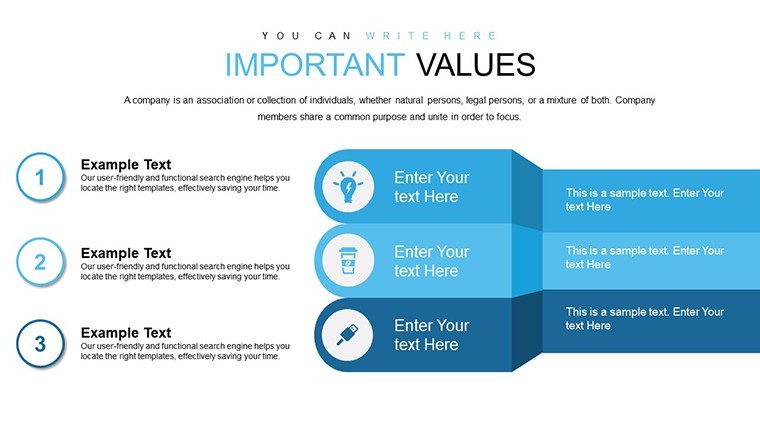
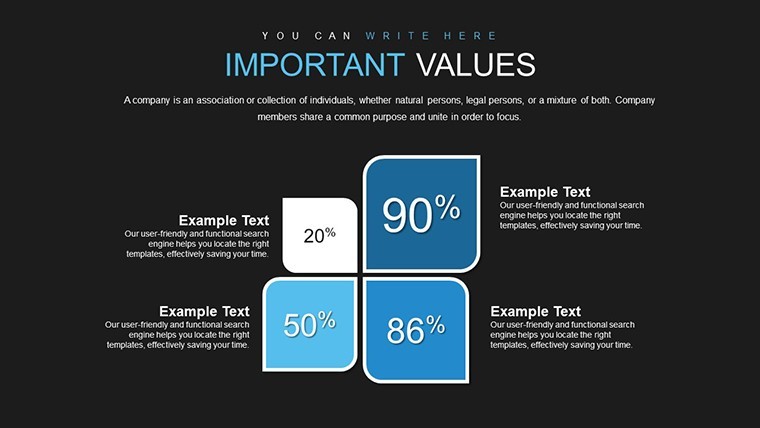
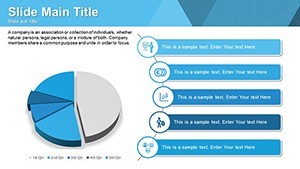
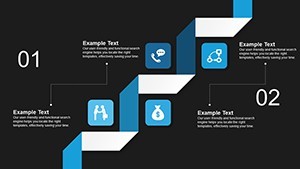
This template boasts colorful variations, allowing you to select palettes that resonate with your audience - cool blues for corporate calm or vibrant accents for creative sparks. Custom animations bring diagrams to life, such as sequential builds that reveal connections step-by-step, enhancing narrative flow.
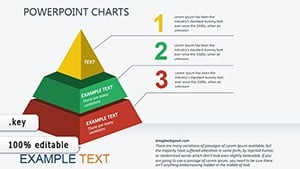
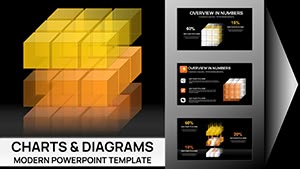
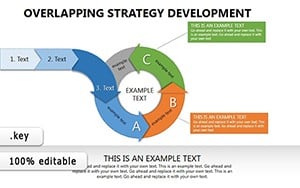
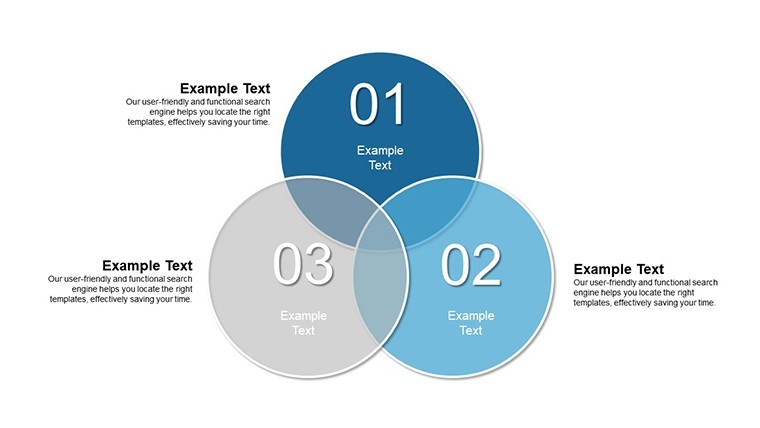
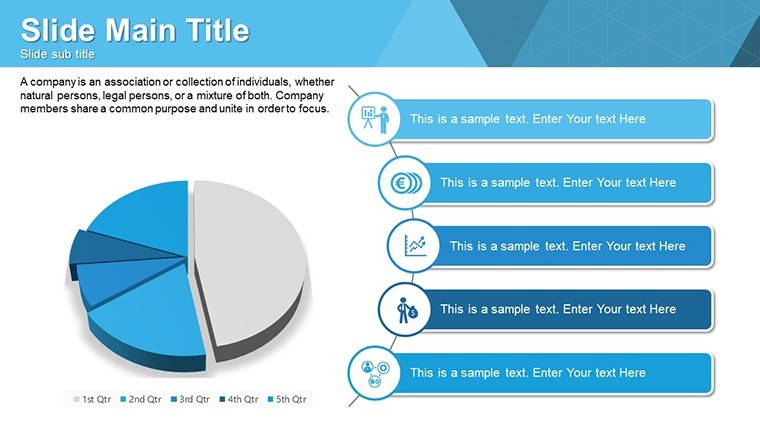
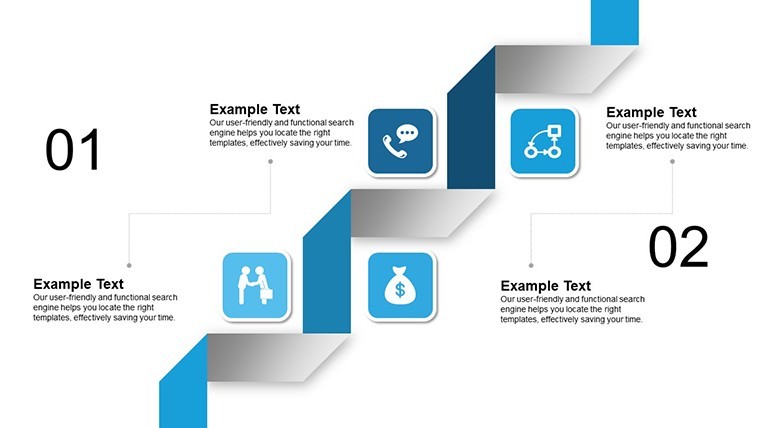
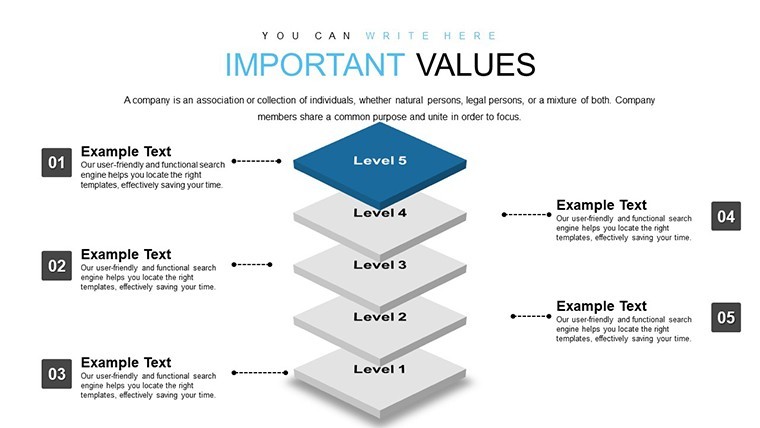
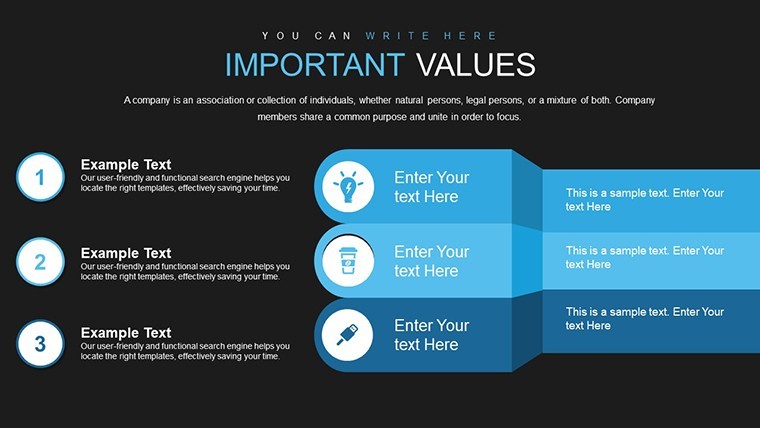
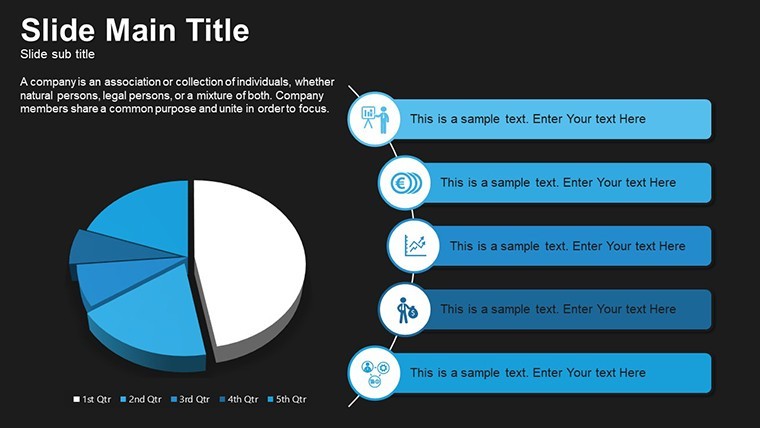
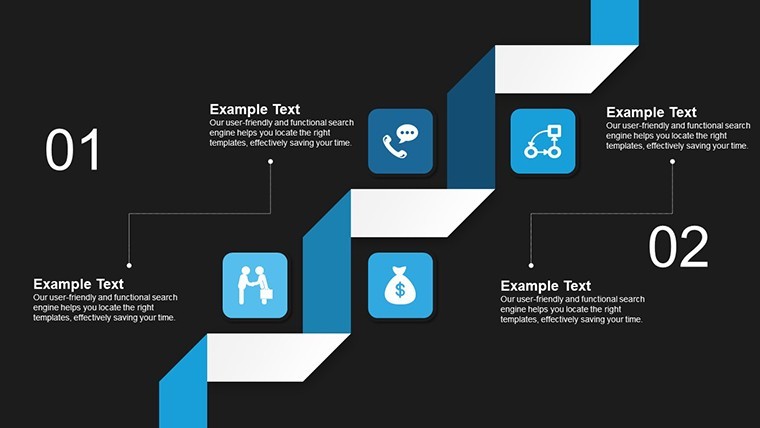
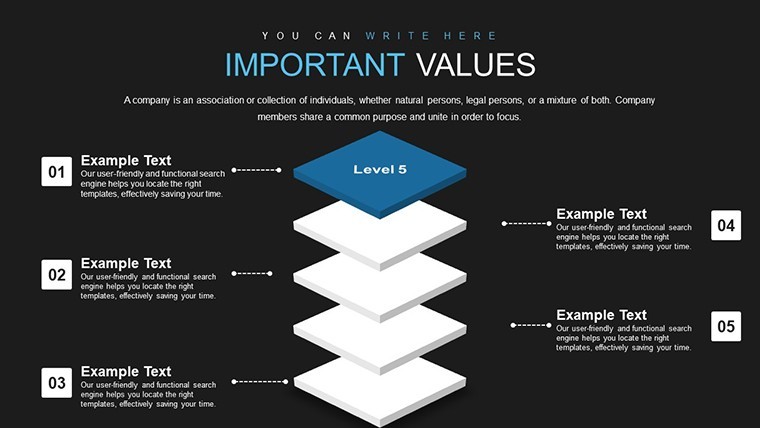
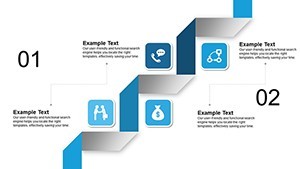
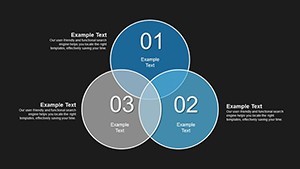
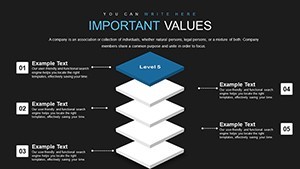
Vector icons and PNG inclusions provide scalable elements for high-res detail, editable to fit themes like team dynamics or supply chains. Slides cover diverse formats: Org charts for hierarchies, flow diagrams for processes, Venn diagrams for overlaps, and network maps for ecosystems.
Fully editable, change texts, colors, or insert photos effortlessly, surpassing Keynote's basics by offering pre-animated transitions that save design time. This ensures your presentations stand out in competitive environments, like consulting pitches.
Delivering Value Through Visual Mastery
For consultants, use org charts to depict client structures, highlighting synergies per McKinsey frameworks. The animations add professionalism, making proposals more compelling. In HR, relationship diagrams map employee networks, aiding talent management with insights from Gallup studies on engagement.
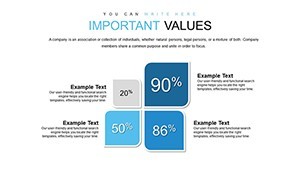
Educators employ Venn slides for comparative analyses, fostering interactive learning. Benefits include reduced preparation time and increased audience retention, as visuals process 60,000 times faster than text, per neuroscience research.
Industry-Specific Applications and Tips
In marketing, flow charts outline customer journeys, integrating with CRM data for personalized visuals. Strategists use network maps for competitor ecosystems, referencing Porter's Five Forces.
To customize, start with your data outline, then apply icons - drag-drop for intuition. Pro tip: Use color theory; analogous schemes for harmony in relationship visuals.
Integration with tools like MindMeister exports mind maps directly. Case study: A consulting firm revamped their deliverables with animated relationships, boosting client satisfaction by 30%, as per internal metrics.
Advanced Customization and Professional Edges
Layer animations for depth, like pulsing nodes in networks. This template excels over free alternatives with included assets, ensuring E-A-T through polished outputs. Ready to connect ideas? Secure this template and map your success.
Frequently Asked Questions
- How do animations enhance the charts?
- They reveal elements progressively, building engagement and clarity in presentations.
- What vector icons are included?
- A variety for relationships, like arrows, nodes, and figures, all scalable.
- Easy for beginners?
- Yes, intuitive edits with drag-drop functionality.
- Export options?
- To PDF, PNG, or video for broad compatibility.
- Theme variations?
- Multiple color sets for branding alignment.