Imagine standing in front of a room full of stakeholders, confidently unveiling the story behind your website`s traffic patterns and user engagement. That`s the power this Web Analytics Keynote template brings to your fingertips. Designed specifically for professionals in digital marketing, this ready-made presentation tool transforms complex web data into visually compelling narratives that drive decisions.
With the global web analytics market projected to reach $6.26 billion in 2025 and grow to $20.09 billion by 2032, the need for clear, impactful visualizations has never been greater. This template equips you with 28 meticulously crafted diagrams, each adaptable to showcase metrics like bounce rates, conversion funnels, and session durations. Whether you`re analyzing SEO campaigns or ad performance, these slides ensure your audience grasps the big picture without getting lost in numbers.
Built for Keynote on macOS, it`s compatible with versions 2016 and later, offering seamless integration into your workflow. Customize effortlessly with drag-and-drop elements, and rest assured of a one-time license for lifetime use across your projects. Let`s dive deeper into how this template can supercharge your presentations.
Key Features of the Web Analytics Keynote Template
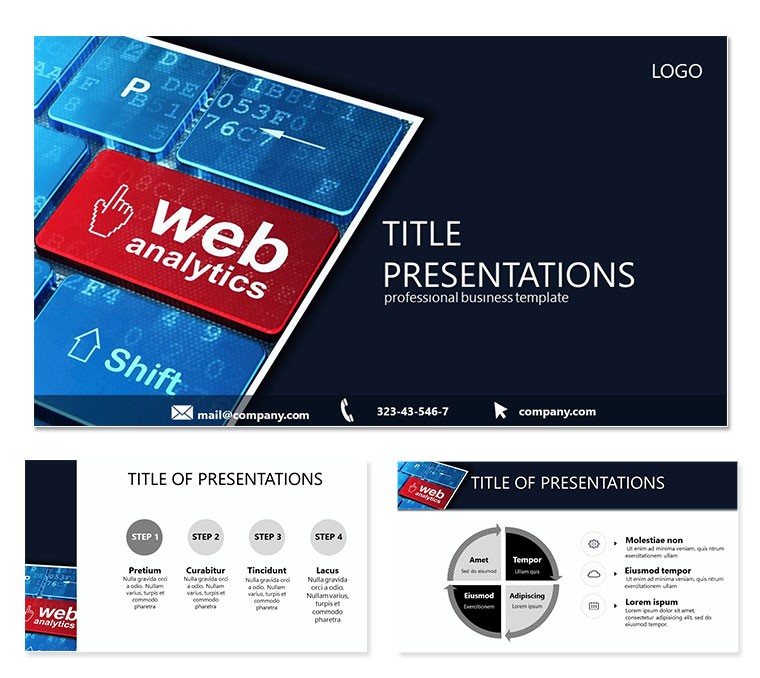
This template isn`t just a collection of slides - it`s a strategic asset for any marketer. Starting with three professional master layouts, you can maintain brand consistency across your deck. The three background options provide flexibility: opt for a sleek minimalist design for executive summaries or a vibrant data-themed backdrop for detailed reports.
At its core are the 28 diagrams, each available in seven color schemes to match your company`s palette or audience preferences. From pie charts breaking down traffic sources to flowcharts mapping user journeys, every element is vector-based for crisp scalability. Sources include .key and .kth files, ensuring full editability in Keynote.
- Diagram Variety: Includes bar graphs for comparative analysis, line charts for trend tracking, and infographics for holistic overviews.
- Customization Ease: Adjust colors, fonts, and data inputs without design skills - ideal for quick iterations before client meetings.
- Professional Polish: High-resolution elements that look sharp on any screen, from laptops to conference projectors.
Integration is straightforward: import your Google Analytics or Adobe Analytics exports directly into the slides, and watch the template handle the rest. This saves hours compared to building from scratch in default Keynote tools.
Real-World Applications and Use Cases
In the fast-paced world of internet marketing, where 55.49% of websites rely on tools like Google Analytics as of 2025, presentations must cut through the noise. Use this template for quarterly performance reviews, where a funnel diagram illustrates drop-off points in e-commerce checkouts, helping teams pinpoint optimization opportunities.
For educational webinars on SEO best practices, leverage the timeline slides to demonstrate how organic search rankings evolved over six months. Consultants can pitch services by customizing heat maps to reveal user hotspots on client sites, turning data into persuasive arguments for investment.
Consider a scenario in a startup pitch: Founders use the scatter plot diagrams to correlate ad spend with ROI, impressing investors with evidence-based storytelling. In corporate training sessions, trainers deploy the template to teach analytics basics, making abstract concepts tangible through interactive elements.
Business Scenarios
- Marketing agencies presenting campaign ROI to clients.
- E-commerce managers reviewing site performance metrics.
- Content strategists analyzing audience engagement trends.
Educational and Research Uses
Professors in digital marketing courses can adapt slides for lectures on user behavior modeling. Researchers studying online consumer patterns find the template`s flexibility perfect for conference papers, where visual clarity is key to peer review success.
Why Choose This Template Over Default Keynote Options?
Default Keynote provides basic charts, but they lack the thematic depth and variety needed for specialized topics like web analytics. This template bridges that gap with pre-designed, industry-specific visuals that align with current design trends - think flat icons and subtle gradients popular in 2025 presentations.
| Aspect | Default Keynote | This Web Analytics Template |
|---|
| Diagram Count | Basic 10-15 types | 28 specialized diagrams |
| Color Schemes | Standard palette | 7 customizable schemes |
| Customization Time | Hours of manual design | Minutes with drag-and-drop |
| Thematic Relevance | Generic | Tailored for web data viz |
| Compatibility | Keynote only | Full Keynote + export options |
As shown, the template delivers efficiency and expertise, ensuring your presentations stand out in a crowded digital landscape.
Workflow Integration and Tips for Success
Incorporate this into your routine by starting with data export from your analytics platform, then pasting into the template`s editable fields. For advanced users, layer in animations to reveal insights progressively, building suspense during live demos.
A pro tip: Pair diagrams with concise bullet points to avoid overwhelming viewers - research shows audiences retain 65% more from visuals paired with minimal text. Download this template today and transform your next analytics report into a masterpiece.
FAQ
What software is required for this template?
It`s optimized for Apple Keynote 2016 and later versions on macOS.
Can I use it for commercial purposes?
Yes, the one-time license allows unlimited commercial and personal use.
How many color options are available?
Seven schemes for diagrams, plus flexible backgrounds.
Is it editable for beginners?
Absolutely - intuitive design makes it user-friendly for all skill levels.
Does it include sources for diagrams?
Yes, .key and .kth files for full customization.